 Open Access Article
First-principles study of the effect of dopants (Pd, Ni) on the formation and desorption of T2O from a Li2TiO3 (001) surface
Yiyu Fang a,
Xianggang Kongb,
You Yub,
Xiaotong Zhanga,
Xiaojun Chenc,
Tao Gao*ad,
Chengjian Xiao*c and
Tiecheng Lud
aInstitute of Atomic and Molecular Physics, Sichuan University, Chengdu 610065, People's Republic of China. E-mail: gaotao@scu.edu.cn
bCollege of Optoelectronic Technology, Chengdu University of Information Technology, Chengdu 610225, China
cInstitute of Nuclear Physics and Chemistry, China Academy of Engineering Physics, Mianyang 621900, China. E-mail: xiaocj@caep.cn
dDepartment of Physics, Key Laboratory for Radiation Physics & Technology of Ministry of Education, Sichuan University, Chengdu 610065, People's Republic of China
First published on 13th March 2019
Abstract
We investigated the effect of Pd and Ni dopants on the formation and desorption of tritiated water (T2O) molecules from the Li2TiO3 (001) surface using first-principles calculations coupled with the climbing-image nudged elastic band method. We calculated the energy barriers for T2O production and desorption on the pure Li2TiO3 surface to be 0.94 and 0.64 eV, respectively. The Pd and Ni dopants enhanced T2O formation by reducing the formation energy of O vacancies, and T2O generated spontaneously on the dopant surface. Moreover, we found that dopant atoms affect the charge transfer of neighboring atoms, which leads to orbital hybridization and the generation of a chemical bond between the O and T on the doped Li2TiO3 surface. In addition, desorption of T2O from the doped Li2TiO3 surface requires a relatively low energy (<0.50 eV). This theoretical study suggests that doping the Li2TiO3 surface with metal atoms is an effective strategy for producing T2O molecules and is beneficial to T release.
1. Introduction
Tritium breeding blankets and energy extraction are crucial for the development of deuterium–tritium (D–T) nuclear fusion power reactors. Most designs of D–T fusion reactor blankets use solid lithium ceramics as the breeder material because it is thermodynamically, chemically and mechanically stable, has a high lithium density and melting point, and excellent tritium release properties. Consequently, breeder blankets based on lithium ceramics can withstand high temperatures and extended periods of radiation at high temperature gradients.1–3Compounds such as Li2O, LiAlO2, Li4SiO4, Li2SiO3, Li2ZrO3, Li2SnO3, and Li2TiO3 (ref. 4–10) are considered to be the most favorable candidates for breeding blankets. For example, in the helium-cooled solid pebble beds (HCSPB) design of the International Thermonuclear Experimental Reactor (ITER), Li2TiO3 is used.11,12 Experimental studies have revealed the detailed mechanisms of the tritium generated after the nuclear reaction. Li2TiO3 has excellent performance at in low activity, such that the neutrons can penetrate the Li2TiO3 matrix easily. The tritium must then diffuse to the pebble surface, where it transfers to a surface water layer before undergoing isotope exchange. And tritium will be adsorbed on the surface of the lithium ceramic forming hydroxyl groups.11,13 The amount of tritium retained in Li2TiO3 is the lowest in the crystal particles, and the tritium mainly remains in the surface layer and the interface layer of the crystal particles.14 Moreover, the desorption of tritium from the ceramic surface is the rate-determining step in the tritium extraction process. Ineffective tritium release and collection affects the supply of raw materials for the fusion reaction, and leads to structural change and volume expansion of the ceramic.15
The tritium release behavior of Li2TiO3 ceramics has been widely investigated. It was found that the release rate is improved at temperatures above 873 K.11 Moreover, when a palladium is deposited on the surface of Li2TiO3 or Li4SiO4, it is likely to promote the isotope exchange reaction on the surface of the breeder, improving the release efficiency of tritium will be greatly improved at low temperature.16 In another study, dopant atoms, such as Pt, Pd and Ni, in the surface of lithium silicate material were also shown to improve the release efficiency of tritium.17,18 In addition, doping of Mg or Pt in LiAlO2, the release of tritium at low temperature by reducing the desorption activation energy of tritium on the surface.19 Furthermore, it was found that the effect of the catalyst on the isotopic exchange reaction of Li2TiO3 was more pronounced than that of Li4SiO4.16 In light of these experimental observations, it is vital to conduct theoretical studies on the effect of metal impurities on the Li2TiO3 surface.
Few theoretical investigations have been reported about the release behavior of tritium from the Li2TiO3 surface. Therefore, the aim of this work was to determine the release behavior of tritium (especially the effect of Pd and Ni) on the surface of a Li2TiO3 breeder using density functional theory (DFT). The results of this work may have important implications for the application of Li2TiO3 breeders and can also guide future experimental studies into the release of tritium.
2. Theory and methods
All calculations presented herein were carried out with the projector-augmented wave (PAW) formalism of density functional theory (DFT),20 as implemented in the Vienna Ab initio Simulation Package (VASP).21,22 The generalized gradient approximation (GGA) of Perdew–Burke–Ernzerhof (PBE)23 was used to calculate the exchange–correlation energy. According to the Born–Oppenheimer approximation, the motion of nuclei and electrons in a molecule can be separated, and systems with T and H atoms have same electronic properties if nuclear motion is not considered. Because this study does not involve vibrational calculations, we used the same properties (e.g., formation energy, desorption energy, local density of state (LDOS), Bader charge, charge density difference (CDD) and other charge properties) for systems with T and H atoms.24 According to the convergence test, a 3 × 3 × 1 grid of Monkhorst–Pack K-point meshes in the Brillouin zone can be used for geometry optimization of the supercell.25 We set the cut-off energy for plane-wave expansion to 500 eV. The convergence of the total energy is considered to be achieved until two iterated steps with energy difference less than 10−5 eV and we considered that the convergence criterion for structural optimization was reached when the maximum force acting on each atom was less than 0.01 eV Å−1.Bader charge analysis, CDD and LDOS were used to analyze the charge transfer. We calculated the energy barriers for the formation and desorption of T2O on pure Li2TiO3 and doped Li2TiO3 surfaces using the climbing-image nudged elastic band (CI-NEB) method.26 In this method, six images were inserted to identify the transition state between the initial state and final state configurations. At low temperature, Li2TiO3 crystallizes in the Li2SnO3-type β-Li2TiO3 structure with the space group C2/c.27,28 The unit cell of Li2TiO3 is shown in Fig. 1. The equilibrium structure was determined by relaxation with respect to the lattice parameters a, b, and c. The agreement of a, b, c (a = 5.09 Å, b = 8.84 Å, and c = 9.67 Å) with experimental results (see Table 1) was very satisfactory.27,29
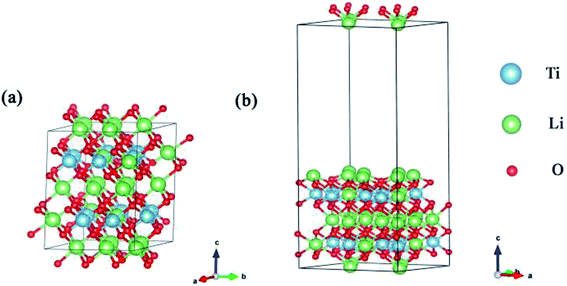 | ||
| Fig. 1 (a) is the lattice structure of the Li2TiO3 unit cell and (b) is the (001) surface. The blue, green and red spheres represent the Ti, Li and O atoms, respectively. | ||
To determine the most stable surface, we examined the low Miller index surfaces of Li2TiO3 by calculating the surface formation energy. The surface energy was calculated according to the following equation:
 | (1) |
We calculated the (001) plane to be the most thermodynamically stable among the seven low-index surfaces (Table 2), which is consistent with the results of a previous experimental study.30 When the different atomic termination surfaces (Li-termination slab, Ti-termination slab and O-termination slab) are optimized, the Li-termination slab is the most stable structure, as shown in Table 3. So the Li-termination slab of the surface (001) as the model with 2 × 1 × 1 supercell slab consisting of nine atomic layers. Our convergence tests showed that a single-layer slab is sufficiently thick for our surface model, which contains 96 atoms. The coordinates of the atoms in the upper five layers of the slab are relaxed, while the rest of the atoms in the lower five layers of the slab are constrained at their bulk positions. The theoretical equilibrium lattice parameters of the surface are a = 10.19 Å, b = 8.84 Å and c = 24.66 Å. A vacuum layer of 15 Å was placed along the z-direction to eliminate the interaction between periodic surface images in Fig. 1(b).
| Surface | a (Å) | b (Å) | S (Å) | Ec (eV) | Es (eV) | Esurf (eV) |
|---|---|---|---|---|---|---|
| (001) | 10.193 | 8.866 | 90.381 | −336.128 | −657.386 | 0.162 |
| (010) | 19.627 | 5.097 | 82.256 | −336.128 | −647.348 | 0.302 |
| (100) | 17.692 | 9.813 | 173.632 | −336.128 | −582.402 | 0.518 |
| (011) | 20.419 | 11.832 | 134.372 | −336.128 | −627.653 | 0.332 |
| (101) | 19.628 | 10.209 | 135.589 | −336.128 | −647.542 | 0.182 |
| (110) | 19.627 | 10.209 | 200.372 | −336.128 | −619.641 | 0.263 |
| (111) | 10.194 | 13.212 | 98.086 | −336.128 | −571.247 | 1.122 |
| Surface | Li-termination | Ti-termination | O-termination |
|---|---|---|---|
| Energy (eV) | −657.392 | −511.852 | −501.967 |
3. Results and discussions
3.1 Monolayer Li2TiO3 doped with Pd/Ni
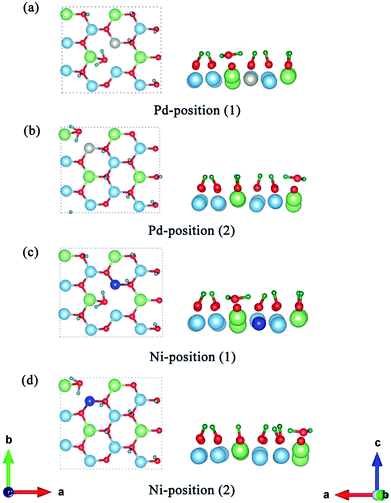
To explore the catalytic effect of Pd and Ni dopants for the formation of T2O on the Li2TiO3 (001) surface, we studied the structural stability of the doped Li2TiO3 system. First, one of the Ti atoms was replaced by a Pd or Ni atom in one of two different positions ((1) and (2)) in the third layer31 as shown in Fig. 2(a and b). This relaxes the surface to a stable state, forming DA-Li2TiO3 (the dopant atoms are represented by DA). Then the binding energies (Eb)32 of the doped surfaces are calculated from the energy difference between the doped Li2TiO3 surface (EP) and the Li2TiO3 surface containing the dopant vacancy (Ed):
 | (2) |
The binding energies calculated for the Pd- and Ni-doped defective monolayer Li2TiO3 are listed Table 4 (∼–2.80 eV and ∼–4.50 eV respectively). All binding energies are negative in the Pd- and Ni-doped systems; that is, these systems are thermodynamically stable.
| Dopants | Doped sites | Binding energy (eV) |
|---|---|---|
| Pd | Position (1) | −2.70 |
| Position (2) | −2.81 | |
| Ni | Position (1) | −4.51 |
| Position (2) | −4.54 |
3.2 Formation and desorption of T2O on the pure Li2TiO3 surface
For comparison with the doped system, we established a model to study the formation and desorption barriers of a T2O molecule on the pure Li2TiO3 surface. Eight Li atoms were replaced by T in the first layer to form the T-Li2TiO3 surface to simulate the release process of T2O, as shown in Fig. 3 and as described in the literature.33,34 | ||
| Fig. 3 Li2TiO3 and T-Li2TiO3 surfaces. The blue, green, red and dark green spheres represent Ti, Li, O and T atoms, respectively. | ||
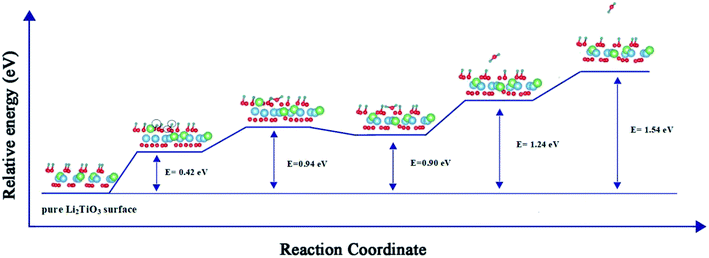
Fig. 4 presents a pathway with the minimum energy barrier of the formation and desorption of T2O. The CI-NEB process involves two steps. The first step is the generation of T2O on the pure Li2TiO3 surface. OT attracts the nearest T atoms and results in the production of T2O on the surface. Next, the T2O undergoes desorption. The formation and desorption energy barriers were calculated to be 0.94 and 0.64 eV, respectively, which are in good accordance with experimental results observed at annealing temperatures near 500 °C.16
3.3 Formation of T2O on the Pd- and Ni-doped surfaces
Having determined the formation and desorption energies of T2O on the pure T-Li2TiO3 surface (001), we now discuss the results for the Pd- and Ni-doped surfaces. As shown in Fig. 2(c), eight Li atoms are substituted by T in the first layer to study the effect of the dopant atoms (DA) on the release efficiency of T2O.33 For the T-Li2TiO3 surface, there was an energy barrier to T2O formation in the undoped system. As shown in Fig. 5(a–d), after relaxation of the Pd-/Ni-T-Li2TiO3 surface, T2O molecules spontaneously form on the surface near the DA atom at both at positions (1) and (2). This is in line with experimental results.16 Comparing with the formation energy of T2O on the T-Li2TiO3 surface, doped atoms can effectively reduce desorption activation energy which are in fair agreement with experimental results that the released capacity of T could be enhanced remarkably on DA-Li2TiO3 system. Therefore, Pd, Ni atoms can be seen as the catalyst for the formation of T2O on the surface of Li2TiO3. The calculated formation barrier of T2 on the surface of pure Li2TiO3 is about 1.8 eV, which is higher than that of T2O (0.94 eV). It is also worth noting that T2O is produced spontaneously on the surface of DA-Li2TiO3, but T2 is not, indicating that there is still a barrier to T2 formation in the doped system. We therefore conclude that T2O is more likely to be produced than T2 on the surface of Li2TiO3, and that metal catalysts (Pd, Ni) have a more pronounced effect on T2O than T2. As a result, we focus on T2O in the next calculation.To further investigate the catalytic mechanism of the dopants on T2O formation, we calculated the effect of dopant atoms on the formation energy of O vacancies, according to previous studies.35,36 The O atoms closest to the dopant atom and the Ti atom substituted on the surface by DA were selected for the study. We define the O vacancy formation energy for Li2TiO3 (001) surface as24
 | (3) |
| Surface | Site | Ovac formation energy (eV) |
|---|---|---|
| Pure-Li2TiO3 | 5.56 | |
| Pd-Li2TiO3 | Position (1) | 2.77 |
| Position (2) | 2.74 | |
| Ni-Li2TiO3 | Position (1) | 3.51 |
| Position (2) | 3.49 |
3.4 The local density of state (LDOS)
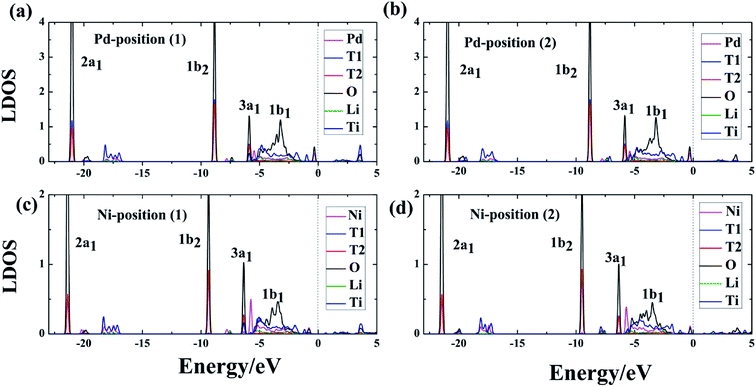
In addition to the structural properties, we also studied the electronic properties. Because atoms far from the dopant atoms do not participate in the reaction and just partial atoms of the system take part in the interaction of T2O formation, the LDOS for the Pd-, Ni-T-Li2TiO3 surface is analyzed. Six atoms (the dopant atom; T1, T2, and O of the T2O molecule; Li and Ti) were chosen, and their interactions were investigated on the doped surface. After the formation of T2O molecules, from the LDOS, the Pd-, and Ni-T-Li2TiO3 surfaces have similar electronic structures, with their electronic valence bands moving down (i.e., towards higher binding energy), as shown in Fig. 6(a–d). Notably, the highest occupied orbital, 1b1, of the T2O molecule participates in the reaction and shows delocalization, whereas the three low-energy level orbitals, 3a1, 1b2 and 2a1, remain unchanged with little involvement in the reaction. In the doped systems, there is energy-level overlap among O and T atoms in T2O at approximately ∼−6, ∼−9 and ∼−21 eV, which illustrates the formation of strong chemical bonds between O and T (T1, T2) atoms. Thus, the O orbital is partially filled with electrons from the orbits of the T1 and T2 atoms. A similar situation has been reported for report of H2O adsorption on the surface of Li4SiO4.37 In addition, there is no obvious hybridization between Li, Ti, and O or T atoms, which implies that the interaction is weak. In our calculations, the electrons injected into the O orbital may be from the T atoms; hence, O acts as an electron acceptor during the formation of T2O on the DA-T-Li2TiO3 surface. Consequently, the interaction between O and T atoms closest to the doped atoms can be effectively enhanced by DA atoms. In the next section, we further confirmed this through Bader charge analysis on the DA-T-Li2TiO3 surface.3.5 Bader charge analysis
Bader charge analysis (Table 6) revealed that charge transfer mainly occurs between the O atom and the two T atoms in the T2O molecule. Specifically, O gains about 0.30 electrons and the two T atoms lose about 0.20 electrons respectively, on the Pd- and Ni-doped surface. This confirms the LDOS results from the previous section. However, there is greater transfer of electrons from Pd atoms than from Ni atoms. We speculate that the direction of and number of electrons transferred might depend on the specific element, which can be explained by differences in their electronegativity.38 In general, an element with a higher electronegativity gains electrons from one with a lower electronegativity. The Pauling electronegativity of Pd is 2.20, which is larger than that of Ni (1.91).39 This is the reason why Pd atoms gain more charge than Ni atoms from the surrounding atoms (Ti (1.54), T (2.20), O (3.34), Li (0.98)) in the Bader charge calculation. Combine with the previous study that the formation energy of the O vacancies in the Pd system is lower than that in the Ni system. Therefore, we speculate that Pd and Ni may affect the formation of O vacancies through charge transfer.| Doping atoms (position) | ΔQ (e−) | |||||
|---|---|---|---|---|---|---|
| T1 | T2 | O | DA | Li | Ti | |
| Pd (1) | −0.180 | −0.240 | 0.360 | 0.133 | −0.010 | 0.019 |
| Pd (2) | −0.160 | −0.210 | 0.310 | 0.137 | 0.006 | 0.018 |
| Ni (1) | −0.120 | −0.190 | 0.330 | 0.017 | 0.005 | 0.009 |
| Ni (2) | −0.210 | −0.190 | 0.320 | 0.017 | 0.002 | 0.008 |
3.6 Charge density difference (CDD)
To further understand and analyze the interaction among T and O atoms on the surface of DA-T-Li2TiO3 (001), the CDD of the system was studied after T2O formation. We defined the CDD as the difference between the charge density of the DA-T-Li2TiO3 system including T2O molecules (C(DA-T-Li2TiO3, T2O)), and the sum of the charge density of free T2O molecule (C(T2O)) and the DA-T-Li2TiO3 surface removing one T2O molecule (C(DA-T-Li2TiO3)):| CDD = C(DA-T-Li2TiO3, T2O) − C(T2O) − C(DA-T-Li2TiO3) | (4) |
A real-space picture of the redistribution of the charge density upon T2O formation is shown in Fig. 7.
After the formation of T2O, there is a charge depletion region near the T atoms and a charge accumulation area near the O atom in the T2O molecule on both doped surfaces. Electron transfer of Li and Ti can be ignored both in position (1) and (2) on the doped surfaces. There is slight charge transfer around the dopant atoms. This result is in agreement with the previous Bader charge analysis, which also means that the doped atoms can affect the bonding between O and T atoms and the formation of O vacancies through charge transfer.
3.7 Desorption of T2O from Pd- and Ni-doped T-Li2TiO3 surfaces
The question addressed next is desorption of T2O after its formation. T2O will accumulate on the surface of T-Li2TiO3 if the T2O cannot be discharged effectively from the device. This causes corrosion of the equipment, which, in turn, leads to metal poisoning and affects the catalysis of the dopant metal. Therefore, T2O needs to be quickly desorbed from the Pd- and Ni-Li2TiO3 surfaces. The challenge is in overcoming the desorption barrier of the T2O (the calculated desorption energies are shown in Fig. 8). In this section, the pathways that minimize the desorption barrier are chosen based on the CI-NEB method. The final state was found by minimizing the energy of the T2O molecule outside the slab.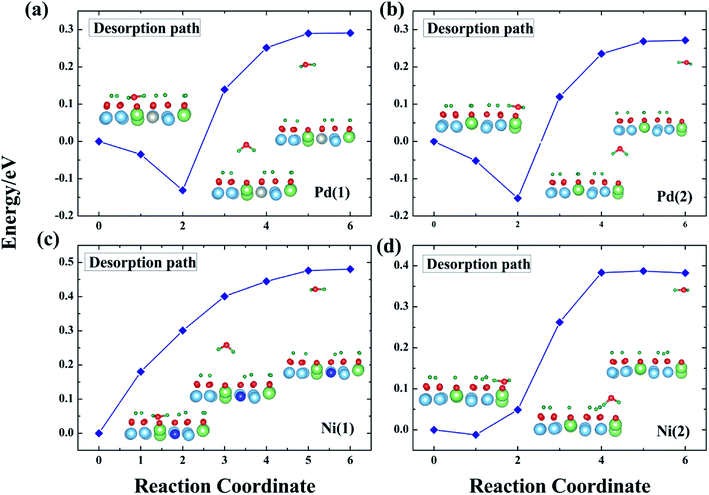 | ||
| Fig. 8 T2O desorption path for the Pd-T-Li2TiO3 surface (a and b) and the Ni-T-Li2TiO3 surface (c and d). | ||
In our analysis, T2O is desorbed at a height of 3 Å on the surface. The corresponding potential barriers for concerted pathways are shown in Fig. 8, the desorption energies of T2O molecules are ∼0.30 and ∼0.27 eV on the two positions of the Pd-T-Li2TiO3 surface, and ∼0.48 and ∼0.38 eV on the two positions of the Ni-T-Li2TiO3 surface. In contrast with the value of 1.956 eV for the Li4SiO4 surface,36 the desorption energies of T2O molecules in the doped systems are acceptable. The energy required for desorption varies greatly, which may be due to the different dopant atom. The similar calculations curve appears in the reports of the O2 desorption from the carbon nanotube surface.40
In summary, based on our results and those of previous calculations, we conclude that the desorption energy is influenced by O vacancies. Moreover, because the desorption energies for the DA-T-Li2TiO3 surface are lower than those of the T-Li2TiO3 surface, it is evident that dopant atoms can reduce the energy for T2O desorption. Finally, T2O molecules can be effectively released under a lower energy barrier, and doping of the catalyst metal on the surface of Li2TiO3 can improve T release.
4. Conclusions
Our theoretical studies provide a clear account of the catalytic effect of Pd and Ni dopants on the release of T2O molecule from the Li2TiO3 surface. The CI-NEB method revealed the formation and desorption energies of T2O (0.94 and 0.64 eV, respectively) on the pure Li2TiO3 surface. Because the dopants reduce the formation energy of O vacancies on the DA-Li2TiO3 surface, T2O generated spontaneously. Thus, metal catalysts can promote the desorption of T from the surface of Li2TiO3, which is consistent with previously reported experimental results.To clarify the mechanism of the formation of T2O molecules on the doped surface, we calculated the local density of state, Bader charge and charge density difference of the doped Li2TiO3 surface. We found that the OT group closest to the dopant atoms is affected by the dopants, which enhances the interaction with the adjacent T atoms during T2O formation. O vacancies are more likely to be generated on the surface because of the dopant atoms, and O atoms in OT acquire electrons from T atoms. As a result, orbital hybridization occurs between O and T, and chemical bonds are formed. This leads to the spontaneous generation of T2O molecules around the dopant atoms. The calculated desorption energy of T2O molecules on the Li2TiO3 surface with metal catalysts was ∼0.30 and ∼0.48 eV in the Pd- and Ni-doped systems, respectively. Thus, the dopant atoms can reduce the energy for T2O desorption. Taken together, our works demonstrates the potential of Pd and Ni as catalysts for the generation of T2O and the release of T on the Li2TiO3 surface. We also hope that we can provide a better research direction for the release experiment.
Conflicts of interest
There are no conflicts to declare.Acknowledgements
This work is supported by the ITER plan of the Ministry of Science and Technology of China (Grant No. 2014GB111001 and Grant No. 2014GB125002).References
- C. Johnson, J. Nucl. Mater., 1999, 270, 212–220 CrossRef CAS.
- C. E. Johnson, J. Nucl. Mater., 1991, 179, 42–46 CrossRef.
- C. E. Johnson, Ceram. Int., 1991, 17, 253–258 CrossRef CAS.
- X. Kong, Y. Yu, S. Ma, T. Gao, C. Xiao and X. Chen, RSC Adv., 2017, 7, 35239–35250 RSC.
- A. K. Fischer, J. Nucl. Mater., 1992, 191, 236–239 CrossRef.
- X. Xiang, W. Zhu, T. Lu, T. Gao, Y. Shi, M. Yang, Y. Gong, X. Yu, L. Feng and Y. Wei, AIP Adv., 2015, 5, 107136 CrossRef.
- D. Cruz, S. Bulbulian, E. Lima and H. Pfeiffer, J. Solid State Chem., 2006, 179, 909–916 CrossRef CAS.
- Y. Kawamura and M. Nishikawa, J. Nucl. Mater., 1995, 218, 57–65 CrossRef CAS.
- K. Noda,Proceedings of the sixth international workshop on ceramic breeder blanket interactions, Japan Atomic Energy Research Inst., 1998 Search PubMed.
- Y. Kawamura, K. Ochiai, T. Hoshino, K. Kondo, Y. Iwai, K. Kobayashi, M. Nakamichi, C. Konno, T. Yamanishi and T. Hayashi, Fusion Eng. Des., 2012, 87, 1253–1257 CrossRef CAS.
- T. Kinjyo, M. Nishikawa, M. Enoeda and S. Fukada, Fusion Eng. Des., 2008, 83, 580–587 CrossRef CAS.
- C. Johnson, K. Noda and N. Roux, J. Nucl. Mater., 1998, 258, 140–148 CrossRef.
- M. Kobayashi, Y. Oya and K. Okuno, J. Nucl. Mater., 2013, 439, 159–167 CrossRef CAS.
- T. Kinjyo, M. Nishikawa and M. Enoeda, J. Nucl. Mater., 2007, 367, 1361–1365 CrossRef.
- T. Tang and D. Luo, Journal of Atomic and Molecular Sciences, 2010, 1, 185 CrossRef.
- Y. Narisato, K. Munakata, A. Koga, Y. Yokoyama, T. Takata and H. Okabe, J. Nucl. Mater., 2004, 329, 1370–1373 CrossRef.
- K. Munakata, A. Baba, T. Kawagoe, T. Takeishi, Y. Yokoyama, M. Nishikawa, R. D. Penzhorn, H. Moriyma, K. Kawamoto and K. Okuno, Fusion Eng. Des., 2000, 49, 621–628 CrossRef.
- K. Munakata, Y. Yokoyama, A. Koga, N. Nakashima, S. Beloglazov, T. Takeishi, M. Nishikawa, R.-D. Penzhorn, K. Kawamoto and H. Moriyama, J. Nucl. Mater., 2002, 307, 1451–1455 CrossRef.
- J. Kopasz, C. Seils and C. Johnson, J. Nucl. Mater., 1992, 191, 231–235 CrossRef.
- P. E. Blöchl, Phys. Rev. B: Condens. Matter Mater. Phys., 1994, 50, 17953 CrossRef.
- G. Kresse and D. Joubert, Phys. Rev. B: Condens. Matter Mater. Phys., 1999, 59, 1758 CrossRef CAS.
- G. Kresse and J. Furthmüller, Phys. Rev. B: Condens. Matter Mater. Phys., 1996, 54, 11169 CrossRef CAS.
- I. Mazin, D. J. Singh, M. Johannes and M.-H. Du, Phys. Rev. Lett., 2008, 101, 057003 CrossRef CAS PubMed.
- Y. Shi, et al., J. Nucl. Mater., 2015, 467, 519–526 CrossRef CAS.
- H. J. Monkhorst and J. D. Pack, Phys. Rev. B: Condens. Matter Mater. Phys., 1976, 13, 5188 CrossRef.
- G. Henkelman, B. P. Uberuaga and H. Jónsson, J. Chem. Phys., 2000, 113, 9901–9904 CrossRef CAS.
- Z. Wan, Y. Yu, H. Zhang, T. Gao, X. Chen and C. Xiao, Eur. Phys. J. B, 2012, 85, 181 CrossRef.
- J. , F. Dorrian and R. , E. Newnham, Mater. Res. Bull., 1969, 4(3), 179–183 CrossRef CAS.
- K. Kataoka, Y. Takahashi and N. Kijima, et al., Mater. Res. Bull., 2009, 44(1), 168–172 CrossRef CAS.
- X. Xiao, F. Hayashi, K. Yubuta, A. Selloni and K. Teshima, Cryst. Growth Des., 2017, 17, 1118–1124 CrossRef CAS.
- N. Kuganathan, et al., Solid State Ionics, 2018, 327, 93–98 CrossRef CAS.
- Y. Zhang, et al., J. Nucl. Mater., 2017, 484, 103–109 CrossRef CAS.
- T. Oda, H. Tanigawa and S. Tanaka, Fusion Sci. Technol., 2003, 44, 485–489 CrossRef CAS.
- G. Ran, C. Xiao, X. Chen, Y. Gong, C. Kang and X. Wang, J. Nucl. Mater., 2015, 466, 316–321 CrossRef CAS.
- Z. X. Yang, D. W. Ma and X. H. Yu, et al., Eur. Phys. J. B, 2010, 77(3), 373–380 CrossRef CAS.
- Z. Lu, Z. Yang and K. Hermansson, et al., J. Mater. Chem. A, 2014, 2(7), 2333–2345 RSC.
- X. Kong, Y. Yu, S. Ma, T. Gao, C. Xiao and X. Chen, Chem. Phys. Lett., 2018, 691, 1–7 CrossRef CAS.
- D. Ma, W. Ju, T. Li, X. Zhang, C. He, B. Ma, Y. Tang, Z. Lu and Z. Yang, Appl. Surf. Sci., 2016, 364, 181–189 CrossRef CAS.
- A. Allred, J. Inorg. Nucl. Chem., 1961, 17, 215–221 CrossRef CAS.
- X. Y. Zhu, S. M. Lee, Y. H. Lee and T. Frauenheim, Phys. Rev. Lett., 2000, 85, 2757 CrossRef CAS PubMed.
| This journal is © The Royal Society of Chemistry 2019 |


