 Open Access Article
Different diameters of titanium dioxide nanotubes modulate Saos-2 osteoblast-like cell adhesion and osteogenic differentiation and nanomechanical properties of the surface†
Barbora Voltrova ab,
Vojtech Hybasek
 c,
Veronika Blahnova
 ad,
Josef Sepitka
 e,
Vera Lukasova
 ab,
Karolina Vocetkova
 ad,
Vera Sovkova
 ad,
Roman Matejka
 f,
Jaroslav Fojt
 c,
Ludek Joska
 c,
Matej Daniel
 e and
Eva Filova
 *ad
*ad
aDepartment of Tissue Engineering, Institute of Experimental Medicine of the Czech Academy of Sciences, Vídeňská 1083, 142 20 Prague 4, Czech Republic. E-mail: eva.filova@iem.cas.cz; Tel: +420 296 442 387
bCharles University in Prague, Faculty of Science, Albertov 2038/6, 128 00 Prague, Czech Republic
cDepartment of Metals and Corrosion Engineering, University of Chemistry and Technology, Technická 5, 166 29 Prague, Czech Republic
dCharles University in Prague, Second Faculty of Medicine, V Úvalu 84, 150 06 Prague, Czech Republic
eDepartment of Mechanics, Biomechanics and Mechatronics, Faculty of Mechanical Engineering, Czech Technical University in Prague, Technická 4, 166 29 Prague, Czech Republic
fFaculty of Biomedical Engineering, Czech Technical University in Prague, Sportovců 2311, 272 01 Kladno, Czech Republic
First published on 11th April 2019
Abstract
The formation of nanostructures on titanium implant surfaces is a promising strategy to modulate cell adhesion and differentiation, which are crucial for future application in bone regeneration. The aim of this study was to investigate how the nanotube diameter and/or nanomechanical properties alter human osteoblast like cell (Saos-2) adhesion, growth and osteogenic differentiation in vitro. Nanotubes, with diameters ranging from 24 to 66 nm, were fabricated on a commercially pure titanium (cpTi) surface using anodic oxidation with selected end potentials of 10 V, 15 V and 20 V. The cell response was studied in vitro on untreated and nanostructured samples using a measurement of metabolic activity, cell proliferation, alkaline phosphatase activity and qRT-PCR, which was used for the evaluation of osteogenic marker expression (collagen type I, osteocalcin, RunX2). Early cell adhesion was investigated using SEM and ELISA. Adhesive molecules (vinculin, talin), collagen and osteocalcin were also visualized using confocal microscopy. Moreover, the reduced elastic modulus and indentation hardness of nanotubes were assessed using a TriboIndenter™. Smooth and nanostructured cpTi both supported cell adhesion, proliferation and bone-specific mRNA expression. The nanotubes enhanced collagen type I and osteocalcin synthesis, compared to untreated cpTi, and the highest synthesis was observed on samples modified with 20 V nanotubes. Significant differences were found in the cell adhesion, where the vinculin and talin showed a dot-like distribution. Both the lowest reduced elastic modulus and indentation hardness were assessed from 20 V samples. The nanotubes of mainly 20 V samples showed a high potential for their use in bone implantation.
Introduction
In recent years, improvement of the biocompatibility and osseointegration of metal implants has become a challenging task for biomaterial engineers. The most common material used for implants in orthopaedic surgery, dental reconstruction and prostheses is titanium.1,2 Titanium and its alloys have been used because of their low toxicity, biocompatibility and appropriate mechanical properties. Commercially pure titanium (cpTi) is considered to be of very high standard for big joint implants. However, the inadequate osseointegration of smooth cpTi materials and the formation of a fibrous connective tissue layer on the bone-implant interface remain complicated in orthopaedic applications. To overcome these issues, a surface of titanium and its alloys has been widely modified to support cell adhesion and to encourage the formation of new bone on the interface between the implant surface and bone tissue.3 As was previously described, titanium dioxide (TiO2) nanotube surfaces can accelerate recovery, improve bone-implant connection and enhance calcium and phosphorus deposition.4–6 Different methods were applied on the implant surfaces in order to prepare micro- or nanostructures, e.g. anodic oxidation,7 hydroxyapatite deposition,8,9 etching,10 laser texturing,11,12 ultrasonic nanocrystal surface modification,13 and induction heating treatment.14 Carbon nanotubes (CNTs) provide another approach to nanostructured modification of the surfaces, providing a hollow geometry with a diameter of units or tens of nm, large specific area, high strength and toughness, thermal and electrical conductivity, and good bioactivity.15,16Anodic oxidation is a widely used technique, because it is simple and highly effective. The anodization process in a fluorine-containing electrolyte, leads to the formation of vertically oriented TiO2 nanotubes with defined physical and chemical properties. These porous columnar structures, created from anodic oxides on metal titanium, were first reported by Zwilling et al. in 1999.17 Since then, anodic oxidation has become an effective and reproducible method to form nanotubes with defined length, inner and outer diameter on titanium-based biomaterials. It is also beneficial for tissue engineering application that the morphology and the diameter of nanotubes can easily be adjusted by a change of anodization parameters such as applied voltage, time of the modification or electrolyte composition and temperature.18
There have been several studies concerning the effect of TiO2 nanotubes on different titanium alloys to cell adhesion, differentiation and growth. Nanotubes with a diameter in the range of 15–100 nm have particularly been used for in vitro and in vivo studies of cell response and osseointegration.3,19
Research has also shown, that TiO2 nanotubes provide a promising approach to preventing bacterial infection, as they enable the application of localized drug delivery systems.20 Earlier studies reported improved antibacterial properties after the incorporation of antibiotics,21 ZnO22 or Ag23 into TiO2 nanotubes. The results from the above-mentioned studies clearly sustain nanotube modification as a suitable technique how to improve osseointegration and antibacterial properties of orthopaedic and dental implants. Despite extensive studies of cell behaviour on nanotubes with different diameters, there is still some discrepancies over nanotube size for optimal bone cell adhesion, growth and differentiation.
Among all the other properties of TiO2 nanostructures, elastic modulus (E) is a property that affects directly the implant stability. It is desirable that the metal elastic modulus be as close as possible from that of the bone, because lower differences between the E values result in better transfer of stress, avoiding stress-shielding effect.24
Elastic modulus and hardness of TiO2 nanotubes layer is not well established until now and it plays an important role in the long term stability of the implant, although few researches have investigate it in the past. Nanoindentation is the most suitable technique to determine the elastic modulus of such thin TiO2 oxide layer. Crawford has examined the deformation behavior of a nanotube layer using nanoindentation tests with a Berkovich probe, what led to an indentation penetration higher than the thickness of the nanotube layer and wear marks on indentation.25
This study focuses on the effect of TiO2 nanotubes of different diameters, created on cpTi surface, on osteoblast-like cells (Saos-2) growth, adhesion and osteoblastic differentiation in vitro.
Materials and methods
Preparation of titanium specimens
Commercially pure titanium (cpTi), grade 2, samples of 15 mm diameter and 3 mm height were used for nanostructuring. The specimens were wet-ground and polished up to mirror look. The nanostructuring was then realized with the potentiostat-galvanostat IMP 88 PC-200V with PGU-AUTO Extern control unit (Jaissle, IPS Elektroniklabor GmbH & Co. KG, Germany). All anodization experiments were carried out at room temperature in an electrolyte containing glycerol![[thin space (1/6-em)]](https://www.rsc.org/images/entities/char_2009.gif) :
:![[thin space (1/6-em)]](https://www.rsc.org/images/entities/char_2009.gif) H2O
H2O![[thin space (1/6-em)]](https://www.rsc.org/images/entities/char_2009.gif) :
:![[thin space (1/6-em)]](https://www.rsc.org/images/entities/char_2009.gif) NH4F in weight ratio 65
NH4F in weight ratio 65![[thin space (1/6-em)]](https://www.rsc.org/images/entities/char_2009.gif) :
:![[thin space (1/6-em)]](https://www.rsc.org/images/entities/char_2009.gif) 33
33![[thin space (1/6-em)]](https://www.rsc.org/images/entities/char_2009.gif) :
:![[thin space (1/6-em)]](https://www.rsc.org/images/entities/char_2009.gif) 2 using a standard three electrode setup with glassy carbon rod as a counter electrode, the sample as the working electrode and a silver/silver chloride (3 mol L−1 KCl) reference electrode (SSCE). All presented potentials are related to this electrode. The electrochemical measurement consisted of a potential ramp from an open circuit potential to the selected end potential (10 V, 15 V, 20 V) with a 100 mV s−1 sweep rate and potentiostatic exposure for 1700 s, 1650 s and 1600 s for 10 V, 15 V and 20 V respectively. A potentiodynamic decrease with a potential of 0 V and polarization rate −100 mV s−1 then followed. A decrease of the potential at the end of the anodization, led to the creation of a compact oxide interlayer between the tubes and the metal. This layer was approximately 100 nm thick and increased the adhesion of the nanostructure to the base material. After the electrochemical measurement, the samples were ultrasonicated in ethanol and deionized water and then dried in air stream. Untreated cpTi was used as the control (Ti).
2 using a standard three electrode setup with glassy carbon rod as a counter electrode, the sample as the working electrode and a silver/silver chloride (3 mol L−1 KCl) reference electrode (SSCE). All presented potentials are related to this electrode. The electrochemical measurement consisted of a potential ramp from an open circuit potential to the selected end potential (10 V, 15 V, 20 V) with a 100 mV s−1 sweep rate and potentiostatic exposure for 1700 s, 1650 s and 1600 s for 10 V, 15 V and 20 V respectively. A potentiodynamic decrease with a potential of 0 V and polarization rate −100 mV s−1 then followed. A decrease of the potential at the end of the anodization, led to the creation of a compact oxide interlayer between the tubes and the metal. This layer was approximately 100 nm thick and increased the adhesion of the nanostructure to the base material. After the electrochemical measurement, the samples were ultrasonicated in ethanol and deionized water and then dried in air stream. Untreated cpTi was used as the control (Ti).
Surface characterization of the specimens
For the morphological characterization of samples, a Vega3 scanning electron microscope (SEM) (Tescan, Czech Republic) was used. The length and inner diameter of the nanotubes was evaluated from SEM images in ImageJ software. The data from four distant image fields, from at least four samples were used for analysis.Sterilization of the samples
Titanium disks were sterilized in 70% ethanol, for 30 min in room temperature, after washed three times with PBS and transferred to nonadherent 24-well plate (non-treated surface, Corning® Costar®, USA). The same procedure was used for glass coverslip.Cell seeding
Saos-2 cells (passage 88, CLS Cell Lines Service GmbH, Germany) were seeded on cpTi scaffolds at the density 1.5 × 10⁴ cells per cm−2. Similarly, cells were seeded on glass coverslip and cultured in McCoy's 5A medium (Sigma-Aldrich, USA) supplemented with 15% foetal bovine serum (Gibco; Thermo Fisher Scientific, Waltham, MA, USA), ascorbate-2 phosphate (40 μg mL−1, Sigma-Aldrich), penicillin/streptomycin (100 IU mL−1, 100 μg mL−1, Sigma-Aldrich). For ELISA 4 × 10⁴ cells per well were seeded on each sample and cultured in a nonadherent 24-well plate (Costar). The medium was changed twice weekly; all samples were prepared in triplicate, for enzyme-linked immunosorbent assay (ELISA) in pentaplicate.Quantification of vinculin and talin
The concentration of focal adhesion proteins (vinculin and talin) was determined using the enzyme-linked immunosorbent assay (ELISA). For ELISA measurement Saos-2 were seeded as described in the section cell seeding. To standardize the obtained concentration of the focal adhesion proteins, the amount of total protein in the cells was determined using Quant-iT protein assay kit (Thermo Fisher Scientific) according to the manufacturer's instructions, and the concentration of the focal adhesion proteins was related to the mg of total protein contained in the cells. The cells were harvested after 24 h of culture, suspension was centrifuged and frozen in PBS. The cell homogenates were prepared by ultrasonication for 30 s (amplitude 70%, 24 kHz) using the ultrasonic homogenizer (model 300 V/T, BioLogics, Inc., USA) on ice. The concentration of vinculin and talin in the cell homogenates was determined using the FineTest ELISA kits (FineTest, China) as per manufacturer's instructions. The absorbance was read using a Synergy HT microplate reader (BioTek, USA).Cell adhesion evaluation using confocal microscopy
Saos-2 cells were seeded as described in cell seeding. Two days after seeding, the cells were fixed with 4% paraformaldehyde for 5 min, washed once with PBS and stored in PBS at 2–8 °C before staining. The samples were then washed three times with PBS and incubated in 3% FBS/0.1% Triton X in PBS for 30 min at room temperature. The samples were then incubated with 1% Tween 20 in PBS for 20 min at room temperature. A monoclonal antibody against talin was applied (dilution 1![[thin space (1/6-em)]](https://www.rsc.org/images/entities/char_2009.gif) :
:![[thin space (1/6-em)]](https://www.rsc.org/images/entities/char_2009.gif) 200, clone 8d4, ascites fluid, T3287, Sigma-Aldrich) or vinculin (dilution 1
200, clone 8d4, ascites fluid, T3287, Sigma-Aldrich) or vinculin (dilution 1![[thin space (1/6-em)]](https://www.rsc.org/images/entities/char_2009.gif) :
:![[thin space (1/6-em)]](https://www.rsc.org/images/entities/char_2009.gif) 100, monoclonal hVIN-1, product V9131, Sigma-Aldrich) overnight at 2–8 °C. After being washed three times with PBS/0.05% Tween (3, 5, 10 min) and once in PBS, anti-mouse secondary antibody, conjugated with Goat anti-Mouse IgG/IgA/IgM (H + L) AlexaFluor 488 (dilution 1
100, monoclonal hVIN-1, product V9131, Sigma-Aldrich) overnight at 2–8 °C. After being washed three times with PBS/0.05% Tween (3, 5, 10 min) and once in PBS, anti-mouse secondary antibody, conjugated with Goat anti-Mouse IgG/IgA/IgM (H + L) AlexaFluor 488 (dilution 1![[thin space (1/6-em)]](https://www.rsc.org/images/entities/char_2009.gif) :
:![[thin space (1/6-em)]](https://www.rsc.org/images/entities/char_2009.gif) 300, A10667, Invitrogen Life Technologies, USA), was added for 45 min at room temperature. Subsequently, after the same washing procedure, the samples were incubated with Phalloidin conjugated with ATTO-633 (dilution 20 μL/1 mL PBS, Sigma-Aldrich) for 1 hour at room temperature. Cell nuclei were counterstained with Hoechst 34580 (1
300, A10667, Invitrogen Life Technologies, USA), was added for 45 min at room temperature. Subsequently, after the same washing procedure, the samples were incubated with Phalloidin conjugated with ATTO-633 (dilution 20 μL/1 mL PBS, Sigma-Aldrich) for 1 hour at room temperature. Cell nuclei were counterstained with Hoechst 34580 (1![[thin space (1/6-em)]](https://www.rsc.org/images/entities/char_2009.gif) :
:![[thin space (1/6-em)]](https://www.rsc.org/images/entities/char_2009.gif) 5000, H21486, Life Technologies) for 30 min at RT and washed twice in PBS. The samples were scanned using confocal microscope ZEISS LSM 5 DUO at λex = 405 nm, λem = 420–460 nm for Hoechst, λexc = 488 nm and λem = 505–550 nm for Alexa Fluor 488, λex = 633 nm, λem > 650 nm for ATTO-633 staining.
5000, H21486, Life Technologies) for 30 min at RT and washed twice in PBS. The samples were scanned using confocal microscope ZEISS LSM 5 DUO at λex = 405 nm, λem = 420–460 nm for Hoechst, λexc = 488 nm and λem = 505–550 nm for Alexa Fluor 488, λex = 633 nm, λem > 650 nm for ATTO-633 staining.
Cell visualization using scanning electron microscopy
SEM was used to visualize the cells adhered on the scaffolds 2 days after seeding. For the visualization, two samples per group were used. The samples were washed with PBS and fixed with 2.5% glutaraldehyde (Sigma-Aldrich) for 2 h at 4 °C. Fixed samples were then dehydrated with ethanol series (35%, 48%, 70%, 96% and twice at 100%). Hexamethyldisilazane (Sigma-Aldrich) was used to remove residual water from the samples. The samples were sputter-coated with gold (3 nm) and visualized using Vega 3 SBU microscope (Tescan).Cell proliferation
Cell proliferation was measured using Quant-iT™ dsDNA Assay Kit (Life Technologies). The samples were washed twice with PBS and put into 500 μL lysate buffer (0.2% v/v Triton X-100, 10 mM Tris (pH 7.0) and 1 mM EDTA). The samples were frozen/thawed in three cycles (−80 °C/room temperature). The amount of dsDNA was evaluated according to the manufacturer's instructions using a multidetection reader Tecan Infinite® M200 Pro, λex = 485 nm, λem = 523 nm.Metabolic activity
Metabolic activity of Saos-2 was evaluated using an MTS test (CellTiter 96® AQueous One Solution Cell Proliferation Assay, Promega, USA) on days 1, 4, 7, and 11. Scaffolds were transferred to new wells, incubated with 300 μL media and 60 μL MTS solution for 2 h at 37 °C, 5% CO2. Subsequently, 100 μL of the metabolized solution from each well was put into a 96-well plate and the absorbance was measured at 490 nm (λref = 690 nm) using reader Tecan Infinite® M200 Pro (Tecan Trading AG, Switzerland).Real time PCR
RNA was isolated from three samples per group on days 1, 7, and 11 using the RNeasy Mini Kit (Qiagen, Germany) following the manufacturer's instructions. The RNA content and ratio of absorbance at 260 nm to 280 nm, was measured using Tecan Infinite® M200 Pro reader. The result of this procedure indicates the purity and amount of RNA in nanograms per sample. The presence of DNA in the samples was checked using standard agarose gel electrophoresis. For the cDNA synthesis RevertAid H Minus First Strand cDNA Synthesis Kit (Thermo Scientific, USA) was used. The isolated mRNA was transcribed to cDNA by reverse transcription; during the procedure samples were stored on ice. Thereafter, genes were analysed for osteogenic marker RunX2, collagen type I, osteocalcin and EEF1 gene (eukaryotic elongation factor) which was used as a housekeeping gene. Fluorescence values for osteogenic genes were normalized by EEF1 values. The cDNA was used to perform RT-PCR with the reaction parameters as follows: activation −95 °C, 10 min; amplification −95 °C for 10 s, 60 °C for 10 s (50 cycles); termination −40 °C for 1 min. The TaqMan probes with a fluorescent label at the 5′ end and the quencher on the 3′ end (reviewed in Table 1) was used to detect the amount of copied sequences of interest. The TaqMan Gene Expression Master Mix (Thermo Scientific) and RT-PCR Grade Water (Thermo Scientific) was added to each sample. mRNA levels for each gene were relatively quantified using housekeeping gene EEF1. Graphs were generated from the values obtained by calculation according to the formula 2−ΔCp. In between the isolation of RNA, cDNA synthesis and RT-PCR, samples were stored in a freezer at −80 °C. To measure the fluorescence intensity, Light Cycler 480 (Roche, Switzerland) was used.| Gene name | Code | Catalogue No. |
|---|---|---|
| a EEF1 – eukaryotic elongation factor-1; RunX2 – Runt-related transcription factor 2; OCN – osteocalcin; COlI – collagen type I. | ||
| EEF1 | Hs00265885_g1 | 4331182 |
| RunX2 | Hs00231692_m1 | 4331182 |
| OCN | Hs01587814_g1 | 4331182 |
| ColI | Hs01028969_m1 | 4331182 |
Alkaline phosphatase (ALP) activity measurement
ALP activity was measured using a 1-Step™ PNPP kit (Thermo Fisher Scientific) from three samples per group. Culture medium was removed from the wells and washed twice with a phosphate buffered saline (PBS). Each scaffold was incubated with 350 μL p-nitrophenyl phosphate (pNPP) for 5 min at room temperature. Subsequently, the reaction was stopped with 175 μL 2 M NaOH. The absorbance of 100 μL of the ALP solution was measured in a 96-well plate after 1![[thin space (1/6-em)]](https://www.rsc.org/images/entities/char_2009.gif) :
:![[thin space (1/6-em)]](https://www.rsc.org/images/entities/char_2009.gif) 1 dilution with PBS at 405 nm using reader Tecan Infinite® M200 Pro.
1 dilution with PBS at 405 nm using reader Tecan Infinite® M200 Pro.
Immunohistochemical staining of collagen type I and osteocalcin
Three samples per group including glass as a control were fixed with frozen methanol, washed with PBS and incubated in 3% FBS in PBS/0.1% Triton for 30 min at room temperature. A primary monoclonal antibody against osteocalcin (T-4743, Peninsula Laboratories, USA, dilution 1![[thin space (1/6-em)]](https://www.rsc.org/images/entities/char_2009.gif) :
:![[thin space (1/6-em)]](https://www.rsc.org/images/entities/char_2009.gif) 20) or collagen type I (M-38c, DSHB, USA, dilution 1
20) or collagen type I (M-38c, DSHB, USA, dilution 1![[thin space (1/6-em)]](https://www.rsc.org/images/entities/char_2009.gif) :
:![[thin space (1/6-em)]](https://www.rsc.org/images/entities/char_2009.gif) 20) was added, and the samples were incubated overnight at 4 °C. After three washes with PBS/0.05% Tween, and once with PBS the samples were incubated with secondary antibody, Alexa Fluor 488-conjugated anti- rabbit or anti-mouse antibody, for 45 min, dilution 1
20) was added, and the samples were incubated overnight at 4 °C. After three washes with PBS/0.05% Tween, and once with PBS the samples were incubated with secondary antibody, Alexa Fluor 488-conjugated anti- rabbit or anti-mouse antibody, for 45 min, dilution 1![[thin space (1/6-em)]](https://www.rsc.org/images/entities/char_2009.gif) :
:![[thin space (1/6-em)]](https://www.rsc.org/images/entities/char_2009.gif) 300 (Life Technologies). The cell nuclei were stained with 5 μg mL−1 propidium iodide (PI) in PBS for 10 min (Sigma-Aldrich). The cells were visualized using a confocal microscope ZEISS LSM 5 DUO at λexc = 488 nm and λem = 505–550 nm for Alexa Fluor 488 and λex = 560 nm, λem >575 nm for PI. All the samples were scanned in one experimental day per each protein, using the same setup during that day. The total fluorescence intensity of osteocalcin, or collagen type I per cell was analysed using Fluorescent Image Analysis Software (version 1.0).26
300 (Life Technologies). The cell nuclei were stained with 5 μg mL−1 propidium iodide (PI) in PBS for 10 min (Sigma-Aldrich). The cells were visualized using a confocal microscope ZEISS LSM 5 DUO at λexc = 488 nm and λem = 505–550 nm for Alexa Fluor 488 and λex = 560 nm, λem >575 nm for PI. All the samples were scanned in one experimental day per each protein, using the same setup during that day. The total fluorescence intensity of osteocalcin, or collagen type I per cell was analysed using Fluorescent Image Analysis Software (version 1.0).26
Statistical analysis
The obtained data were statistically analysed using SigmaStat 3.5 software. Quantitative data are presented as mean values ± standard deviation (SD). Prior to measurement, normality was evaluated. Results were evaluated statistically using one-way analysis of variance (ANOVA), Student–Newman–Keuls method was used for post hoc analysis with a significance value of less than 0.05. Values were determined from at least 3 samples.Nanomechanical properties
A Hysitron TI 950 TriboIndenter™ nanomechanical test instrument was used for an assessment of depth profiles of mechanical properties on titanium dioxide nanostructures (10 V, 15 V and 20 V). Depth profiles were investigated using the partial unloading function (Pmax = 10![[thin space (1/6-em)]](https://www.rsc.org/images/entities/char_2009.gif) 000 μN, 33 cycles consisted of loading, dwell, and unloading segments, each lasting 1 second) with Berkovich diamond tip.27,28 Partial unload approach requires elastic–plastic deformation during gradual force cycles in order to analyse each unloading segment according Oliver & Pharr method.29 Automated analysis plots the depth profile as discrete datasets.
000 μN, 33 cycles consisted of loading, dwell, and unloading segments, each lasting 1 second) with Berkovich diamond tip.27,28 Partial unload approach requires elastic–plastic deformation during gradual force cycles in order to analyse each unloading segment according Oliver & Pharr method.29 Automated analysis plots the depth profile as discrete datasets.
Results
Anodic oxidation was successfully used for the preparation of nanostructures on cpTi. Nanotubes with a diameter in the range 24–66 nm, with length approximately 468 nm (10 V) up to 1097 nm (20 V) were created, using a different applied potential. Histograms of nanotube diameter and scanning electron microscopy (SEM) photomicrographs for each modified sample are summarized in Fig. 1. Inner diameter and length of the nanotubes were successfully evaluated. The tubes length was measured from the tubes side view micrographs. Basic characterization of the samples is specified in Table 2.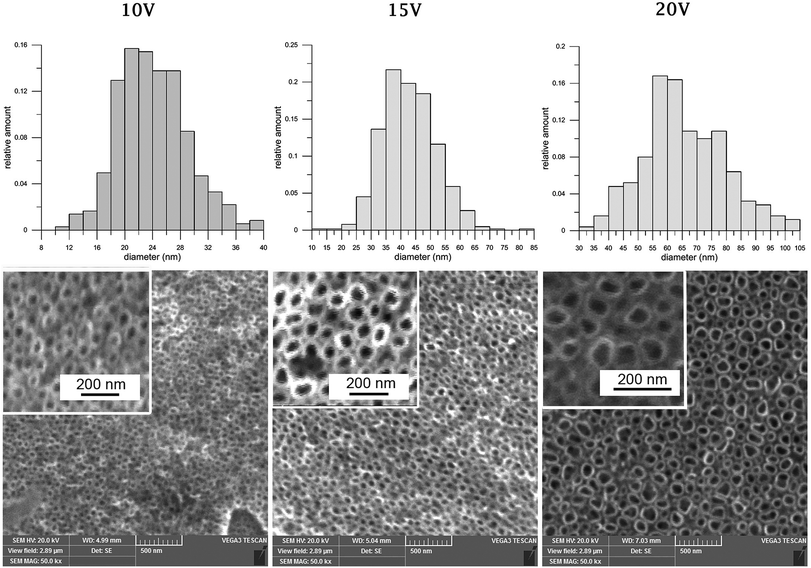 | ||
| Fig. 1 Histograms of nanotube inner diameters and scanning electron microscopy visualization of nanostructures, created by anodic oxidation at 10 V, 15 V, 20 V on cpTi. Magnification 50k×. | ||
| Applied potential [V] | Diameter of nanotubes (nm ± SD) | Length of nanotubes (nm ± SD) |
|---|---|---|
| a SD − standard deviation, cpTi – commercially pure titanium. | ||
| 10 | 24 ± 5 | 468 ± 24 |
| 15 | 43 ± 9 | 731 ± 32 |
| 20 | 66 ± 14 | 1097 ± 75 |
We have tested untreated cpTi (Ti), and nanostructured cpTi scaffold prepared using potential 10 V, 15 V and 20 V in vitro. Glass coverslip was used as a control group. Saos-2 cell proliferation, metabolic activity and differentiation, e.g. production of collagen type I and osteocalcin, ALP activity was investigated. As well as mRNA expression of osteocalcin, collagen type I and RunX2 were examined in Saos-2 on all surfaces.
ELISA was performed for quantification of the vinculin and talin synthetized in Saos-2 one day after cell seeding. The concentration of vinculin increased on nanostructured samples, when the highest concentration was measured on 20 V (Fig. 2A). On the contrary, concentration of talin was significantly higher on Ti, 10 V, 15 V and glass, compared to 20 V with the biggest nanotube diameter (Fig. 2B). The highest amount of talin was on a flat surface of glass.
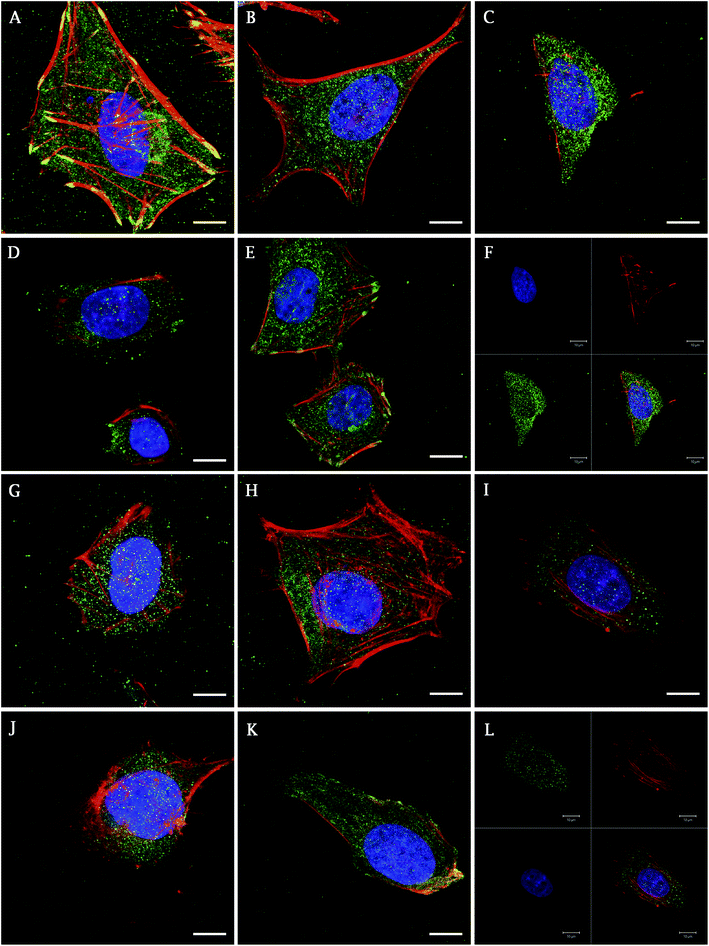
In addition, the presence of focal adhesion molecules (vinculin, talin), synthetized by Saos-2 on a differently treated cpTi surface, were visualized using confocal microscopy 48 h after seeding. Fig. 3 describes the homogenous dot-like positive signals of adhesive molecules on nanotube and smooth surfaces. On glass and Ti the signal was differently organized, with the greatest signal on ends of the cells with line like morphology corresponding to focal complexes formed at the cells periphery.
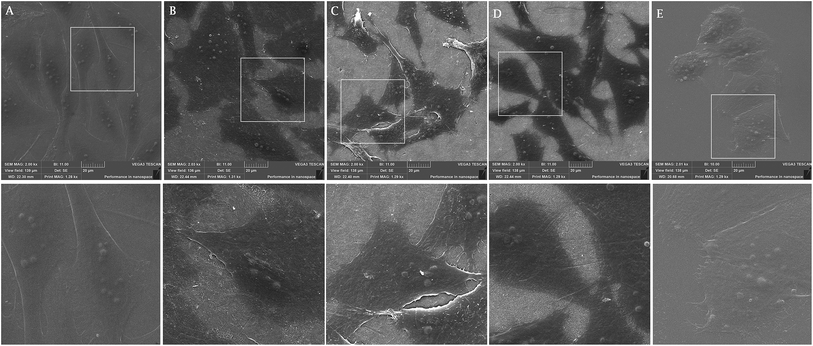
On smooth surfaces of untreated Ti and glass dense positive vinculin areas were colocalized with the ends of F-actin stress fibres (Fig. 3A and E). Talin shows a continuous distribution in cytoplasm, with stronger signal on the edges of the cells cultured on glass (Fig. 3G–K). Saos-2 adhesion, 48 h after seeding describe the SEM images in Fig. 4. Cells were well spread on all scaffolds, with polygonal shape and developed filopodia. On nanostructured samples, the morphology was flatter than on glass coverslip and untreated cpTi.
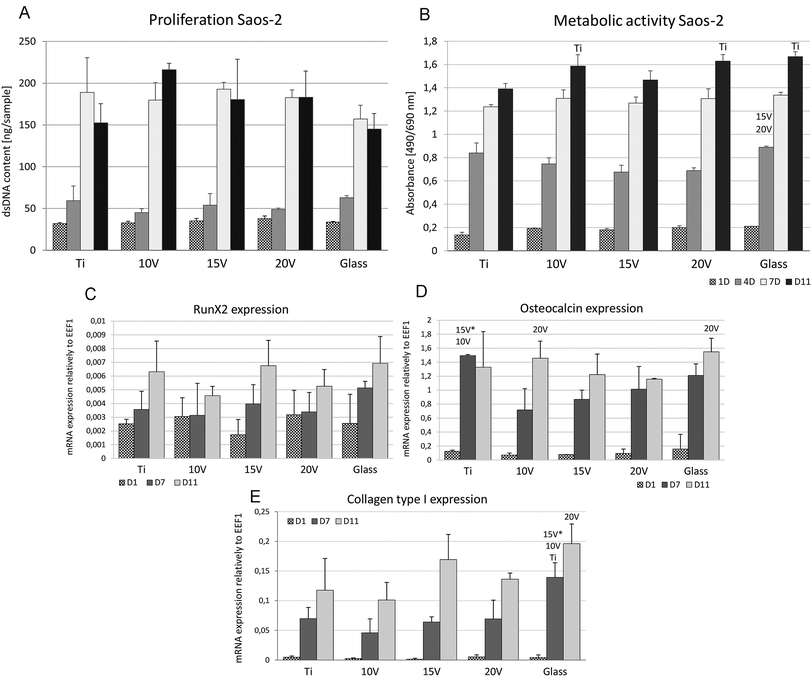
Cell proliferation was high in all samples with no differences among nanostructured or control samples, see Fig. 5A. The highest dsDNA amount was measured at 10 V. Additionally, cell visualization using live/dead staining, shows an increase in the Saos-2 number in cultivation time and 100% living cells on all the samples. However, a decreased concentration of the cells at 10 V and 20 V were detected on day 11 compared to other samples.
The metabolic activity of Saos-2 (Fig. 5B) during the first four days did not differ among the samples. Contrariwise, samples 10 V and 20 V showed significantly higher absorbance compared to Ti on day 11. Higher absorbance values of MTS were obtained at 10 V, 20 V and glass compared to Ti on day 1. On day 4, Ti showed a higher absorbance than 15 V. Moreover, glass showed a higher absorbance than 15 V and 20 V on day 4. No significant differences were seen on day 7. Fig. 5(C–E) shows an osteogenic differentiation on titanium samples during 11 days of the cell culture. The high increase of osteocalcin mRNA was found on day 7 in all scaffolds where untreated cpTi showed significantly higher values than nanostructured cpTi samples. Moreover, on day 11 there was a statistically higher osteocalcin mRNA expression in groups 10 V and glass than in the group 20 V. On the first experimental day there were no significant differences among the groups. As shown in Fig. 5(E), collagen type I mRNA expression was increased on days 7 and 11 in all samples and was significantly higher expressed on glass compared to groups 15 V, 10 V and Ti on day 7. On day 11, the collagen type I expression was significantly higher on glass than in the 20 V samples. mRNA synthesis of RunX2, which is an early osteogenic marker, did not show any difference among samples.
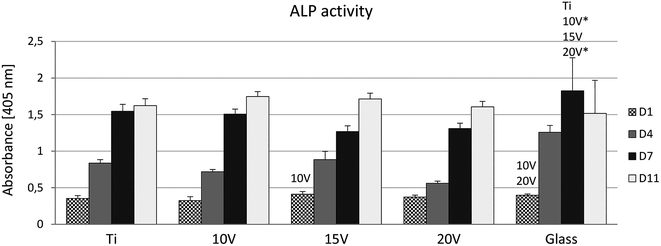
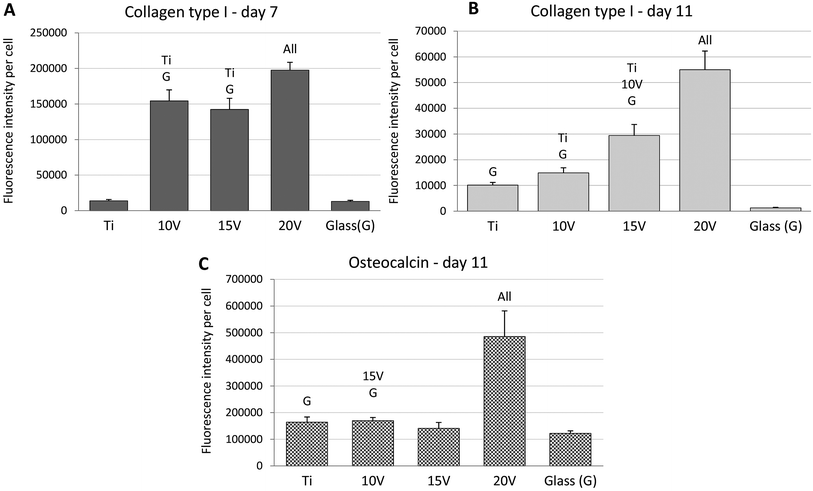
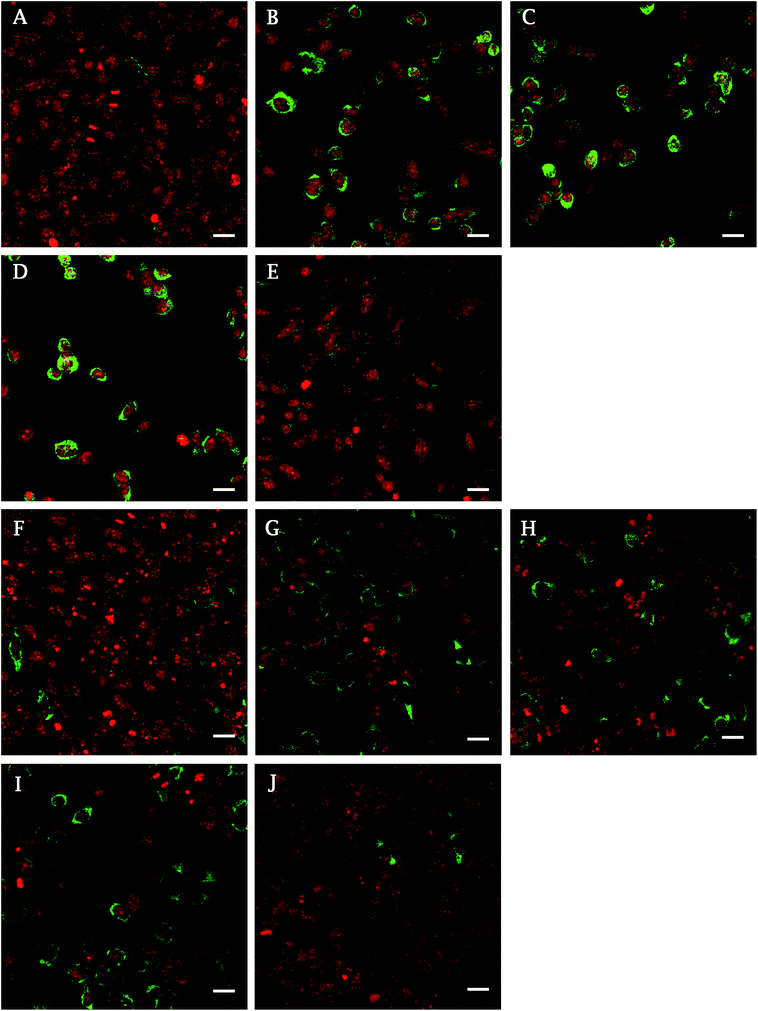
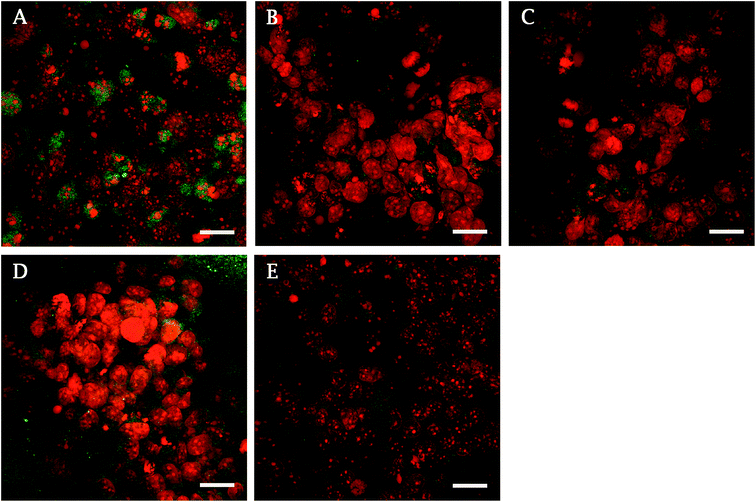
ALP, an early marker of osteogenic differentiation, showed a significantly higher activity of the enzyme on day 1 in the case of glass, compared to samples 10 V, 20 V (Fig. 6). Moreover, 15 V nanostructured cpTi showed a higher ALP than 10 V. Synthesis of collagen type I and osteocalcin by Saos-2 were analysed and calculated from 10 confocal photomicrographs per sample. On day 7 of culture, the fluorescence intensity of collagen type I, was significantly higher on all nanostructured scaffolds compared to control Ti and glass (Fig. 7). Equally, the fluorescence intensity was increased on nanotubes on day 11. The highest intensity was reached in both experimental days at 20 V; moreover, the values were significantly higher compared to nanostructured surfaces 10 V and 15 V. A similar trend was observed for osteocalcin intensity, where evidently the highest presence of osteocalcin was detected at 20 V. In addition, sample 10 V also significantly differs from 15 V and untreated Ti. Similarly, illustrative confocal images in Fig. 8 show increased collagen type I on nanostructured samples, compared to control Ti and glass. Osteocalcin is commonly used as a late marker of osteogenic differentiation; therefore, it was visualised on the end of the experiment. On day 11, the osteocalcin positive areas were presented on all nanostructured and untreated Ti; on the contrary a very low signal was detected on glass as is shown in Fig. 9.
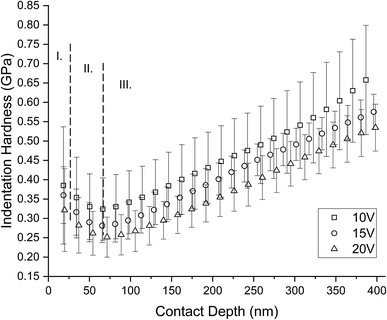
Fig. 10 shows an influence of porosity to the mechanical properties. Mechanical properties decrease with increasing porosity of the titanium sample. Elastic modulus and hardness in the shallow depths correspond to the mechanical properties of human bone. There is evident increase of the mechanical properties with the contact depth. This is the influence of the titanium substrate to the measured nanotubes because of the 1/10 rule.30 The trend of measured data slowly going toward to the bulk cpTi (substrate) mechanical properties; reduced elastic modulus Er ∼ 98–107 GPa and indentation hardness HIT ∼ 3–5 GPa.31,32 Based on the rule 1/10 and length of nanotubes in the Table 2 we can accept measured data up to the contact depth hc = 46.7 ± 2.4 nm for 10 V, hc = 73.1 ± 3.2 nm for 15 V and hc = 109.7 ± 7.5 nm for 20 V. The data up to these depths are not affected by the cpTi substrate and represent mechanical properties of nanotubes. Minimum values of reduced elastic modulus Er = 19.58 ± 8.83 GPa and indentation hardness HIT = 0.32 ± 0.11 GPa were obtained from sample 20 V respectively. Maximum values of reduced elastic modulus of nanotubes Er = 31.59 ± 9.24 GPa and indentation hardness of nanotubes HIT = 0.39 ± 0.15 GPa were obtained from sample 10 V respectively. 15 V has elastic modulus of nanotubes Er = 22.25 ± 5.49 GPa and indentation hardness of nanotubes HIT = 0.36 ± 0.07 GPa.
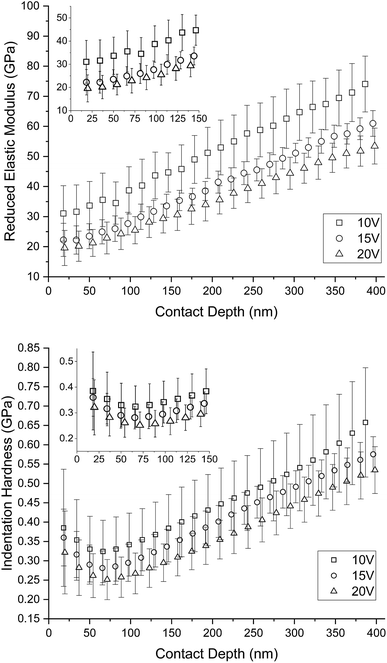 | ||
| Fig. 10 Depth profiles of mechanical properties differently nanostructured cpTi. There is clearly visible influence of porosity on graphs. Mechanical properties decrease with increasing porosity. Based on rule the 1/10 and length of nanotubes in the Table 2 we can accept measured data up to the contact depth hc = 46.7 ± 2.4 nm for 10 V, hc = 73.1 ± 3.2 nm for 15 V and hc = 109.7 ± 7.5 nm for 20 V. | ||
Discussion
Titanium implant integration into bone is a multistep process involving cell adhesion, growth and differentiation, followed by extracellular matrix (ECM) production and mineralization. Therefore, it is important to design biomaterials which support the above-mentioned processes. Nanostructured titanium has become a promising modification for biomedical applications, where the nanotube-based implants have attracted considerable attention. It is believed, that a nanostructured surface better mimics the morphology and function of native bone tissue, and allows for the transport and exchange of metabolites, nutrients and gas.33 Furthermore, in comparison with the smooth surface of implants, a greater surface area of nanostructured titanium is beneficial for cell attachment, spreading and anchoring of their filopodia.34,35 Despite extensive studies of cell behaviour on nanotubes with different diameters, there is still some controversy over nanotube size for optimal osteoblast adhesion, growth and differentiation.36–40 Therefore, we investigated the effect of titanium nanotubes fabricated by anodic oxidation with various diameters (24, 43 and 66 nm) on osteoblast-like cell response. In this study, the human osteosarcoma cell line Saos-2 was chosen as an osteoblastic cell model for the nanostructured titanium system. This cell line has been widely used as in vitro model in bone tissue engineering because of its phenotype stability in prolonged cell passages, high mineralization capacity, bone ECM synthesis and similar behaviour to primary human osteoblasts.41–43The importance of enhancing initial cell adhesion on titanium implants has been the subject of several studies. Popat et al.6 and later Das et al.44 proposed that osteoblasts anchor their filopodia inside TiO2 nanotubes. This theory was later proved by Shokuhfar et al.,35 who used cross sections of SEM and FIB (focused ion beam) milling to visualize the evident interlock between osteoblasts and nanotubes created on cpTi using anodic oxidation, with a diameter of 100 nm and length of 1 μm. Additionally, they reported penetration of the cell filopodia inside the nanotubes on crystalline nanotubes, whereas on amorphous phase of the nanotubes, filopodia adhered on the nanotubes with little filling inside.35 The SEM images presented here show well spread Saos-2 cells on nanostructured samples with filopodia extended from the edge of the polygonal shaped cells. Spindle shaped cells were seen on a smooth cpTi surface. It is widely accepted that cell adhesion is affected by surface chemical properties, roughness, wettability and surface energy. These factors subsequently influence the adsorption of proteins (fibronectin, vitronectin) from media, respective body fluids, which are crucial for initial cell attachment via integrins. It has been suggested that the mechanism of osteoblasts adhesion on nanotube-based surfaces is facilitated via the absorption of positively charged proteins from biological fluids, which intermediate adhesion between cell membrane and TiO2 nanotubes, both negatively charged.37 Gongadze et al. showed that fibronectin binding is enhanced on the sharp edges of the TiO2 nanotubes, where negative surface charge density is increased.39 A number of studies have emphasized the positive effect of a smaller nanotube diameter on osteoblast-like cell adhesion,33,34,45,46 while other studies reported opposite findings.47,48 Therefore, it is necessary to elucidate the mechanism and size-dependent cell behaviour on surfaces with different TiO2 nanotubes diameter.
Initial protein absorption is followed by integrin binding and the formation of focal adhesion, which are highly organized multiprotein complexes mediating interactions of cells with extracellular matrix, but also acting as mechanosensors which can regulate cell phenotype.49 Talin and vinculin have been reported as adaptor proteins associated with the formation and stabilization of focal adhesion complexes. As was demonstrated, talin forms the structural core of focal adhesion via an integrin–talin–actin module. Vinculin bound to talin strengthens and stabilizes focal adhesion complexes.49,50 In the early stage of an integrin mediated adhesion, transient dot-like focal complexes with 0.5–1 μm in diameter were described by Bershadsky et al.51 Some of them later mature into focal adhesion (3–10 μm) associated with actin cytoskeleton.49 Interestingly, 15 V samples showed lower cell spreading compared to 20 V samples as well as higher surface roughness which was probably connected with lower filopodia penetration into nanotubes as well as with lower vinculin amount measured by ELISA assay. This can be affected not only by the nanotube diameter, but also their distance and length. Several in vitro studies have demonstrated an increased vinculin amount on TiO2 nanotube-based surfaces. Dense vinculin positive areas were observed using immunohistochemistry on a nanoporous surface, together with a higher number of focal adhesions, compared to Ti control. In this study, vinculin was visualized in a human osteoblast precursor line (OPC1) 5 days after seeding on nanotubes, with an internal diameter of approximately 51 nm and 600 nm-long created by anodic oxidation at 20 V.44 Similarly, Filova et al. presented an increasing talin and vinculin concentration with increased nanotube diameter created on Ti6Al4V by anodic oxidation. Vinculin and talin were visualized in osteoblasts 3 days after seeding, where the highest concentration was observed on nanotubes with an average inside diameter of 79 nm (30 V).36 Similarly, Saha et al. presented diffused dot-like cytoplasmic vinculin visualized in MG63 osteoblasts cultured for 60 h on various nanostructured Ti6Al4V surfaces. Colocalization of F-actin with vinculin was only documented on polished titanium. Moreover, an increase in the cell area was found on nanotubes with a diameter in the range of 25–55 nm in comparison with the smooth Ti6Al4V.52 These findings correspond with our results from vinculin and talin visualization on nanostructured cpTi samples following 24 h of culture. A significantly higher concentration of vinculin, determined by ELISA, was on the 20 V samples compared to the smooth Ti and the specimens with a smaller nanotube diameter. This indicates a strong cell adhesion, thanks to the stabilization effect of vinculin on focal adhesion complexes.49,50 The highest amount of talin was found on glass, and, surprisingly, a significantly lower concentration of talin was detected by ELISA at 20 V compared to other cpTi samples. Furthermore, among nanostructured surfaces the highest talin amount was at 15 V with an average nanotube diameter of 43 ± 9 nm. However, this does not have a negative effect on the number of adhered cells on the samples and their metabolic activity on day 1. A possible explanation for this is that nanotubes with a diameter between 24–43 nm are more appropriate for integrin binding and initial formation of focal adhesion, whereas larger nanotubes stimulate focal adhesion maturation and stabilization by vinculin. Further studies are needed to clarify the early stages of focal adhesion maturation on different diameters of TiO2 nanotubes, as most of the previous studies investigated vinculin and talin concentrations on day 3 or later after cell seeding.36,44,53 The formation of focal adhesion is closely connected to cell differentiation and can dramatically influence implant stability.44,46 In general, TiO2 nanotubes prepared by anodic oxidation, have become an effective approach in the stimulation of cell differentiation, but the cell response can vary. Several in vitro studies have demonstrated that nanotubes with a diameter between 15–30 nm supported cell adhesion and spreading, while a larger diameter of 70–100 nm supported osteogenic differentiation, but in some cases caused apoptosis.33,34,54
On the contrary, Filova et al. presented enhanced levels of focal adhesion proteins in Saos-2 osteoblasts on nanotubes with a diameter of 79 nm, while smaller nanotubes (18 nm and 43 nm in diameter) enhanced osteocalcin and osteopontin synthesis, but decreased collagen type I synthesis.36 A faster initial adhesion and enhanced differentiation of primary rat osteoblasts on TiO2 nanotubes was reported, whereas the fastest adhesion was observed on nanotubes with a diameter of 170 nm compared to flat titanium and 50 nm nanotubes.47 Therefore, for design of future nanostructure-based bone implants it is important to elucidate a correlation between nanotube diameter and specific cell response.
Interestingly in this study, no significant changes in cell proliferation were observed among all titanium surfaces, which relates to a high biocompatibility of the samples. However, the cell metabolic activity of 10 V and 20 V was higher than the smooth cpTi on day 11. Even so, we presented an enhanced synthesis of osteogenic markers (osteocalcin, collagen type I) on nanotubes with an average diameter of 66 nm (20 V). During the cell culture, the cell number increased significantly. Fluorescence measurement of type I collagen and osteocalcin was calculated as relative per cell so the total values decreased in all samples but was still the highest in 20 V samples. Moreover, the higher density of cells supports collagen production even in Ti samples and glass; therefore, after longer culture the differences are lower compared to day 7. As osteocalcin is a late marker of differentiation, the higher amount is visible after a longer cell culture. Our aim was to visualize the enhancement of osteocalcin synthesis in the samples. We have tested fluorescence intensity on day 11, and we have found small amounts in all samples as seen in Fig. 7. In addition, the alkaline phosphatase (ALP) activity, RunX2 and osteocalcin mRNA expression rose during 11 days of the Saos-2 cultivation on nanostructured cpTi samples. Our data from the intensity of collagen type I and osteocalcin correspond with the statement that osteoblasts initiate a higher expression of osteogenic markers on nanoporous surfaces compared to smooth control titanium.44
Simultaneously, Lv et al. demonstrated that TiO2 nanotubes fabricated by anodic oxidation with a diameter of 70 nm enhance ALP activity, RunX2 and osteocalcin expression in human adipose derived stem cells, compared to 50 nm and 100 nm. Along with this, the authors described that the epigenetic mechanism of osteogenic differentiation is mediated through the upregulating methylation of histone H3 at lysine 4, in the promoter region of osteogenic genes RunX and osteocalcin.38 A higher osteogenic differentiation was also described in rat osteoblasts cultured on 70 nm nanotubes compared to control titanium.55,56 Furthermore, Yu et al. showed that small nanotubes (30 nm) enhance cell adhesion in normal conditions, but in an oxidative stress microenvironment larger nanotube diameters (110 nm) are superior for cell adhesion, differentiation and oxidative stress protection than small nanotubes and native Ti.56 Another research group compared osteogenic differentiation potential (in vitro) and osseointegration (in vivo) of titanium implants with large (90 nm) and small (30 nm) inside nanotube diameter created by anodization at 20 V and 10 V. In vivo experiments on rats showed an improved osseointegration and bone formation on large nanotube implants 2 weeks after implantation into tibia. They also revealed the mechanism of osteogenic differentiation through focal adhesion kinase/Ras homolog gene family member A/yes-associated protein signalling cascade in the MC3T3-E1 osteoblastic cell line, which was greater on implants with a larger nanotube diameter.46 As previously described, the beneficial effect of nanotube-based titanium implants osseointegration and bio-functionality can be further encouraged by loading nanotubes with bioactive molecules such as peptides, growth factors, antibacterial substances, nanoparticles or hydroxyapatite.57,58 All of these findings could prove to be very promising for the future biomedical application of nanotube modified body implants.
A problem of the present implants are big differences of mechanical properties between titanium implants and bone. TiO2 nanotubes create interface between bone and bulk cpTi implant. We showed in this study that TiO2 nanotubes reduce this interface by creating gradient transition. Thus, the cells are in contact with biocompatible material of same stiffness as an osteointegrating bone.59–61 The stiffness increased toward to bulk cpTi material. We can assume that by removing the mechanically incompatible transition we extend the life of the implant by limiting the micro-motions occurring on the ramp change of stiffness at the interface between bone and bulk titanium.62 As similar hardness trends (Fig. 11) were observed by Crawford et al. 2007 and Xu et al. 2015.63,64 In our work, we used Berkovich indenter with 100 nm radius of the tip and our nanotubes had diameters from 24 ± 5 to 66 ± 14 nm; therefore, the deformation mechanism combines both Berkovich and spherical indentation processes from Xu et al. 2015. In our case of probe radius and nanotubes diameters, we can consider our Berkovich probe as spherical in shallow depths (Zone I). Analogically to Xu 2015, Zone I: initial compression of nanotubes in axial direction; Zone II: combination of compression and lateral bending of nanotubes; Zone III: combination of densification and influence of substrate (Fig. 11). Initial compression of upstanding nanotubes appears to be more resistive to the load (Zone 1) than penetration in to bended nanotubes at later stage (Zone 2).
In conclusion, our study herewith confirmed the findings regarding the positive effect of nanostructured titanium surface morphology on osteoblast like cell adhesion and differentiation. We suggest that nanotubes with a diameter of around 66 nm created by anodic oxidation can increase the osseointegration potential of titanium implants. The study also highlights the benefits of nanotube-based titanium bone implants, which could reduce healing time through better osteoblasts attachment, differentiation and growth.
Conclusions
In this study, TiO2 nanotubes with a diameter in the range of 24–66 nm were produced on cpTi using anodic oxidation at 10 V, 15 V and 20 V in fluorine-containing electrolyte. We reported that with higher applied voltage, the length and diameter of the nanotubes increased. Moreover, the higher diameter of nanotubes showed lower elastic modulus and indentation hardness. The human osteoblast like cell culture (Saos-2) indicated that the presence of nanotubes support cell adhesion, moreover the nanostructured surface leads to deeper anchoring of the cells and flatter morphology. Both cell proliferation and metabolic activity assays showed good biocompatibility of all the tested cpTi surfaces. Early osteogenic markers, alkaline phosphates activity and RunX2 expression, did not differ among the cpTi samples, and ALP activity was increasing in all samples. Fluorescence confocal microscopy indicated dot like structures of focal adhesive molecules with the highest concentration of vinculin and talin on the 20 V samples. Similarly, the synthesis of collagen and osteocalcin increased on the nanostructured cpTi, while 20 V showed the highest synthesis of both collagen type I and osteocalcin. The best results in cell response were achieved on the nanostructured cpTi at 20 V, which support Saos-2 proliferation and osteogenic differentiation. In conclusion, TiO2 nanotubes with a diameter close to 66 nm showed the highest benefit in vitro and therefore anodic oxidation at 20 V could be applied to improve bone implants osseointegration. It is expected that this study will be helpful in the future development of appropriate nanotube-based titanium implants.Conflicts of interest
There are no conflicts to declare.Acknowledgements
Contributions of the authors: data analysis & collection, in vitro experiments, manuscript preparation: BV; SEM analysis & samples preparation, manuscript preparation: VH, JF, LJ; microphotographs analysis: MR; qPCR: VS, VB; SEM of cells: VL; ELISA: KV, study design, data interpretation, sample preparation: MD; in vitro experiments planning, confocal microscopy, manuscript preparation: EF. This study was supported by the Czech Science Foundation, Project No. 16-14758S.References
- M. Longand and H. J. Racks, Biomaterials, 1998, 19, 1621–1639 CrossRef.
- T. Okabe and H. Hero, Cells Mater., 1995, 5, 211–230 Search PubMed.
- E. P. Su, D. E. Justin, C. R. Pratt, V. K. Sarin, V. S. Nguyen and S. Oh, Bone Joint J., 2018, 100B, 9–16 CrossRef PubMed.
- L. Salou, A. Hoornaert, G. Louarn and P. Layrolle, Acta Biomater., 2015, 11, 494–502 CrossRef CAS PubMed.
- L. M. Bjursten, L. Rasmusson, S. Oh, G. C. Smith, K. S. Brammer and S. Jin, J. Biomed. Mater. Res., Part A, 2010, 92A, 1218–1224 CAS.
- K. C. Popat, L. Leoni, C. A. Grimes and T. A. Desai, Biomaterials, 2007, 28, 3188–3197 CrossRef CAS.
- H. Tang, Y. Li, J. W. Ma, X. Zhang, B. Li, S. Liu, F. Dai and X. Zhang, Bio-Med. Mater. Eng., 2016, 27, 485–494 CAS.
- T. J. Levingstone, N. Barron, M. Ardhaoui, K. Benyounis, L. Looney and J. Stokes, Surf. Coat. Technol., 2017, 313, 307–318 CrossRef CAS.
- G. Balasundaram, D. M. Storey and T. J. Webster, Int. J. Nanomed., 2015, 10, 527–535 Search PubMed.
- J. Z. Hao, Y. Li, B. E. Li, X. Wang X, H. Li, S. Liu, C. Lian and H. Wang, Appl. Biochem. Biotechnol., 2017, 183, 280–292 CrossRef CAS.
- T. P. Queiroz, R. S. de Molon, F. A. Souza, R. Margonar, A. H. Thomazini, A. C. Guastaldi and E. Hochuli-Vieira, Clinical Oral Investigations, 2017, 21, 685–699 CrossRef.
- J. Bonse, S. V. Kirner, M. Griepentrog, D. Spaltmann and J. Krüger, Materials, 2018, 11, 801 CrossRef PubMed.
- M. Kheradmandfard, S. F. Kashani-Bozorg, C. L. Kim, A. Z. Hanzaki, Y. S. Pyoun, J. H. Kim, A. Amanov and D. E. Kim, Ultrason. Sonochem., 2017, 39, 698–706 CrossRef CAS PubMed.
- N. B. Li, S. J. Sun, H. Y. Bai, G. Y. Xiao, W. H. Xu, J. H. Zhao, X. Chen, Y. P. Lu and Y. L. Zhang, Nanotechnology, 2018, 29, 045101 CrossRef PubMed.
- V. S. Shin, I. K. Yoon, G. S. Lee, W. C. Jang, J. C. Knowles and H. W. Kim, J. Tissue Eng., 2011, 2011, 674287 Search PubMed.
- H. S. Ahn, J. Y. Hwang, M. S. Kim, J. Y. Lee, J. W. Kim, H. S. Kim, U. S. Shin, J. C. Knowles, H. W. Kim and J. K. Hyun, Acta Biomater., 2015, 13, 324–334 CrossRef CAS.
- V. Zwilling, M. Aucouturier and E. Darque-Ceretti, Electrochim. Acta, 1999, 45, 921–929 CrossRef CAS.
- P. Roy, S. Berger and P. Schmuki, Angew. Chem., Int. Ed., 2011, 50, 2904–2939 CrossRef CAS PubMed.
- S. Minagar, J. Wang, C. C. Berndt, E. P. Ivanova and C. Wen, J. Biomed. Mater. Res., Part A, 2013, 101, 2726–2739 CrossRef PubMed.
- Q. Wang, J. Y. Huang, H. Q. Li, A. Z. Zhao, Y. Wang, K. Q. Zhang, H. T. Sun and Y. K. Lai, Int. J. Nanomed., 2016, 12, 151–165 CrossRef PubMed.
- D. Ionita, D. Bajenaru-Georgescu, G. Totea, A. Mazare, P. Schmuki and I. Demetrescu, Int. J. Pharm., 2017, 517, 296–302 CrossRef CAS PubMed.
- W. W. Liu, P. L. Su, S. Chen, N. Wang, Y. Ma, Y. Liu, J. Wang, Z. Zhang, H. Li and T. J. Webster, Nanoscale, 2014, 6, 9050–9062 RSC.
- N. Esfandiari, A. Simchi and R. Bagheri, J. Biomed. Mater. Res., Part A, 2014, 102, 2625–2635 CrossRef CAS.
- M. Niinomi and M. Nakai, Int. J. Biomater., 2011, 836587 CAS.
- G. Crawford, N. Chawla, K. Das, S. Bose and A. Bandyopadhyay, Acta Biomater., 2007, 3, 359–367 CrossRef CAS PubMed.
- R. M. Alice, Fluorescent Image Analyser (ver 1.0), software available at http://alice.fbmi.cvut.cz Search PubMed.
- P. Vlcak, F. Cerny, J. Drahokoupil, J. Sepitka and Z. Tolde, J. Alloys Compd., 2015, 620, 48–54 CrossRef CAS.
- P. Vlcak, J. Sepitka, J. Drahokoupi, T. Horazdovsky and Z. Tolde, J. Nanomater., 2016, 2016, 1–7 Search PubMed.
- W. C. Oliver and G. M. Pharr, J. Mater. Res., 1992, 7, 1564–1583 CrossRef CAS.
- ISO 14577-4: 2007, Metallic materials - Instrumented indentation test for hardness and materials parameters - Part 4: Test method for metallic and non-metallic coatings Search PubMed.
- J. M. Cordeiro, T. Beline T, A. L. R. Ribeiro, E. C. Rangel, N. C. da Cruz, R. Landers, L. P. Faverani, L. G. Vaz, L. M. G. Fais, F. B. Vicente, C. R. Grandini, M. T. Mathew, C. Sukotjo and V. A. R. Barão, Dent. Biomater., 2017, 33, 1244–1257 CrossRef CAS.
- P. Vlcak, J. Drahokoupil, P. Vertat, J. Sepitka and J. Duchon, J. Alloys Compd., 2018, 746, 490–495 CrossRef CAS.
- K. S. Brammer, S. Oh, C. J. Cobb, L. M. Bjursten, H. van der Heyde and S. Jin, Acta Biomater., 2009, 5, 3215–3223 CrossRef CAS PubMed.
- S. Oh, K. S. Brammer, S. J. Li, D. Teng, A. J. Engler, S. Chien and S. Jin, Proc. Natl. Acad. Sci. U. S. A., 2009, 106, 2130–2135 CrossRef CAS PubMed.
- T. Shokuhfar, A. Hamlekhan, J. Y. Chang, C. K. Choi, C. Sukotjo and C. Friedrich, Int. J. Nanomed., 2014, 9, 3737–3748 Search PubMed.
- E. Filova, J. Fojt, M. Kryslova, H. Moravec, L. Joska and L. Bacakova, Int. J. Nanomed., 2015, 10, 7145–7163 CrossRef CAS PubMed.
- M. Kulkarni, A. Mazare, E. Gongadze, Š. Perutkova, V. Kralj-Iglič, I. Milošev, P. Schmuki, A. Iglič and M. Mozetič, Nanotechnology, 2015, 26, 062002 CrossRef CAS.
- L. W. Lv, Y. S. Liu, P. Zhang, X. Zhang, J. Liu, T. Chen, P. Su, H. Li and Y. Zhou, Biomaterials, 2015, 39, 193–205 CrossRef CAS.
- E. Gongadze, D. Kabaso, S. Bauer, T. Slivnik, P. Schmuki, U. van Rienen and A. Iglič, Int. J. Nanomed., 2011, 6, 1801–1816 Search PubMed.
- A. Tian, X. F. Qin, A. H. Wu, H. Zhang, Q. Xu, D. Xing, H. Yang, B. Qiu, X. Xue, D. Zhang and C. Dong, Int. J. Nanomed., 2015, 10, 2423–2439 CrossRef CAS.
- H. J. Hausser and R. E. Brenner, RSC Adv., 2005, 333, 216–222 CAS.
- E. M. Czekanska, M. J. Stoddart, J. R. Ralphs, R. G. Richards and J. S. Hayes, J. Biomed. Mater. Res., Part A, 2014, 102, 2636–2643 CrossRef CAS.
- E. M. Czekanska, M. J. Stoddart, R. G. Richards and J. S. Hayes, Eur. Cells Mater., 2012, 24, 1–17 CrossRef CAS.
- K. Das, S. Bose and A. Bandyopadhyay, J. Biomed. Mater. Res., Part A, 2009, 90, 225–237 CrossRef PubMed.
- J. Park, S. Bauer, K. A. Schlegel, F. W. Neukam, K. von der Mark and P. Schmuki, Small, 2009, 5, 666–671 CrossRef CAS.
- H. Zhang, L. F. Cooper, X. N. Zhang, Y. Zhang, F. Deng, J. L. Song and S. Yang, RSC Adv., 2016, 6, 44062–44069 RSC.
- Y. Zhang, R. Luo, J. Tan J, J. X. Wang, X. Lu, S. X. Qu, J. Weng and B. Feng, Regener. Biomater., 2017, 4, 81–87 CrossRef CAS PubMed.
- R. Zhang, H. Wu, J. Ni, C. Zhao, Y. Chen, C. Zheng and X. Zhang, Mater. Sci. Eng., C, 2015, 53, 272–279 CrossRef CAS PubMed.
- S. Di Cio and J. E. Gautrot, Acta Biomater., 2016, 30, 26–48 CrossRef CAS.
- J. R. Liu, Y. L. Wang, W. I. Goh, H. Goh, M. A. Baird, S. Ruehland, S. Teo, N. Bate, D. R. Critchley, M. W. Davidson and P. Kanchanawong, Proc. Natl. Acad. Sci. U. S. A., 2015, 112, E4864–E4873 CrossRef CAS PubMed.
- A. D. Bershadsky, C. Ballestrem, L. Carramusa, Y. Zilberman, B. Gilquin, S. Khochbin, A. Y. Alexandrova, A. B. Verkhovsky, T. Shemesh and M. M. Kozlov, Eur. J. Cell Biol., 2006, 85, 165–173 CrossRef CAS PubMed.
- S. Saha, R. Kumar, K. Pramanik and A. Biswas, Appl. Surf. Sci., 2018, 449, 152–165 CrossRef CAS.
- H. Moravec, M. Vandrovcova, K. Chotova, J. Fojt, E. Pruchova, L. Joska and L. Bacakova, Mater. Sci. Eng., C, 2016, 65, 313–322 CrossRef CAS.
- J. Park, S. Bauer, K. von der Mark and P. Schmuki, Nano Lett., 2007, 7, 1686–1691 CrossRef CAS PubMed.
- M. Lai, Z. Y. Jin and Z. G. Su, Mater. Sci. Eng., C, 2017, 73, 490–497 CrossRef CAS PubMed.
- Y. Yu, X. Shen, Z. Luo, Y. Hu, M. Li, P. Ma, Q. Ran, L. Dai, Y. He and K. Cai, Biomaterials, 2018, 167, 44–57 CrossRef CAS.
- A. Roguska, M. Pisarek, A. Belcarz, L. Marcon, M. Holdynski, M. Andrzejczuk and M. Janik-Czachor, Appl. Surf. Sci., 2016, 388(part B), 775–785 CrossRef CAS.
- W. F. Oliveira, I. R. S. Arruda, G. M. M. Silva, G. Machado, L. C. B. B. Coelho and M. T. S. Correia, Mater. Sci. Eng., C, 2017, 81, 597–606 CrossRef CAS PubMed.
- F. Butz, H. Aita, C. J. Wang and T. Ogawa, J. Dent. Res., 2006, 85, 560–565 CrossRef CAS PubMed.
- R. Korsa, J. Lukes, J. Sepitka and T. Mares, J. Biomech. Eng., 2015, 137, 081002 CrossRef.
- D. Wu, P. Isaksson, S. J. Ferguson and C. Persson, Acta Biomater., 2018, 78, 1–12 CrossRef.
- T. Sugiura, K. Yamamoto, S. Horita, K. Murakami and T. Kirita, Clin. Implant Dent. Relat. Res., 2018, 20, 43–49 CrossRef.
- G. Crawford, N. Chawla, K. Das, S. Bose and A. Bandyopadhyay, Acta Biomater., 2007, 3, 359–367 CrossRef CAS PubMed.
- Y. Xu, M. Liu, M. Wang, A. Oloyede, J. Bell and C. Yan, J. Appl. Phys., 2015, 118, 145301 CrossRef.
Footnote |
| † Electronic supplementary information (ESI) available. See DOI: 10.1039/c9ra00761j |
| This journal is © The Royal Society of Chemistry 2019 |


