
 Open Access Article
 This Open Access Article is licensed under a Creative Commons Attribution-Non Commercial 3.0 Unported Licence
An integrated microchannel biosensor platform to analyse low density lactate metabolism in HepG2 cells in vitro
Shengli Mi†
 abe,
Jingjing Xia†ab,
Yuanyuan Xuab,
Zhichang Duab and
Wei Sun*abcd
abe,
Jingjing Xia†ab,
Yuanyuan Xuab,
Zhichang Duab and
Wei Sun*abcd
aGraduate School at Shenzhen, Tsinghua University, Shenzhen 51805, P. R. China
bDepartment of Mechanical Engineering and Mechanics, Tsinghua University, Beijing 100084, P. R. China
cDepartment of Mechanical Engineering, Drexel University, Philadelphia, PA, USA
dTsinghua-Berkeley Shenzhen Institute, Shenzhen 51805, P. R. China
eOpen FIESTA Center, Tsinghua University, Shenzhen 51805, P. R. China
First published on 19th March 2019
Abstract
In this study, we developed an electrochemical microchannel biosensor platform to analyse lactate metabolism in cells. This biosensor platform was fabricated by photolithography, thin-film deposition and microfluidic technology. A kind of functional biomaterial was prepared by mixing lactate oxidase, single-walled carbon nanotubes and chitosan, and platinum as working and blank electrodes of the biosensor was modified by a thin Prussian blue layer. The lactate biosensor was obtained by dropping functional biomaterials on the electrode. The results demonstrated that the sensitivity of the electrochemical biosensor was up to 567 nA mM−1 mm−2 and the limit of detection was 4.5 μM (vs. Ag/AgCl as the counter/reference electrode). The biosensor used to quantitatively detect metabolic lactate concentrations in HepG2 cells cultured with cancer drugs showed high sensitivity, selectivity and stability, and has potential applications in organ-on-a-chip and tissue engineering technologies, which typically involve low concentrations of metabolites.
Introduction
The application of biosensors is of great importance in many diverse areas, such as medical and environmental chemistry and in industrial and biotechnological production.1–4 Compared with traditional analytical methods, including chemiluminescence,5 high-performance liquid chromatography,6 mass spectrometric analysis,7 spectrophotometry8 and capillary electrophoresis,9 electrochemical biosensors have exhibited many excellent characteristics, such as sensitivity, simple instrumentation, portability and low cost.10,11 Particularly, amperometric enzyme biosensors are more attractive because of their ability to analyse a range of clinical biomarkers and their high sensitivity and wide detection range.12,13When a specific enzyme attached to a biosensor recognizes a specific target analyte, this type of biosensor provides quantitative information regarding the analyte by converting the chemical signal generated during the biocatalytic reaction into a measurable current signal.14,15 Enzyme biosensors are typically composed of electrodes and functional biomaterials.16 Electrodes can transmit a measurable response electrically and are often fabricated by platinum (Pt),17,18 gold (Au),19 glassy carbon,20,21 and screen-printed carbon ink,22,23 among others. Inorganic Prussian blue, which is obtained by electrodeposition, shows better catalytic activity and higher selectivity for H2O2 detection in the presence of O2 compared with Pt in neutral medium.21 A thin Prussian blue layer of biosensors plays an important role in the measurement of low concentrations of analyte measurement cell assay due to its electrocatalytic character.20 Functional biomaterials mainly include specific enzymes for target biomarkers and biopolymers for enzyme immobilization and stabilization, minimizing interference from other substances and reducing interfacial impedance.18,19,24 The biopolymer chitosan has been considered a suitable candidate for biosensors because of its biocompatibility, strong adhesion, good hydrophilicity and film-forming ability.25–27 Sometimes, carbon nanotubes, which have abundant functional groups, are typically incorporated into functional biomaterials as electron transfer mediators and electrocatalytic mediums to improve the sensitivity and stability of biosensors.27–30
The measurement of metabolites from cell cultures is an important tool in cancer cell research and drug screening,1 and lactate is an important parameter of metabolism31 and can be used to track cell's performance and metabolic activity.18,32 Changes in metabolism play a pathological role in the development of cancer.33 Anticancer drugs that alter the metabolism can be added for understanding metabolic characterization of cancer cells. Furthermore, the concentrations of metabolites in low cell number or density, such as those found in organ-on-a-chip and microtissue applications, are less than those found in the human body.18,19 Therefore, it is extremely critical that biosensors have high sensitivity and low detection limits for accurately measuring low concentrations of target analytes in complex biological environments of cell cultures.
In this work, we reported an amperometric lactate biosensor based on electrodes modified by Prussian blue and the lactate oxidase enzyme immobilized by chitosan–carbon nanotubes. The small detection platform biosensors integrated with micro flow channels demonstrated good selectivity and a high sensitivity of 567 nA mM−1 mm−2. The small platform was demonstrated in a cell culture measurement, and the concentrations of lactate in human cancer cell cultures added anticancer drugs were quantified. Our platform, that detects bioanalytes at low concentrations and high-sensitivity, could likely be applied in drug screening, toxicology and personalized cancer diagnosis based on organ-on-a-chip technology.
Experimental section
Materials and apparatus
A glass substrate (B270, 100 ± 2 mm diameter, 500 μm thickness), 5-fluorouracil (5-FU, 99% purity, 25 mg), and L-lactate (≥98% purity) were obtained from Shanghai Aladdin Biochemistry Technology Co., Ltd (Shanghai, China). The hepatic cell line HepG2 (ATTC) was obtained from Shanghai Zhong Qiao Xin Zhou Biotechnology Co., Ltd (Shanghai, China), and cultured according to the manufacturer's instructions. DMEM (high-glucose containing 400 mM L-glutamine, 4500 mg L−1 glucose and sodium pyruvate), penicillin–streptomycin solution (SV30010) and phosphate-buffered saline (1×) (PBS) were obtained from HyClone (Beijing, China). Polydimethylsiloxane (PDMS, Dow Corning) was purchased from Suzhou Research Materials Microtech Co., Ltd (Suzhou, China). Lactate oxidase (LOx, ≥20 units per mg solid, 100 U) from Aerococcus viridans was obtained from Shanghai Yanye Co., Ltd (Shanghai, China). Vincristine sulfate salt (VCS, 98% purity, 25 mg) was purchased from Shanghai Macklin Biochemical Co., Ltd (Shanghai, China). Acetate (HPLC, ≥99.9% purity), potassium ferricyanide (K3Fe(CN)6, AR, ≥99.5% purity), iron chloride hexahydrate (FeCl3·6H2O, ACS grade), chitosan (CS, deacetylation degree ≥95%, viscosity 100–200 mPa.s) and single-walled carbon nanotubes (CNTs, ≥95% purity) were obtained from Shanghai Aladdin Biochemistry Technology Co., Ltd (Shanghai, China). Acetone was purchased from Xilong Scientific, and potassium chloride (KCl) was purchased from Shanghai Lingfeng Chemical Reagent Co., Ltd (Shanghai, China). Hydrochloric acid (HCl) was obtained from Huachengda Co., Ltd (Zhuhai, China). Platinum (Pt), silver (Ag), and titanium (Ti) (≥99.99% purity) were obtained from Zhongnuo Advanced Material Technology Co., Ltd (Beijing, China). Fetal bovine serum (FBS) was obtained from Shanghai Zhong Qiao Xin Zhou Biotechnology Co., Ltd (Shanghai, China).A sputtering platform used for thin-film deposition was obtained from Microelectronics of the Chinese Academy of Sciences (Beijing, China). An ultrasonic homogenizer was made in Ningbo Scientz Biotechnology Co., Ltd (Ningbo, China). The vacuum was obtained from Shanghai Yiheng Scientific Instrument Co., Ltd (Shanghai, China). 6-well cell culture plates were obtained from Corning (Shenzhen) Management Co., Ltd (Shenzhen, China). The CHI 700E electrochemical instrument was purchased from Shanghai Chenhua Instrument Co., Ltd (Shanghai, China). The incubator was purchased from Thermo Fisher Scientific (China) Co., Ltd (Shanghai, China). The peristaltic pump was purchased from Baoding Natong Pump Manufacturing Co., Ltd (Hebei, China).
Electrode array fabrication
The multi-electrode biosensor array was composed of four electrodes for cell culture metabolite analysis. The fabrication processes for the multi-electrode mainly used photolithography, thin-film deposition technology and lift-off. Fig. 1 shows the details. Briefly, a 500 μm transparent glass substrate was thoroughly cleaned before the electrode array was patterned using shadow mask A by photolithography with a positive resist. Then, 30 nm of Ti and 50 nm of Pt were sequentially sputtered on the substrate by the sputtering platform, and the Ti/Pt electrode arrays appeared after the lift-off process in acetone (Fig. 1(b)). Another photolithography step was implemented to form the counter/reference electrode pattern using shadow mask B. Then, a 100 nm-thick Ag film was deposited on the Ti/Pt surface utilizing e-beam sputtering technology (Fig. 1(c)). The substrate was rinsed in acetone to remove the positive resist. To keep the biosensors insulated from the external environment, the last photoresist was spin-coated and patterned onto a non-working area (Fig. 1(d)). The pads of the electrodes were exposed after the array was washed in acetone. Finally, the electrode array in Fig. 1(e) was formed.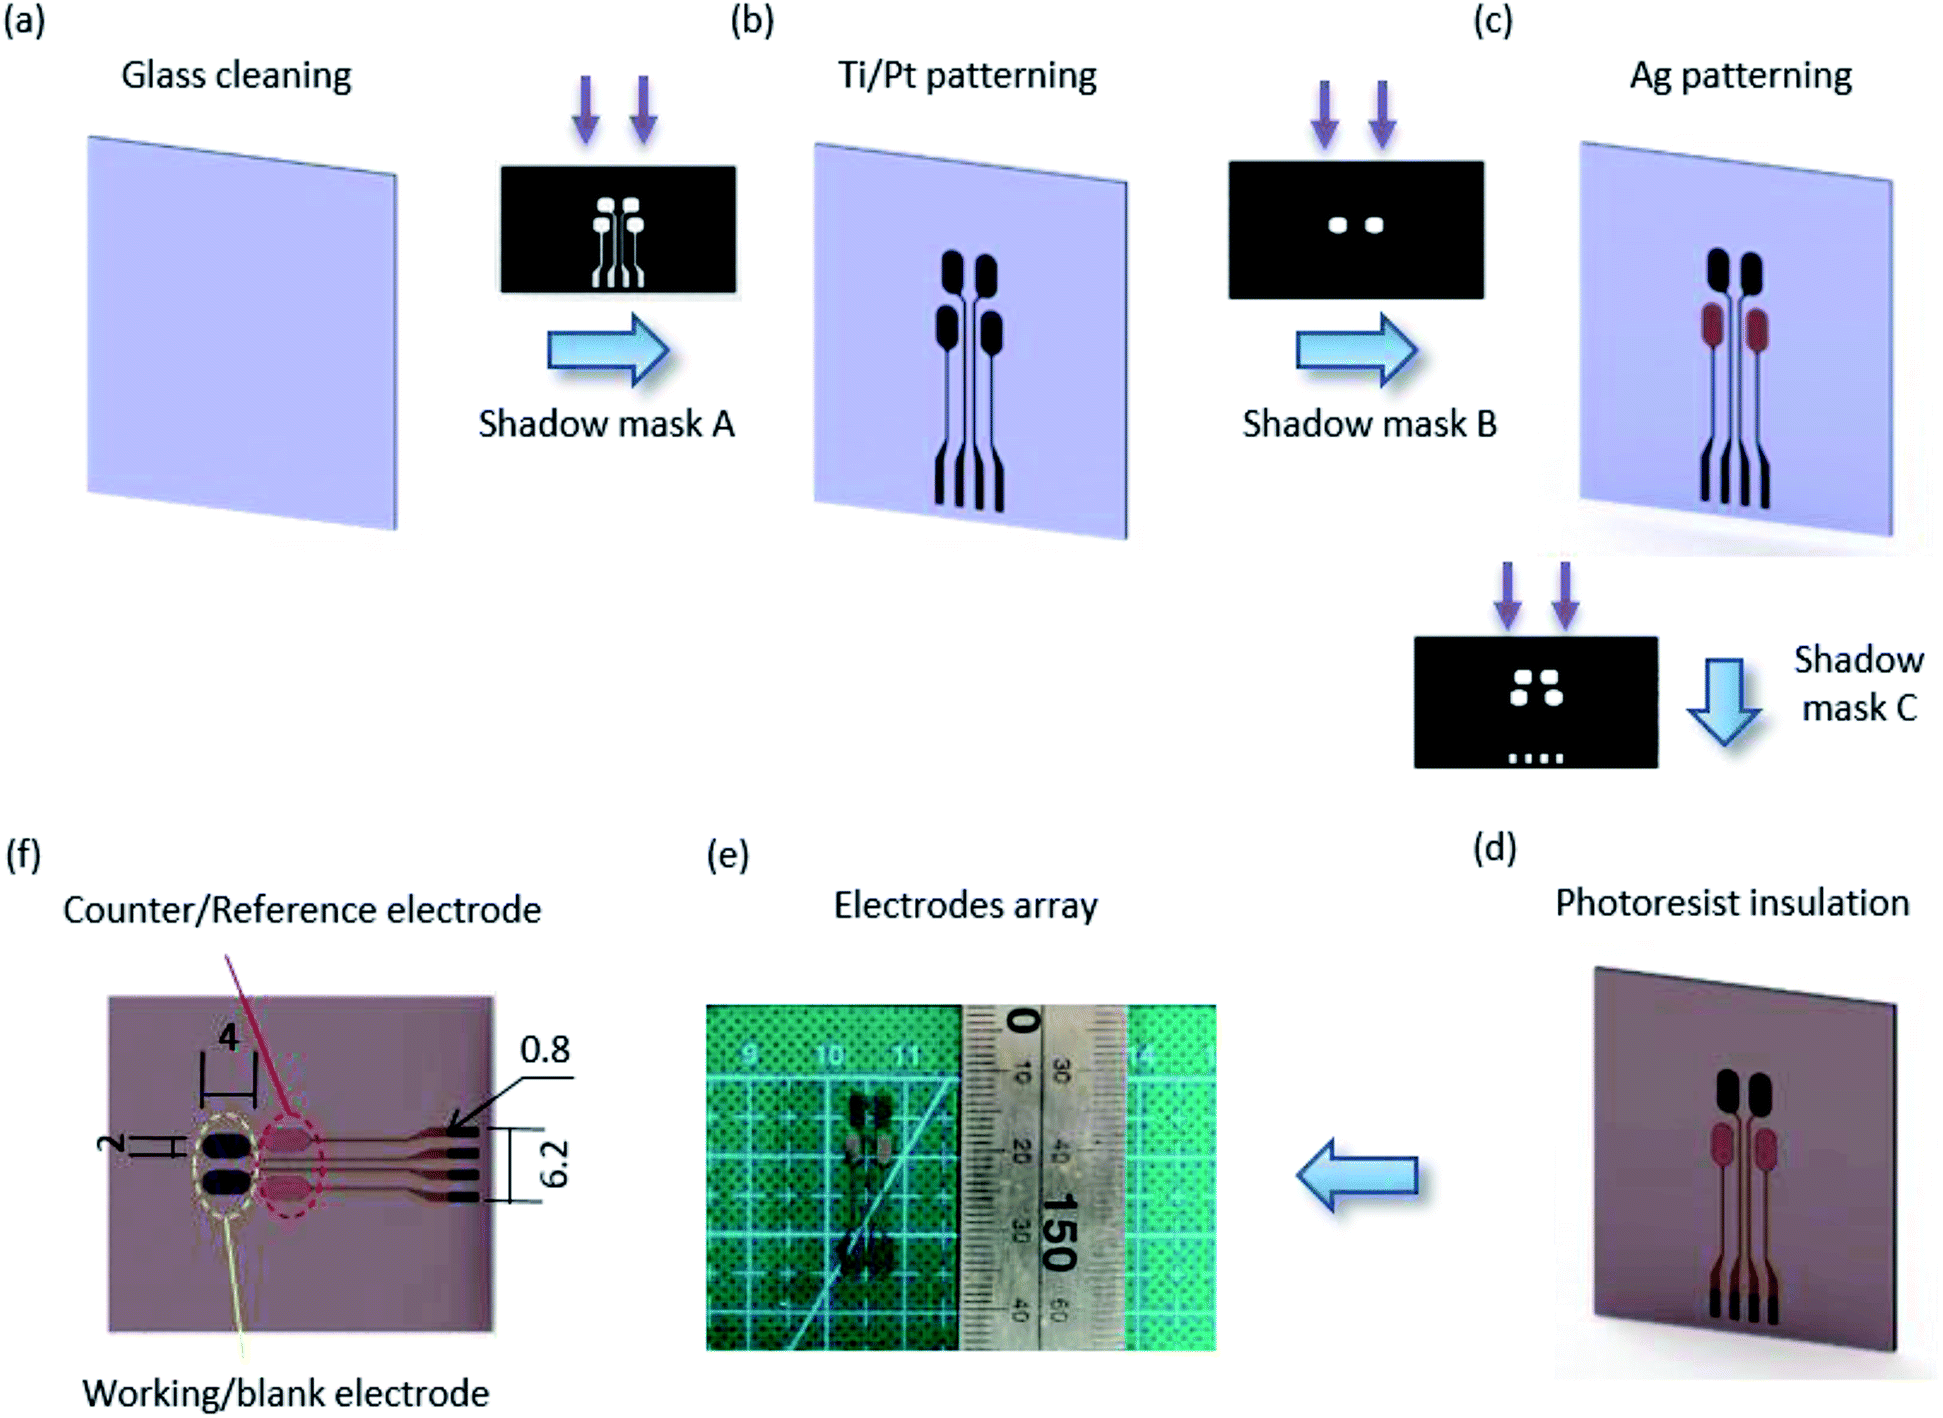 | ||
| Fig. 1 Fabrication processes of the electrode array. (a) Glass substrate cleaned in acetone. (b) Patterning of the Ti/Pt electrodes by using shadow mask A through photolithography and e-beam sputtering, and eliminating the photoresist by using lift-off in acetone. (c) Photolithography and patterning of the Ag electrodes using shadow mask B by e-beam sputtering followed by lift-off in acetone. (d) The photoresist insulating layer patterned by shadow mask C. (e) Image of the electrode array. (f) Close-up schematic of the biosensor electrode array (mm). | ||
Enzyme immobilization
Enzyme immobilization is critical for electrochemical biosensors, and the immobilization-method seriously affects the life of a biosensor.34 In this study, we prepared a biomaterial, that was mixed with CS (good biocompatibility for enzymes) and CNTs (extremely high electron mobility) to immobilize lactate oxidase. First, CS was dispersed in 2% acetic acid and magnetically stirred for 2 h at room temperature to prepare a 1% CS solution. Then, CNTs were sufficiently dispersed for 30 min in CS solution (2 mg mL−1) by an ultrasonic homogenizer. The CS/CNTs precursor solution was stored at a 4 °C when not in use. To prepare the functional biomaterial, a 10 mg mL−1 lactate oxidase solution was prepared by dissolving lactate oxidase in PBS (pH 7.0). The lactate oxidase solution and the precursor solution were thoroughly mixed at a 1![[thin space (1/6-em)]](https://www.rsc.org/images/entities/char_2009.gif) :2 ratio by volume. The CS/CNTs/LOx solution was ready for the electrochemical biosensor.
:2 ratio by volume. The CS/CNTs/LOx solution was ready for the electrochemical biosensor.
Microchannel fabrication
A micro flow channel (Fig. 2) was fabricated by transfer of PDMS into a mould, which was previously prepared by photolithography. Generally, a silicon (Si) wafer was heated and spin-coated with SU8 photoresist (Fig. 2(b)) after cleaning in alcohol. The prebake was exposed to ultraviolet light through the shadow mask followed by heating. Finally, the pattern of the microchannel (Fig. 2(c)) was obtained by alternate flushing with the SU8 developer and alcohol. The microchannel mould was obtained after drying with nitrogen. A 10:1 ratio of PDMS was thoroughly mixed and poured over the mould (placed in a Petri dish) followed by placing in a vacuum for 20 min and baking at 85 °C for 1 h. Then, the PDMS was taken from the mould and formed into the designed shape after the PDMS solidified. The smallest size of the microchannel (200 μm in height) was 300 μm in diameter, and the largest was 11 mm in diameter.
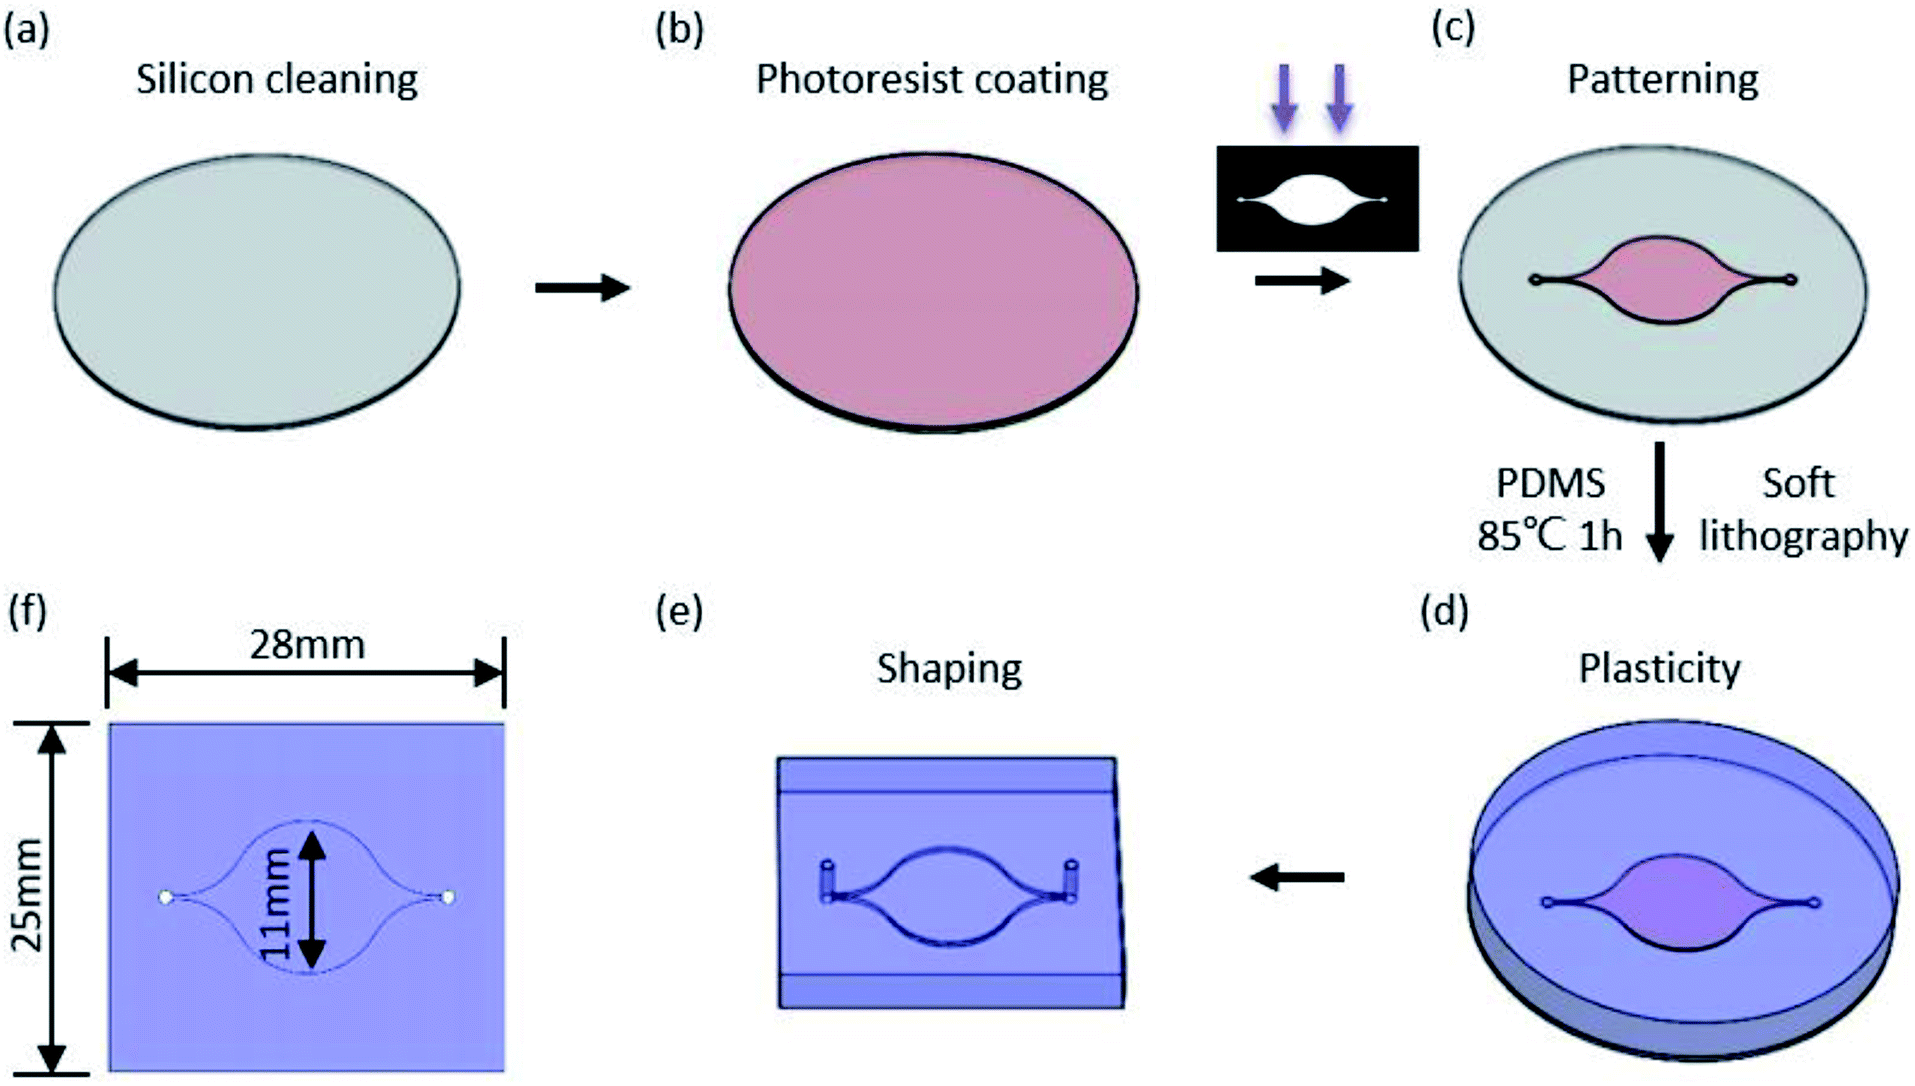 | ||
| Fig. 2 Structuration diagrams of microchannel. (a) Silicon wafer cleaning. (b) Spinning coating with SU8 photoresist. (c) Mould patterning. (d) Soft lithography with PDMS. (e) Shaping with the desired size. (f) Dimension label of microchannels (mm). | ||
Integration of the biosensor platform
Integration of the enzyme biosensor was achieved by modifying the functional biomaterial film on a Prussian blue/platinum (PB/Pt) electrode. For the lactate biosensor, lactate is converted by lactate oxidase, and the intermediate H2O2 is oxidized at the surface of the PB/Pt working electrode. The reaction process of lactate under lactate oxidase conditions is as follows:| lactate + O2 → pyruvate + H2O2 | (a) |
| H2O2 → O2 +2H+ +2e− | (b) |
In the electrode array (Fig. 1(f)), Pt acted as the working electrode and blank electrode due to high chemical stability and perfect electrocatalytic activity for H2O2.35 The Ag/AgCl electrodes were fabricated as counter/reference electrode by drop-casting 10 μL of 0.1 M FeCl3 solution on top of the Ag electrodes for 1 min. Then, the electrode array was scanned for one cycle at a rate of 25 mV s−1 by cyclic voltammetry (CV) from −5 V to 0 V (vs. Ag/AgCl) in a fresh Prussian blue solution configured with 2.5 mM K3Fe(CN)6, 2.5 mM FeCl3, 100 mM KCl and 100 mM HCl. A thinner layer of Prussian blue, which can enhance the sensitivity of the lactate biosensor, was deposited onto the working/blank electrode. The lactate biosensor was obtained by injecting 5 μL of CS/CNTs/LOx solution on top of the PB/Pt working electrode, whereas the same volume of CS/CNTs solution was used on the blank electrode. The biosensors were stored at 4 °C when not in use.
The pads of the electrodes were connected with a printed circuit board (PCB, Fig. 3(a)) using an ultraviolet light-curing adhesive (purchased from a market). The PCB was personally designed using an Altium Designer and was produced by a commercial manufacturer (Shenzhen, China). PDMS and glass showed good adhesion and facilitated the integration of the biosensors and the microchannel is showed in Fig. 3(a).
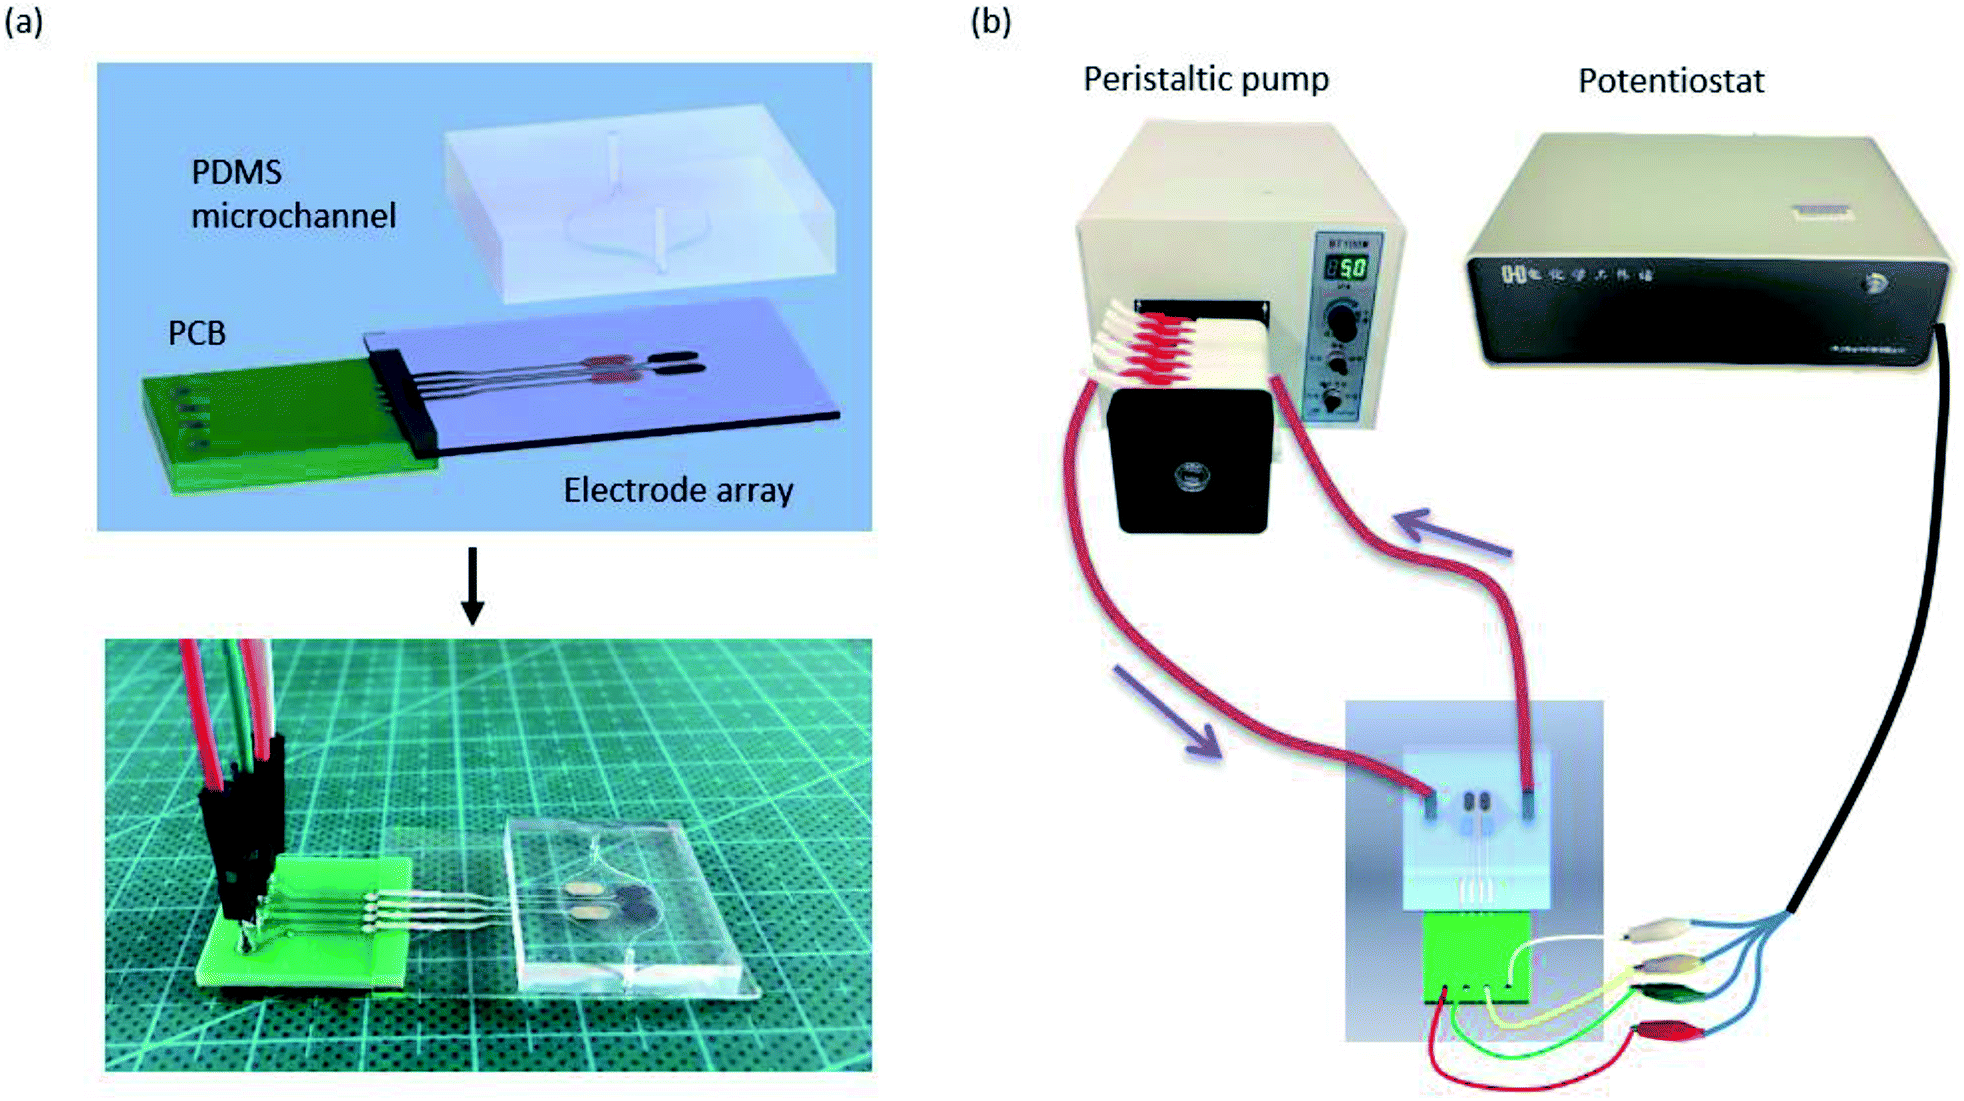 | ||
| Fig. 3 (a) Demonstration of the microchannel biosensor platform integrated PDMS microchannel with PCB-electrode array. (b) Schematic of the PDMS microchannel-biosensor detection platform. | ||
Cell culture
HepG2 hepatic cells were cultured in DMEM supplemented with 10% fetal bovine serum and 1% penicillin/streptomycin at 37 °C in an incubator with a 5% CO2 atmosphere. When the HepG2 cells were cultivated to the eighth generation, the cells were trypsinized and transferred from a Petri dish to a 6-well cell culture plate. The cells were seeded at a density of 2.5 × 10⁵ cells per well in 2 mL of culture medium and were cultured as described above. Following 24 h of incubation and adhesion, 0.5 mL of drug solution (100 or 150 μM 5-FU and 10 or 15 μg mL−1 VCS, respectively) was added to assay well. Conversely, 0.5 mL of medium was added to the control wells. 5-FU is sensitive to light and should be kept in the dark. After the cells were starved for 48 h in the absence of drug and different 5-FU and VCS concentrations, the media was collected for testing.Electrochemical detection protocols
All experimental measurements were performed with a potential of 200 mV vs. Ag/AgCl with a CHI 700E electrochemical instrument in different solutions at room temperature. Fig. 3(b) shows a schematic of the platform along with the PDMS micro flow channel for the biosensing studies. The microchannel device was attached to the potentiostat instrument through the PCB, and the inlet of the micro flow channel was connected to a peristaltic pump. For amperometric enzymatic biosensors, the liquid should remain laminar or stationary to ensure a steady signal during a measurement; therefore, diffusion is the only factor that affects oxidation at the electrode. In this study, we used a flow speed of 5 μL min−1 to simulate the dynamic physiological environment.36 A total of 25 μL of different concentrations of lactate solutions were injected into the channel for analysis. The platform was washed three times using PBS (pH 7.0), and the blank electrode was used to eliminate the influence of an uncertain background.Result and discussion
Biosensor calibration
The calibration values of the biosensor were obtained by detecting different lactate concentrations at a fixed potential of 200 mV. Lactate solutions ranging from 0 mM to 1 mM were prepared by adding lactate to PBS at pH 7.0 and were injected into the microchannel at a typical flow rate of 5 μL min−1. The correspondence between the current and the lactate concentrations can be characterized by the amperometric i–t curve of the potentiostat instrument. Fig. 4 shows that the lactate biosensor showed a positive linear correlation between current signals and lactate concentrations as well as a highly selective characteristic.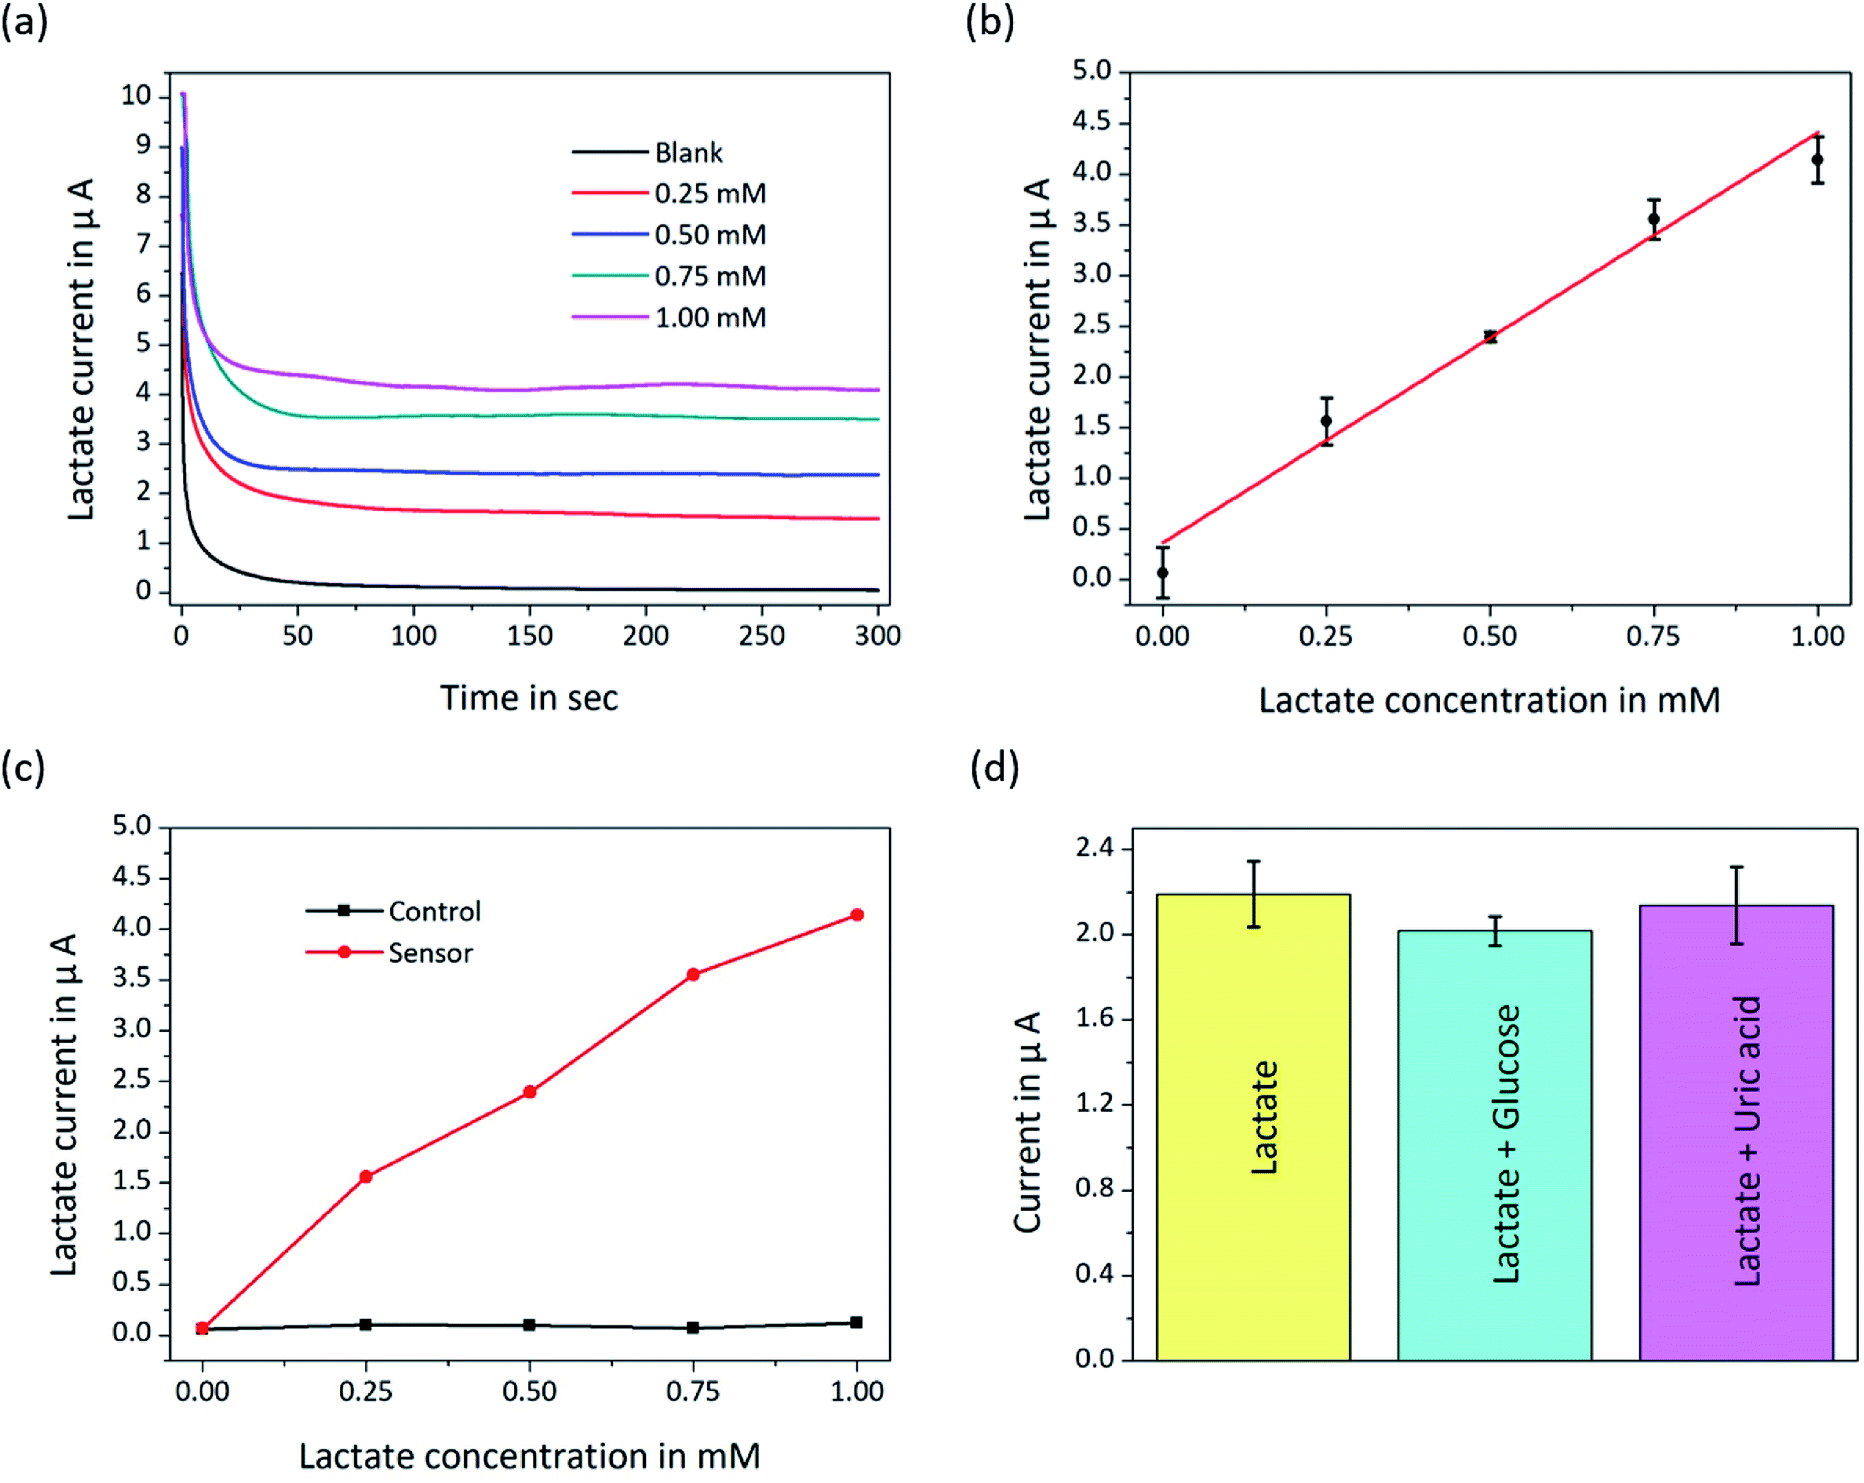 | ||
| Fig. 4 (a) Amperometric i–t curves of the biosensor platform based on the detection of different lactate concentrations. (b) Lactate calibration curve of the biosensor. (c) The data from the working electrode and the blank electrode were measured, which demonstrated the linearity and (d) the selectivity of the biosensor. The concentrations of the samples were 0.43 mM lactate, 0.43 mM lactate and 0.25 mM glucose, and 0.43 mM lactate and 0.1 mM uric acid, respectively. | ||
Fig. 4(a) shows the data of amperometric curves measured in real-time and 5 min for each sample. The sensitivity of the biosensor calculated from the linear fitting of the calibration curve (Fig. 4(b)) was up to 567 nA mM−1 mm−2, which was sufficiently high to explore small concentration variations in the low lactate concentration range. The detection limit (3σ of the raw signal), which depends on the sensitivity of the biosensor, was obtained from the expression and was 4.5 μM. Importantly, the measured results and the combined microchannel and electrode array platform are expected to be further applied to the development of microfluidic biosensors. Although microfluidic biosensors are currently rapidly developing, they are still in the primary stage, and there is much work to be done before they are widely used outside of laboratories.
Biosensor characterization
Sensitivity, selectivity and stability are three important factors for biosensors. We computed the ultra-high sensitivity and low detection limit based on the fitting line (Fig. 4(b)). To remove non-specific impurity signals, the blank signal was subtracted (Fig. 4(c)). Fig. 4(b) and (c) shows that the lactate biosensor had linear characteristics. The selectivity of the biosensor platform was estimated by injecting the prepared impurity samples, such as 0.25 mM glucose and 0.1 mM uric acid, along with 0.43 mM lactate. Standard concentrations of glucose and uric acid were mixed with lactate solution separately and detected by the biosensor platform. As shown in Fig. 4(d), glucose was observed to be the maximum interference for the lactate biosensor, and the coefficient of variation was approximately 4.6% under the same testing conditions. To demonstrate the stability of the lactate biosensor, 0.43 mM lactate solution, as shown in Fig. 4(d), was analysed seven samples by the biosensor, and the variational coefficient of the repeated trials was 6.0 ± 3.0% from the measured data. Table 1 shows the comparison of our biosensor with other lactate biosensors. Gao19 reported the use of Au modified with a thicker Prussian blue layer for lactate measurements to satisfy a wider range, while our work used Pt modified with a thinner Prussian blue layer for higher sensitivity. Electrochemiluminescence biosensors37–39 were reported for lactate detection in a disposable format, but the way of immobilized enzyme made them failed to continuously detect lactate. A comparison of a study conducted by Weltin18 with our study shows that Prussian blue can increase the sensitivity of the biosensor. This indicates that our biosensor indeed has a higher sensitivity and is fully capable of measuring low lactate concentrations in a cellular environment.| Matrix | Technique | Sensitivity | Limit of detection | Prussian blue | Microchannel | Ref. |
|---|---|---|---|---|---|---|
| pHEMA | Electrochemical | 134 nA mm−2 mM−1 | 5–30 μM | No | No | 18 |
| Chitosan | Electrochemical | 31 nA mm−2 mM−1 | — | Yes | No | 19 |
| pHEMA | Electrochemical | 20–34 nA mm−2 mM−1 | — | No | No | 43 |
| No | Electrochemiluminescence | 3.132 μM | No | Paper-based | 37 | |
| No | Electrochemiluminescence | 35 μM | No | Cloth-based | 38 | |
| No | Electrochemical | 0.3169 μA mM-1 | 0.3 mM | No | Cotton fabric-based | 39 |
| pHEMA | Electrochemical | 2.6 nA mm−2 mM−1 | 90 μM | No | Yes | 1 |
| Chitosan | Electrochemical | 567 nA mm−2 mM−1 | 4.5 μM | Yes | Yes | Present work |
Biosensor measurements
To demonstrate the ability of the biosensor array to detect variations in the cell cultures, we used the biosensor to measure lactate in HepG2 cells cultured with medium containing different drug concentrations for the first time. 5-FU40 and VCS41,42 have been widely used as anticancer drugs to treat tumours for many years, and both either prevent or inhibit the process cancer cell division leading to tumour cell apoptosis. Therefore, the amount of lactate decreases due to the reduction in metabolic activity. By using the two drugs in a parallel test, we can better prove the reliability of our biosensors.HepG2 cells were exposed to medium with 5-FU (100 μM or 150 μM) and VCS (10 μg mL−1 or 15 μg mL−1), and the same volume of medium without drugs was used to culture the cells. Lactate production by HepG2 cell metabolism for almost two days was detected by the platform. The untreated control HepG2 cells had an average lactate concentration of 588 ± 58 μM (n = 3). Typically, the drug-treated cells had lower lactate concentrations. Fig. 5 shows that the HepG2 cells treated with 100 μM 5-FU had a concentration of 494 ± 61 μM (n = 3), whereas the cells treated with 150 μM 5-FU had a slightly lower concentration of 407 ± 64 μM (n = 3). Fig. 5(a) shows that lactate production in response to 15 μg mL−1 of VCS (367 ± 59 μM) was greater than that in response to 10 μg mL−1 of VCS (345 ± 67 μM). The experimental results shown in Fig. 5(a) indicate that 10 μg mL−1 of VCS was more effective on liver cancer cells than 15 μg mL−1 VCS.
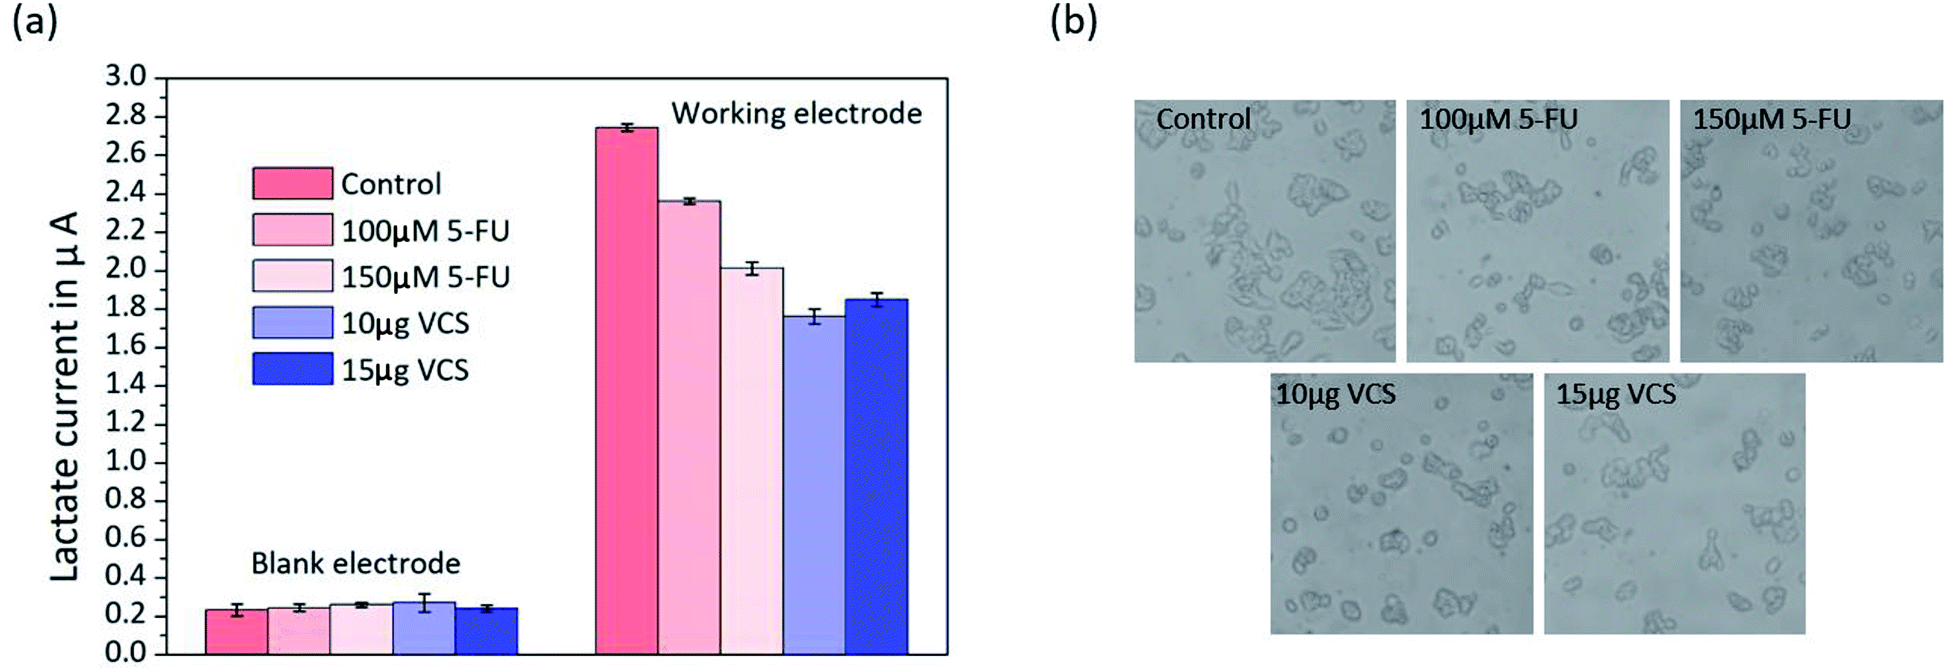 | ||
| Fig. 5 (a) Parallel lactate detection in HepG2 cells in untreated medium compared to cells exposed to 100 μM 5-FU, 150 μM 5-FU, 10 μg mL−1 VCS and 15 μg mL−1 VCS after cultivation for 48 h. (b) Morphology of HepG2 cells untreated medium compared to cells in media treated with 100 μM 5-FU, 150 μM 5-FU, 10 μg mL−1 VCS and 15 μg mL−1 VCS. | ||
Visual observation of the HepG2 cells under a microscope showed morphological changes in the parallel experiments (Fig. 5(b)). There was a distinct change in cellular morphology after exposure to 5-FU and VCS for 24 h compared with the control cells. Obviously, cultured cells with 10 μg mL−1 VCS in the medium became abnormal in shape and grew independently. The morphology of HepG2 cells was in agreement with the results of the lactate measurement shown in Fig. 5(b) according to the relationship between lactate and cell activity as described above. Our biosensor has the ability to accurately detect lactate metabolism in cells and has potential applications in drug screening or toxicology.
Conclusions
In summary, a lactate-sensitive electrochemical biosensor with lactate oxidase, carbon nanotubes, chitosan, Prussian blue, and a Pt electrode was fabricated and calibrated in lactate–PBS solution. Fortunately, the enzyme biosensor showed good sensitivity of 567 nA mM−1 mm−2, low detection limits of 4.5 μM and excellent selectivity for sensing lactate. The platform easily integrated a micro flow system with the biosensor to control the volume at a low level. Our study indicates that biosensors are promising for drug screening by quantifying metabolic low density lactate changes in cultured cells, organ-on-a-chip or microtissue applications.Conflicts of interest
There are no conflicts to declare.Acknowledgements
This study was kindly supported by the Projects of Basic Research of Shenzhen, China (No. JCYJ 20170817162121275).References
- A. Weltin, K. Slotwinski, J. Kieninger, I. Moser, G. Jobst, M. Wego, R. Ehret and G. A. Urban, Lab Chip, 2014, 14, 138–146 RSC.
- R. S. P. Malon, S. Sadir, M. Balakrishnan and E. P. Córcoles, BioMed Res. Int., 2014, 2014, 962903 Search PubMed.
- N. A. Mungroo and S. Neethirajan, Biosensors, 2014, 4, 472–493 CrossRef PubMed.
- E. B. Bahadir and M. K. Sezgintürk, Anal. Biochem., 2015, 478, 107–120 CrossRef CAS PubMed.
- H. C. Hong and H. J. Huang, Anal. Chim. Acta, 2003, 499, 41–46 CrossRef CAS.
- Y. Michotte, M. Moors, D. Deleu, P. Herregodts and G. Ebinger, J. Pharm. Biomed. Anal., 1987, 5, 659–664 CrossRef CAS PubMed.
- D. Wu, Y. Wang, Y. Sun, N. Ouyang and J. Qian, Biomed. Chromatogr., 2015, 29, 1197–1202 CrossRef CAS PubMed.
- M. R. Moghadam, S. Dadfarnia, A. M. H. Shabani and P. Shahbazikhah, Anal. Biochem., 2011, 410, 289–295 CrossRef CAS PubMed.
- B. Habibi, M. Jahanbakhshi and M. H. Pournaghi-Azar, Electrochim. Acta, 2011, 56, 2888–2894 CrossRef CAS.
- L. Cui, J. Wu and H. Ju, Biosens. Bioelectron., 2015, 63, 276–286 CrossRef CAS PubMed.
- W. Li, R. Ouyang, W. Zhang, S. Zhou, Y. Yang, Y. Ji, Y. Yang, K. Feng, X. Liang, M. Xiao and Y. Miao, Electrochim. Acta, 2016, 188, 197–209 CrossRef CAS.
- C. N. Kotanen, C. Tlili and A. Guiseppi-Elie, Appl. Biochem. Biotechnol., 2012, 166, 878–888 CrossRef CAS PubMed.
- C. N. Kotanen, O. Karunwi, F. Alam, C. F. T. Uyehara and A. Guiseppi-Elie, Electrochim. Acta, 2018, 267, 71–79 CrossRef CAS.
- J. Wang, J. Pharm. Biomed. Anal., 1999, 19, 47–53 CrossRef CAS PubMed.
- S. Chen and M. H. Shamsi, J. Micromech. Microeng., 2017, 27, 083001 CrossRef.
- C. Lete, S. Lupu, B. Lakard, J. Y. Hihn and F. J. Del Campo, J. Electroanal. Chem., 2015, 744, 53–61 CrossRef CAS.
- V. D. Neff, J. Electrochem. Soc., 1978, 125, 886 CrossRef CAS.
- A. Weltin, S. Hammer, F. Noor, Y. Kaminski, J. Kieninger and G. A. Urban, Biosens. Bioelectron., 2017, 87, 941–948 CrossRef CAS PubMed.
- W. Gao, S. Emaminejad, H. Y. Y. Nyein, S. Challa, K. Chen, A. Peck, H. M. Fahad, H. Ota, H. Shiraki, D. Kiriya, D. H. Lien, G. A. Brooks, R. W. Davis and A. Javey, Nature, 2016, 529, 509–514 CrossRef CAS PubMed.
- A. A. Karyakin, O. V. Gitelmacher and E. E. Karyakina, Anal. Lett., 1994, 27, 2861–2869 CrossRef CAS.
- A. A. Karyakin, E. E. Karyakina and L. Gorton, Anal. Chem., 2000, 72, 1720–1723 CrossRef CAS PubMed.
- Y. Yao and C. Zhang, Biomed. Microdevices, 2016, 18, 92 CrossRef PubMed.
- W. Guan, M. Liu and C. Zhang, Biosens. Bioelectron., 2016, 75, 247–253 CrossRef CAS PubMed.
- C. Kotanen, O. Karunwi and A. Guiseppi-Elie, Bioengineering, 2014, 1, 85–110 CrossRef CAS PubMed.
- K. Zhou, Y. Zhu, X. Yang, J. Luo, C. Li and S. Luan, Electrochim. Acta, 2010, 55, 3055–3060 CrossRef CAS.
- P. Sorlier, A. Denuzière, C. Viton and A. Domard, Biomacromolecules, 2001, 2, 765–772 CrossRef CAS PubMed.
- M. Satyanarayana, K. Y. Goud, K. K. Reddy and K. V. Gobi, Electrochim. Acta, 2015, 178, 608–616 CrossRef CAS.
- A. Abellán-Llobregat, L. Vidal, R. Rodríguez-Amaro, A. Canals and E. Morallón, Electrochim. Acta, 2018, 285, 284–291 CrossRef.
- M. Satyanarayana, K. K. Reddy and K. V. Gobi, Anal. Methods, 2014, 6, 3772–3778 RSC.
- M. A. Ali, N. Singh, S. Srivastava, V. V. Agrawal, R. John, M. Onoda and B. D. Malhotra, Appl. Biochem. Biotechnol., 2014, 174, 926–935 CrossRef CAS PubMed.
- B. Enderle, A. Weltin, A.-K. Gellner, B. Fritsch, J. Kieninger and G. A. Urban, Biosens. Bioelectron., 2014, 61, 192–199 CrossRef PubMed.
- G. Kroemer and J. Pouyssegur, Cancer Cell, 2008, 13, 472–482 CrossRef CAS PubMed.
- I. Barberis, M. Martini, F. Iavarone and A. Orsi, Journal of Preventive Medicine and Hygiene, 2016, 57, E41–E46 CAS.
- M. Zhang, S. Karra and W. Gorski, Anal. Chem., 2013, 85, 6026–6032 CrossRef CAS PubMed.
- S. Gao, P. J. Zhang, J. H. Guo, H. Chen, H. F. Xu, P. Liu, R. J. Yang and X. Zhu, World J. Gastroenterol., 2015, 21, 10443–10452 CrossRef CAS PubMed.
- G. Kaur, M. Tomar and V. Gupta, Sens. Actuators, B, 2018, 261, 460–466 CrossRef CAS.
- D. Wang, C. Liu, Y. Liang, Y. Su, Q. Shang and C. Zhang, J. Electrochem. Soc., 2018, 165, B361–B369 CrossRef CAS.
- Y. Yao, H. Li, D. Wang, C. Liu and C. Zhang, Analyst, 2017, 142, 3715–3724 RSC.
- R. S. P. Malon, K. Y. Chua, D. H. B. Wicaksono and E. P. Córcoles, Analyst, 2014, 139, 3009–3016 RSC.
- T. Liu, X. Wu, Y. Li, W. Lu, F. Zheng, C. Zhang, Q. Long, H. Qiu, Y. Li, Q. Ge, M. Chen, X. Yu, W. Chen, H. Zhang, W. Huang, M. Luo, W. Deng and L. Li, Cell. Physiol. Biochem., 2018, 46, 1365–1380 CrossRef CAS PubMed.
- Y. Öğünç, M. Demirel, A. Yakar and Z. İncesu, J. Microencapsulation, 2017, 34, 38–46 CrossRef PubMed.
- S. Pyecroft, K. M. Li, A. Frimberger, C. Harmsen, B. de Mello Mattos, D. N. Phalen, A. Moore, S. Lola, S. Peck and A. J. McLachlan, PLoS One, 2013, 8, e65133 CrossRef PubMed.
- A. Weltin, B. Enderle, J. Kieninger and G. A. Urban, IEEE Sens. J., 2014, 14, 3345–3351 CAS.
Footnote |
| † These authors contributed equally to this work. |
| This journal is © The Royal Society of Chemistry 2019 |