 Open Access Article
Sensitive and fast fluorescence-based indirect sensing of TATP†
Shengqiang Fan,
Paul L. Burn * and
Paul E. Shaw
 *
*
Centre for Organic Photonics & Electronics, School of Chemistry and Molecular Biosciences, The University of Queensland, Brisbane, QLD 4072, Australia. E-mail: p.burn2@uq.edu.au; p.shaw3@uq.edu.au
First published on 1st March 2019
Abstract
Sensing of TATP vapours via the decomposition product, hydrogen peroxide, was achieved using a fluorescence “turn-on” mechanism through conversion of boronate esters to phenoxides under basic conditions in solid-state films. High sensitivity was achieved with two new fluorenylboronate esters comprising either 2,4-difluorophenyl or 4-(trifluoromethyl)phenyl substituents. The key to the sensitivity was the fact that the phenoxide anion products from the hydrogen peroxide oxidation absorbed at longer wavelengths than the starting boronate esters. Selective excitation of the phenoxide anions avoided the background fluorescence from the corresponding boronate esters. The use of the electron withdrawing substituents also led to greater photostability. The derivative containing the 4-(trifluoromethyl)phenyl moiety was found to give the most stable phenoxide, and demonstrated fast fluorescence “turn-on” kinetics with a lower limit of detection of ≈2.5 ppb in 60 s.
Organic peroxide-based explosives, such as triacetone triperoxide (TATP), are simple to prepare using commercially-available starting materials,1 and have been used by terrorists in a number of bomb and suicide attacks.2 Such home-made explosives are highly unstable to shock and/or friction and hence a trace detection method that avoids contact with a suspicious package would be advantageous. Non-contact detection of vapours has been widely investigated in the context of nitro-based explosives using fluorescent sensing materials.3–6 Detection of nitro-based analytes using fluorescence relies on the analyte oxidising the excited sensing material and quenching its luminescence.3 However, while the vapour pressures of some organic peroxides, such as TATP, are higher than the nitro-based explosives, due to their relative electrochemical inertness they cannot be detected using fluorescence in combination with photoinduced electron transfer processes. As a consequence, an indirect strategy has been adopted for the detection of organic peroxides which employ UV irradiation,7–9 acidic solutions,10,11 or a solid-state acid12 to decompose TATP vapours to hydrogen peroxide. The advantage of this strategy is that hydrogen peroxide is a strong oxidant and hence offers more options for detection. Fluorescence-based detection of hydrogen peroxide has often been investigated in solution or in biological systems using the conversion of boronate esters to the corresponding phenols/phenoxides by hydrogen peroxide.13,14 However, there have been fewer reports of fluorescence-based sensing of hydrogen peroxide, and hence TATP, in the solid-state.15 In these latter reports, the detection of the hydrogen peroxide occurs by a “turn-on” mechanism, that is, the fluorescence increases in the presence of hydrogen peroxide. It was originally thought that to achieve a high sensitivity the chromophores had to be designed so that the boronate ester was non-luminescent with the oxidised species being luminescent.16 Such a strategy is difficult as many chromophore containing boronate esters are also luminescent. Even if the sensing material is only weakly emissive it still creates sensitivity issues as it is not possible to differentiate between low levels of hydrogen peroxide, and by inference TATP, and the natural background luminescence of the material. In a recent report we recognised that the base used to accelerate the reaction of hydrogen peroxide with the boronate ester also deprotonated the formed phenol.15 While the phenols absorbed light at similar wavelengths to the boronate esters the phenolates were found to absorb at longer wavelengths. Hence, it was determined that fluorescent boronate esters could be used with high signal to noise if the excitation and detection wavelengths were selective towards the phenolate. In the initial report the change in the absorption and emission spectra was found to be dependent on the substituent (H or CN) attached to the parent (9,9-di-n-propyl-9H-fluoren-2-yl)-4,4,5,5-tetramethyl-1,3,2-dioxaborolane (fluorenylboronate ester) chromophore with an electron withdrawing group favouring a red shift in the absorption and photoluminescence.
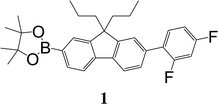
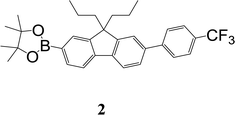
In this manuscript we report the synthesis and sensing properties of two new sensing materials comprised of 2,4-difluorophenyl or 4-trifluoromethylphenyl units that are designed to increase the conjugation length of the chromophore relative to the parent fluorenylboronate ester (Fig. 1). We compare the photophysical properties of the materials and their respective phenols and phenoxides, showing that they can rapidly detect TATP in the solid-state. The lower limit of detection was around ≈2.5 ppb, which is the state-of-the-art for solid-state detection of TATP15 but in this case achieved within 60 seconds and not over the order of minutes.12,16
Results and discussion
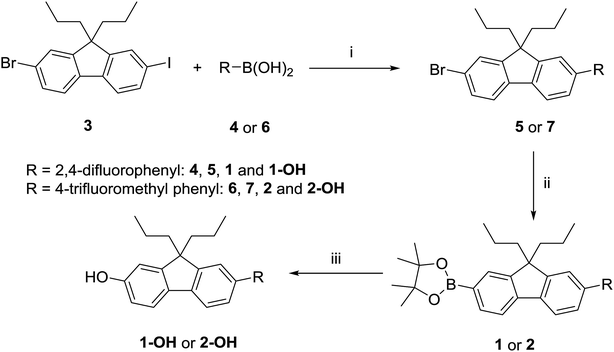
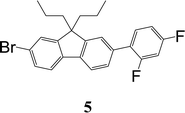
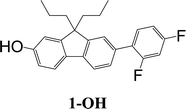
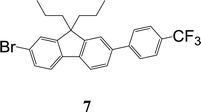
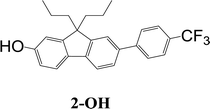
The synthetic strategy to the sensing materials, 2-[7-(2,4-difluorophenyl)-9,9-di-n-propyl-9H-fluoren-2-yl]-4,4,5,5-tetramethyl-1,3,2-dioxaborolane 1 and 2-[9,9-di-n-propyl-7-(4-{trifluoromethyl}phenyl)-9H-fluoren-2-yl]-4,4,5,5-tetramethyl-1,3,2-dioxaborolane 2 is shown in Scheme 1. The first step in both syntheses was the chemoselective Suzuki–Miyaura cross-coupling reaction of 2-bromo-7-iodo-9,9-di-n-propyl-9H-fluorene 3 (ref. 17) with the requisite commercially-available boronic acid (4 or 6) giving the corresponding bromide (5 or 7). Compounds 5 and 7 were isolated in yields of 78% and 90%, respectively. Boronate esters 1 and 2 were then formed under palladium catalysed conditions by reaction with bis(pinacolato)diboron with a yield of 56% in both cases. The phenol derivatives for comparative purposes, 1-OH and 2-OH, were prepared by oxidation using aqueous hydrogen peroxide at room temperature and were formed in isolated yields of 86% and 83%, respectively. The fact that the phenol formation occurs in high yield is important for the success of the hydrogen peroxide sensing. Differential scanning calorimetry (DSC) at a scan rate of 50 °C min−1 showed that on the first scan both 1 and 2 had an endothermic peak at 142 °C and 171 °C, respectively, that corresponded to the melting points of the individual molecules (Fig. S1†). Subsequent heating scans showed that the main thermal transition was a glass transition temperature at 52 °C for 1 and 71 °C for 2 (scan rate of 50 °C min−1). These results suggest that 1 and 2 are predominantly in an amorphous form after melting and relatively rapid cooling. The rapid cooling in the DSC measurement is akin to the solvent evaporation that occurs during solution processing and thus it was expected that the solution processed films used for sensing would be largely amorphous.Photophysical properties
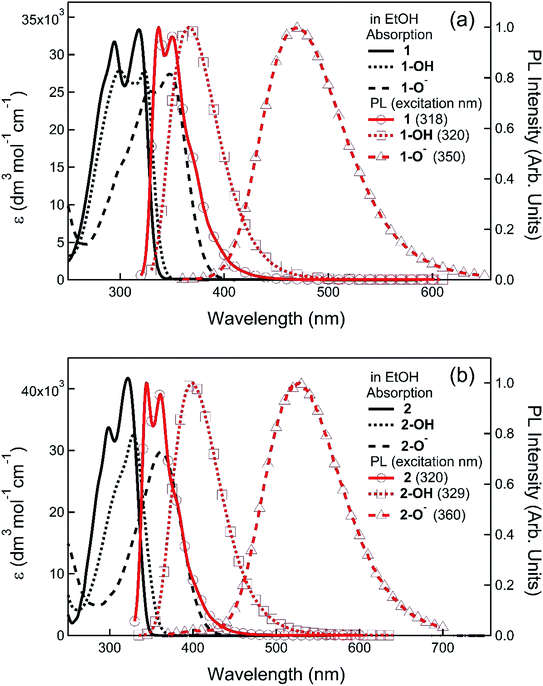
Before determining the efficacy of the compounds 1 and 2 for TATP sensing we characterised their photophysical properties along with the corresponding phenols and phenolates with the spectra shown in Fig. 2 and data summarised in Table 1. The addition of a substituted phenyl group shifted the maxima of the photoluminescence spectra of compounds 1 and 2 to the red (≈30 nm) with respect to the parent fluorenylboronate ester.15 In addition, the solution photoluminescence quantum yields (PLQYs) of 1 and 2 were at least 50% higher than the parent compound with 2 having a PLQY of 76%. The phenols formed from 1 and 2 (1-OH and 2-OH) had similar absorption onsets and PLQYs to the boronate esters although the PL spectra had no phonon structure and were slightly red shifted. However, critically for the usefulness of the materials for sensing, the onset of the absorption spectra of the phenoxy species, 1-O− and 2-O−, were at a significantly longer wavelength compared to either the corresponding boronate ester or phenol. As a consequence, it was possible to selectively excite the phenoxides and measure their PL, which also occurred at a longer wavelength to that of the boronate esters and phenols. Importantly, 1-O− and 2-O− were highly luminescent with PLQYs of 43% and 79%, respectively.Solid-state detection of TATP vapours
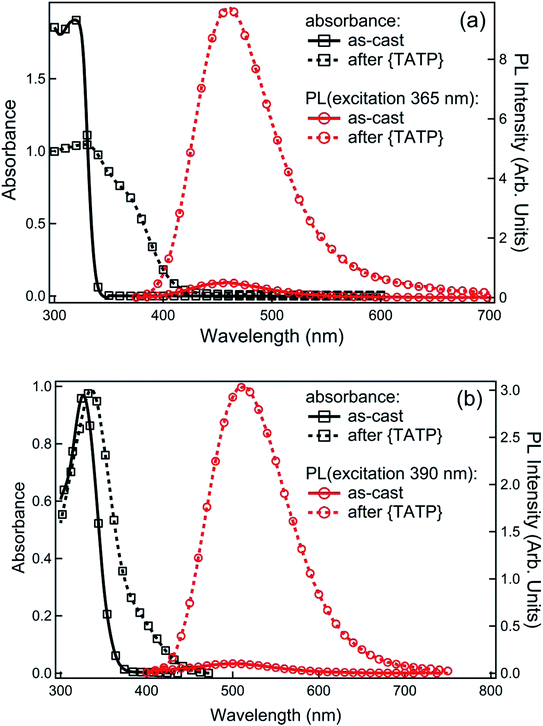
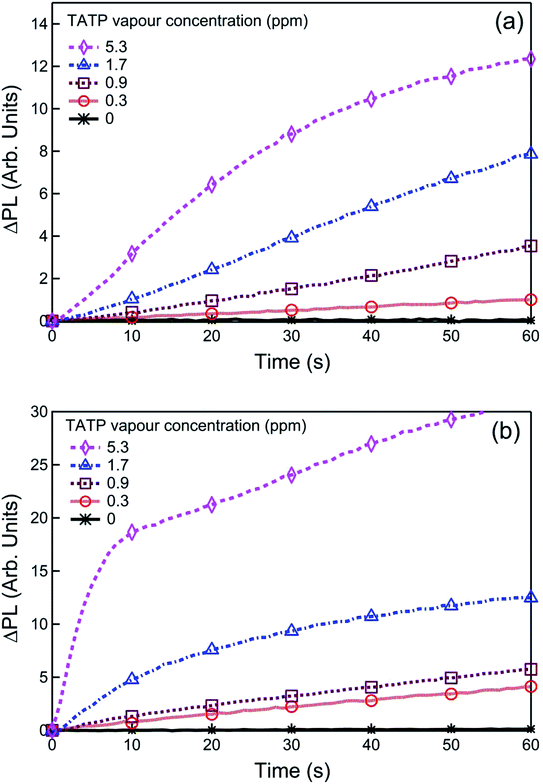
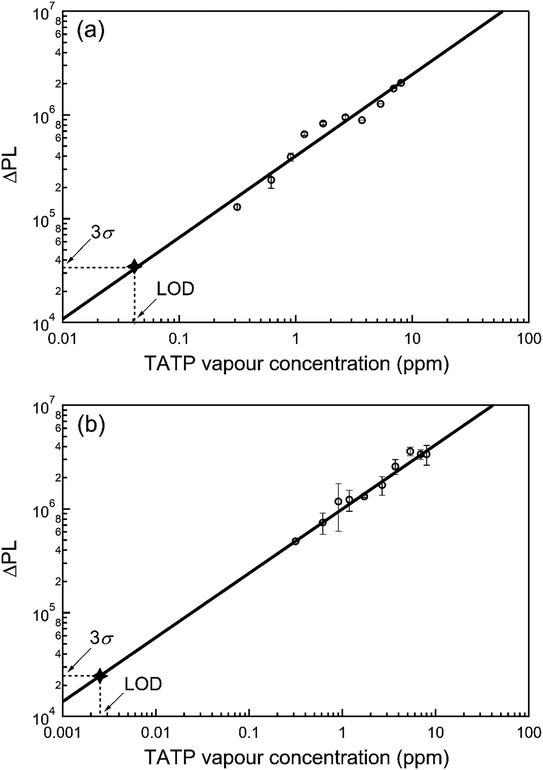
In the next step we determined the ability of 1 and 2 to sense TATP vapours when used in film form. Optical quality films of 1 or 2 blended with tetra-n-butylammonium hydroxide [(n-Bu)4NOH] were formed by drop-casting from ethanol. Fig. 3 shows the absorption spectra for the sensing film blends before and after exposure to the acid-decomposition products of TATP (denoted as {TATP} in the following discussion). In both cases there was an increase in absorption at longer wavelengths, in a similar manner to the solution measurements. On photoexcitation at a wavelength that the boronate ester did not absorb, a substantial increase in the PL signal assigned to the generated phenoxide was observed, indicating the detection of hydrogen peroxide. To prove that the phenoxide was formed we compared the absorption and PL spectra of product formed from reaction of 1 and {TATP} with that of the phenoxide (1-O−) prepared directly from 1-OH. It can be seen in Fig. S2† that the spectra are identical, showing that the boronate esters are converted to the corresponding phenoxides.For infield sensing, it is preferable to continuously illuminate the sensing film and monitor the change in the PL over time. The PL kinetics for sensing films containing 1 or 2 exposed to a range of TATP vapour concentrations are shown in Fig. 4. Each compound shows a clear response to the {TATP} vapour within seconds. The rate of the PL increase was linearly related to the TATP vapour concentration (Fig. 5). The linear relationship between the PL signal and TATP concentration enabled the limit of detection (LOD) to be estimated. By considering the PL intensity change in the first 60 s and comparing with three times the standard deviation (3σ) of the PL change in air, the LOD for films of compounds 1 and 2 were estimated to be ≈40 and ≈2.5 ppb for TATP, respectively. An LOD of 2.5 ppb is an order of magnitude better than that previously reported for a cyanofluorenyl boronate ester.15
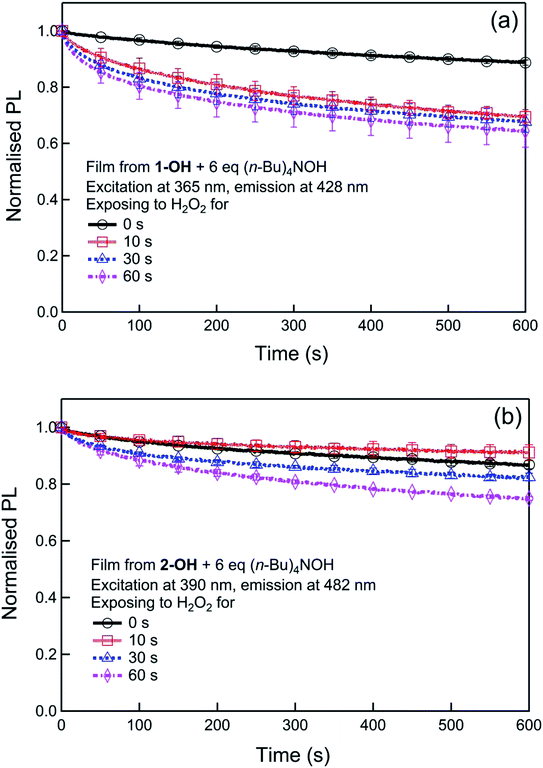
Although generally not discussed, in our previous report we showed that the PL kinetics were dependent on two reactions, that is, the formation of the phenoxide and then its subsequent photodegradation. To understand the effect of the two processes we first followed the formation of the phenoxides in solution using UV-vis absorption kinetics (Fig. S3†) and their subsequent stability (Fig. S4†). From Fig. S3† the t1/2 of the reactions of 1 or 2 with hydrogen peroxide in the presence of (n-Bu)4NOH were determined to be similar at 15 s and 18 s, respectively, and importantly both phenoxides did not appreciably degrade under the same conditions over a 5 minutes period (Fig. S4†). Substantial photodegradation would have led to a reduction in the phenoxide absorption and subsequent PL intensity. To further explore the photodegradation of phenoxides under conditions closer to those that would be used in a detection device, we measured the stability of the phenoxides in thin film form by measuring the change in the PL in the presence and absence of hydrogen peroxide under illumination. The films were formed by blending the phenol 1-OH or 2-OH with (n-Bu)4NOH (6 equiv.) and the results are shown in Fig. 6.
Both phenoxide films show a similar slow photodegradation in air (Fig. 6), which was significantly reduced relative to that reported for the parent boronate ester.15 In order to simulate the detection scenarios where hydrogen peroxide was present, films were also exposed to hydrogen peroxide vapours (221 ppm) for differing exposure times (0–60 seconds) before measuring the PL kinetics under illumination. It can be seen from Fig. 6 that the decrease of the PL of the 1-O− and 2-O− films due to photodegradation increases with increased exposure to hydrogen peroxide. However, in both cases the decrease is less than that of the parent boronate ester15 and slower than the turn-on of the fluorescence during hydrogen peroxide detection. Thus, the addition of the electron withdrawing groups enhances the stability of the materials to photodegradation, which in turn increases the sensitivity of the sensing process as the turn-on signal is not as strongly masked by the turn-off effect of the photodegradation.
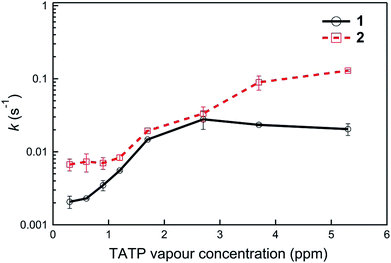
Finally, the fact that the photodegradation processes are significantly slower than the “turn-on” detection of {TATP} enabled us to compare the relative sensing kinetics of the two materials. We therefore compared the rate of change of the sensing kinetics of films of 1 and 2 with the analysis used shown in Fig. S5† and the results summarised in Fig. 7. It can be seen that for all the TATP concentrations tested compound 2 has the greatest rate of PL change, which may be in part due to the greater photostability of 2-O− (Fig. 6).
Conclusions
In summary, we have developed two new small molecule boronate ester-based sensing materials that can be used for the detection of hydrogen peroxide directly generated from the decomposition of TATP vapour. Extending the conjugation length by the addition of substituted phenyl rings red shifted the absorption of photoluminescence spectra relative to the parent boronate ester. Importantly, the use of fluorine or trifluoromethyl substituents on the phenyl ring enhanced the sensing abilities and stabilities of the materials relative to the parent boronate ester. The material with the trifluoromethyl substituted phenyl ring had the greatest photostability and blend thin films with an organic base had a TATP limit of detection of around 2.5 ppb after a 60 second exposure.Experimental
Materials synthesis
All reagents were purchased from commercial sources and were used as received unless otherwise stated. Solvents for chromatography were distilled prior to use. Column chromatography was performed using Davisil LC60A 40–63 micron silica gel. Thin layer chromatography (TLC) was performed using aluminum backed silica gel 60 F254 plates. 1H and 13C NMR were performed using Bruker Avance 400 or 500 MHz spectrometers in deuterated chloroform referenced to 7.26 ppm for 1H and 77.0 ppm for 13C, Fl-H = fluorenyl H; Pr-H = n-propyl H; diFPh-H = 2,4-difluorophenyl H; CF3Ph-H = 4-(trifluoromethyl)phenyl H; BE-H = boronate ester methyl H. Coupling constants are given to the nearest 0.5 Hz. UV-visible spectrophotometry was performed using a Cary 5000 UV-Vis spectrophotometer on either thin films on quartz substrates or in ethanol, with absorbance shoulders denoted as sh. FT-IR spectroscopy was performed on solid samples using a Perkin-Elmer Spectrum 100 FT-IR spectrometer with an ATR attachment. Melting points (MPs) were measured in a glass capillary on a Büchi B-545 melting point apparatus and are uncorrected. Microanalyses were performed using a Carlo Erba NA 1500 Elemental Analyzer. Low resolution electrospray ionisation (ESI) mass spectra were acquired on a Bruker Esquire HCT (High Capacity 3D ion trap) instrument with a Bruker ESI source. Thermal transitions were determined using a Perkin-Elmer Diamond Differential Scanning Calorimeter. Thermal gravimetric analysis was undertaken using a Perkin-Elmer STA 6000 Simultaneous Thermal Analyzer. Thermal decomposition temperatures (T5%) are reported as the temperature corresponding to a 5% mass loss.A mixture of (2,4-difluorophenyl)boronic acid 4 (0.32 g, 2.0 mmol), 2-bromo-7-iodo-9,9-di-n-propyl-9H-fluorene 3 (ref. 17) (1.1 g, 2.4 mmol), aqueous sodium carbonate (2 M, 5 mL), toluene (80 mL) and ethanol (20 mL) was deoxygenated by applying a vacuum and backfilling with argon six times. Then tetrakis(triphenylphosphine)palladium(0) (0.12 g, 0.10 mmol) was added and the reaction vessel was deoxygenated again by applying a vacuum and backfilling with argon six times. The mixture was stirred under argon in an oil bath held at 50 °C for 48 h. After being allowed to cool to room temperature, ethyl acetate (100 mL) and water (100 mL) were added and the organic and aqueous layers separated. The aqueous phase was extracted with ethyl acetate (3 × 50 mL), and the combined organic phases were washed with brine (2 × 100 mL), dried over anhydrous magnesium sulfate, and filtered. The filtrate was collected and the solvent removed. The residue was purified by column chromatography over silica using ethyl acetate
![[thin space (1/6-em)]](https://www.rsc.org/images/entities/char_2009.gif) :
:![[thin space (1/6-em)]](https://www.rsc.org/images/entities/char_2009.gif) petroleum ether (1
petroleum ether (1![[thin space (1/6-em)]](https://www.rsc.org/images/entities/char_2009.gif) :
:![[thin space (1/6-em)]](https://www.rsc.org/images/entities/char_2009.gif) 19) as eluent to afford the product as a white solid (0.69 g, 78%). Mp 102–103 °C. Elemental analysis (%) calcd for C26H24BrF3 C 68.0, H 5.25; found: C 67.8, H 5.3. λmax(dichloromethane)/nm: 285 sh (log
19) as eluent to afford the product as a white solid (0.69 g, 78%). Mp 102–103 °C. Elemental analysis (%) calcd for C26H24BrF3 C 68.0, H 5.25; found: C 67.8, H 5.3. λmax(dichloromethane)/nm: 285 sh (log![[thin space (1/6-em)]](https://www.rsc.org/images/entities/char_2009.gif) ε/dm3 mol−1 cm−1 4.45), 293 (4.50), 317 (4.49). 1H NMR (δ, 400 MHz, CDCl3): 0.67–0.74 (10H, m, Pr-H), 1.90–2.02 (4H, m, Pr-H), 6.91–7.01 (2H, m, diFPh-H), 7.44–7.50 (5H, m, diFPh-H and Fl-H), 7.58 (1H, d, J = 8.0, Fl-H), 7.72 (1H, dd, J = 1.5, J = 7.0, Fl-H). 13C NMR (δ, 100 MHz, CDCl3): 14.4, 17.2, 42.5, 55.7, 104.4 (dd, J = 25.5 & 26.5), 111.5 (dd, J = 4.0 & 21.0), 119.8, 121.1 (6), 121.2 (5), 123.5 (d, J = 3.0), 125.6 (dd, J = 3.5 & 13.0), 126.2, 127.8 (d, J = 2.5), 130.0, 131.4 (dd, J = 5.0 & 9.0), 134.1, 139.6 (d, J = 1), 159.8 (dd, J = 12.0 & 248.5), 162.2 (dd, J = 12.0 & 247.5).
ε/dm3 mol−1 cm−1 4.45), 293 (4.50), 317 (4.49). 1H NMR (δ, 400 MHz, CDCl3): 0.67–0.74 (10H, m, Pr-H), 1.90–2.02 (4H, m, Pr-H), 6.91–7.01 (2H, m, diFPh-H), 7.44–7.50 (5H, m, diFPh-H and Fl-H), 7.58 (1H, d, J = 8.0, Fl-H), 7.72 (1H, dd, J = 1.5, J = 7.0, Fl-H). 13C NMR (δ, 100 MHz, CDCl3): 14.4, 17.2, 42.5, 55.7, 104.4 (dd, J = 25.5 & 26.5), 111.5 (dd, J = 4.0 & 21.0), 119.8, 121.1 (6), 121.2 (5), 123.5 (d, J = 3.0), 125.6 (dd, J = 3.5 & 13.0), 126.2, 127.8 (d, J = 2.5), 130.0, 131.4 (dd, J = 5.0 & 9.0), 134.1, 139.6 (d, J = 1), 159.8 (dd, J = 12.0 & 248.5), 162.2 (dd, J = 12.0 & 247.5).A mixture of 5 (0.59 g, 1.3 mmol), bis(pinacolato)diboron (0.51 mg, 2.0 mmol), potassium acetate (0.39 g, 4.0 mmol), [1,1-bis(diphenylphosphino)ferrocene]palladium(II) dichloride dichloromethane complex (30 mg, 0.04 mmol) and 1,4-dioxane (20 mL) was stirred under argon in an oil bath held at 105 °C for 16 h. The mixture was allowed to cool to room temperature and then the solvent was removed under reduced pressure. Water (50 mL) and dichloromethane (50 mL) were added to the reaction mixture and the organic phase was separated. The aqueous layer was extracted with dichloromethane (3 × 50 mL). The dichloromethane extracts were combined, washed with brine (2 × 50 mL), dried over anhydrous sodium sulfate, and filtered. The filtrate was collected and the solvent removed. The residue was purified by column chromatography over silica using dichloromethane
![[thin space (1/6-em)]](https://www.rsc.org/images/entities/char_2009.gif) :
:![[thin space (1/6-em)]](https://www.rsc.org/images/entities/char_2009.gif) petroleum ether (1
petroleum ether (1![[thin space (1/6-em)]](https://www.rsc.org/images/entities/char_2009.gif) :
:![[thin space (1/6-em)]](https://www.rsc.org/images/entities/char_2009.gif) 3) as eluent to give a white solid (0.36 g, 56%). Mp 142–143 °C; mp (DSC) = 142 °C (first heating scan – scan rate 50 °C min−1). Tg = 52 °C (second heating scan – DSC scan rate 50 °C min−1). T5% = 284 °C (sublimed). Elemental analysis (%) calcd for C31H35BF2O2 C 76.2, H 7.2; found: C 76.2, H 7.3. λmax(dichloromethane)/nm: 286 sh (log
3) as eluent to give a white solid (0.36 g, 56%). Mp 142–143 °C; mp (DSC) = 142 °C (first heating scan – scan rate 50 °C min−1). Tg = 52 °C (second heating scan – DSC scan rate 50 °C min−1). T5% = 284 °C (sublimed). Elemental analysis (%) calcd for C31H35BF2O2 C 76.2, H 7.2; found: C 76.2, H 7.3. λmax(dichloromethane)/nm: 286 sh (log![[thin space (1/6-em)]](https://www.rsc.org/images/entities/char_2009.gif) ε/dm3 mol−1 cm−1 4.40), 295 (4.47), 319 (4.51). λmax(fluorescence) (dichloromethane)/nm: 339, 353, 371 sh. 1H NMR (δ, 500 MHz, CDCl3): 0.65–0.71 (10H, m, Pr-H), 1.39 (12H, s, BE-H), 1.94–2.06 (4H, m, Pr-H), 6.91–7.00 (2H, m, diFPh-H), 7.45–7.50 (3H, m, diFPh-H and Fl-H), 7.72 (1H, dd, J = 0.5, J = 7.5, Fl-H), 7.76–7.78 (2H, m, Fl-H), 7.82 (1H, dd, J = 1.0, J = 7.5, Fl-H). 13C NMR (δ, 100 MHz, CDCl3): 14.4, 17.2, 24.9, 42.5, 55.4, 83.7, 104.4 (dd, J = 25.0, J = 26.5), 111.5 (dd, J = 3.5, J = 21.0), 119.1, 120.1, 123.5 (d, J = 3.0), 125.8 (dd, J = 4.0, J = 13.5), 127.6 (d, J = 2.5), 128.9, 131.5 (dd, J = 5.0, J = 9.0), 133.8, 134.1, 140.5, 143.5, 150.2, 151.6, 159.8 (dd, J = 11.5, J = 249.0), 162.2 (dd, J = 12.0, J = 247.0). m/z [ESI+]: expected 489.3 ([M + H]+), found: 489.1 ([M + H]+).
ε/dm3 mol−1 cm−1 4.40), 295 (4.47), 319 (4.51). λmax(fluorescence) (dichloromethane)/nm: 339, 353, 371 sh. 1H NMR (δ, 500 MHz, CDCl3): 0.65–0.71 (10H, m, Pr-H), 1.39 (12H, s, BE-H), 1.94–2.06 (4H, m, Pr-H), 6.91–7.00 (2H, m, diFPh-H), 7.45–7.50 (3H, m, diFPh-H and Fl-H), 7.72 (1H, dd, J = 0.5, J = 7.5, Fl-H), 7.76–7.78 (2H, m, Fl-H), 7.82 (1H, dd, J = 1.0, J = 7.5, Fl-H). 13C NMR (δ, 100 MHz, CDCl3): 14.4, 17.2, 24.9, 42.5, 55.4, 83.7, 104.4 (dd, J = 25.0, J = 26.5), 111.5 (dd, J = 3.5, J = 21.0), 119.1, 120.1, 123.5 (d, J = 3.0), 125.8 (dd, J = 4.0, J = 13.5), 127.6 (d, J = 2.5), 128.9, 131.5 (dd, J = 5.0, J = 9.0), 133.8, 134.1, 140.5, 143.5, 150.2, 151.6, 159.8 (dd, J = 11.5, J = 249.0), 162.2 (dd, J = 12.0, J = 247.0). m/z [ESI+]: expected 489.3 ([M + H]+), found: 489.1 ([M + H]+).Aqueous hydrogen peroxide (30%, 3 mL) was added to a solution of 1 (75 mg, 0.15 mmol) in N,N-dimethylformamide (10 mL). The mixture was stirred at room temperature for 3 h. Then ethyl acetate (30 mL) was added and the mixture was washed with hydrochloric acid (1 M, 2 × 50 mL) and brine (3 × 30 mL), and then dried over anhydrous sodium sulfate, and filtered. The filtrate was collected and the solvent removed. The residue was purified by column chromatography over silica using dichloromethane as eluent to give a white solid (50 mg, 86%). Mp 170–171 °C. Elemental analysis (%) calcd for C25H24F2O C 79.3, H 6.4; found: C 79.4, H 6.4. IR νmax/cm−1 3281 (OH). λmax(dichloromethane)/nm: 297 (log
![[thin space (1/6-em)]](https://www.rsc.org/images/entities/char_2009.gif) ε/dm3 mol−1 cm−1 4.39), 309 sh (4.33), 322 (4.37). λmax(fluorescence) (dichloromethane)/nm: 356. 1H NMR (δ, 500 MHz, CDCl3): 0.67–0.75 (10H, m, Pr-H), 1.88–2.00 (4H, m, Pr-H), 4.98 (1H, br, OH-H), 6.81 (1H, dd, J = 2.0, J = 8.0, Fl-H), 6.85 (1H, d, J = 1.5, Fl-H), 6.91–6.99 (2H, m, diFPh-H), 7.43–7.49 (3H, m, diFPh-H & Fl-H), 7.58 (1H, d, J = 8, Fl-H), 7.64 (1H, d, J = 8, Fl-H). 13C NMR (δ, 125 MHz, CDCl3): 14.4, 17.2, 42.8, 55.3, 104.3 (dd, J = 26.0, J = 26.0), 110.2, 111.4 (dd, J = 4.0, J = 20.5), 114.1, 118.8, 120.7, 123.3 (d, J = 3.0), 125.9 (dd, J = 4.0, J = 13.5), 127.6 (d, J = 2.5), 131.4 (dd, J = 5.0, J = 9.5), 132.5, 133.7, 140.6, 150.4, 153.5, 155.5, 159.7 (dd, J = 12.0, J = 248.5), 162.0 (dd, J = 11.5, J = 247.0). m/z [ESI−]: expected 377.2 ([M − H]−), found: 377.1 ([M − H]−).
ε/dm3 mol−1 cm−1 4.39), 309 sh (4.33), 322 (4.37). λmax(fluorescence) (dichloromethane)/nm: 356. 1H NMR (δ, 500 MHz, CDCl3): 0.67–0.75 (10H, m, Pr-H), 1.88–2.00 (4H, m, Pr-H), 4.98 (1H, br, OH-H), 6.81 (1H, dd, J = 2.0, J = 8.0, Fl-H), 6.85 (1H, d, J = 1.5, Fl-H), 6.91–6.99 (2H, m, diFPh-H), 7.43–7.49 (3H, m, diFPh-H & Fl-H), 7.58 (1H, d, J = 8, Fl-H), 7.64 (1H, d, J = 8, Fl-H). 13C NMR (δ, 125 MHz, CDCl3): 14.4, 17.2, 42.8, 55.3, 104.3 (dd, J = 26.0, J = 26.0), 110.2, 111.4 (dd, J = 4.0, J = 20.5), 114.1, 118.8, 120.7, 123.3 (d, J = 3.0), 125.9 (dd, J = 4.0, J = 13.5), 127.6 (d, J = 2.5), 131.4 (dd, J = 5.0, J = 9.5), 132.5, 133.7, 140.6, 150.4, 153.5, 155.5, 159.7 (dd, J = 12.0, J = 248.5), 162.0 (dd, J = 11.5, J = 247.0). m/z [ESI−]: expected 377.2 ([M − H]−), found: 377.1 ([M − H]−).A mixture of [4-(trifluoromethyl)phenyl]boronic acid 6 (0.48 g, 2.5 mmol), 2-bromo-7-iodo-9,9-di-n-propyl-9H-fluorene 3 (ref. 17) (1.4 g, 3.0 mmol), aqueous sodium carbonate (2 M, 25 mL), toluene (100 mL), and ethanol (25 mL) was deoxygenated by applying a vacuum and backfilling with argon six times. Then tetrakis(triphenylphosphine)palladium(0) (146 mg, 0.13 mmol) was added and the reaction vessel was deoxygenated again by applying a vacuum and backfilling with argon six times. The mixture was then stirred under argon in an oil bath held at 50 °C for 36 h. After being allowed to cool to room temperature, ethyl acetate (50 mL) and water (50 mL) were added and the organic and aqueous layers were separated. The aqueous phase was extracted with ethyl acetate (3 × 50 mL), and the combined organic phases were washed with brine (2 × 100 mL), dried over anhydrous sodium sulfate, and filtered. The filtrate was collected and the solvent removed. The residue was purified by column chromatography over silica using ethyl acetate
![[thin space (1/6-em)]](https://www.rsc.org/images/entities/char_2009.gif) :
:![[thin space (1/6-em)]](https://www.rsc.org/images/entities/char_2009.gif) petroleum ether (1
petroleum ether (1![[thin space (1/6-em)]](https://www.rsc.org/images/entities/char_2009.gif) :
:![[thin space (1/6-em)]](https://www.rsc.org/images/entities/char_2009.gif) 19) as eluent to afford the product as a white solid (1.1 g, 90%). Mp 141–142 °C. Elemental analysis (%) calcd for C26H24BrF3 C 66.0, H 5.1; found: C 65.9, H 4.9. λmax(dichloromethane)/nm: 288 sh (log
19) as eluent to afford the product as a white solid (1.1 g, 90%). Mp 141–142 °C. Elemental analysis (%) calcd for C26H24BrF3 C 66.0, H 5.1; found: C 65.9, H 4.9. λmax(dichloromethane)/nm: 288 sh (log![[thin space (1/6-em)]](https://www.rsc.org/images/entities/char_2009.gif) ε/dm3 mol−1 cm−1 4.38), 300 (4.48), 321 (4.55). 1H NMR (δ, 400 MHz, CDCl3): 0.68–0.74 (10H, m, Pr-H), 1.93–2.04 (4H, m, Pr-H), 7.48 (1H, dd, J = 2.0, J = 8.0, Fl-H), 7.51 (1H, d, J = 1.5, Fl-H), 7.55 (1H, d, J = 1.0, Fl-H), 7.58 (1H, dd, J = 1.5, J = 8.0, Fl-H), 7.59 (1H, d, J = 8.0, Fl-H), 7.71 and 7.76 (4H, AA′BB′, CF3Ph-H), 7.75 (1H, d, J = 8.0, Fl-H). 13C NMR (δ, 100 MHz, CDCl3): 14.4, 17.2, 42.6, 55.7, 120.2, 121.2, 121.4, 121.6, 124.3 (q, 1JC–F = 270.0), 125.7 (q, 3JC–F = 3.5), 126.3, 126.4, 127.4, 129.3 (q, 2JC–F = 32.5), 130.1, 139.0, 139.4, 140.2, 144.9, 151.3, 153.3.
ε/dm3 mol−1 cm−1 4.38), 300 (4.48), 321 (4.55). 1H NMR (δ, 400 MHz, CDCl3): 0.68–0.74 (10H, m, Pr-H), 1.93–2.04 (4H, m, Pr-H), 7.48 (1H, dd, J = 2.0, J = 8.0, Fl-H), 7.51 (1H, d, J = 1.5, Fl-H), 7.55 (1H, d, J = 1.0, Fl-H), 7.58 (1H, dd, J = 1.5, J = 8.0, Fl-H), 7.59 (1H, d, J = 8.0, Fl-H), 7.71 and 7.76 (4H, AA′BB′, CF3Ph-H), 7.75 (1H, d, J = 8.0, Fl-H). 13C NMR (δ, 100 MHz, CDCl3): 14.4, 17.2, 42.6, 55.7, 120.2, 121.2, 121.4, 121.6, 124.3 (q, 1JC–F = 270.0), 125.7 (q, 3JC–F = 3.5), 126.3, 126.4, 127.4, 129.3 (q, 2JC–F = 32.5), 130.1, 139.0, 139.4, 140.2, 144.9, 151.3, 153.3.A mixture of 7 (0.47 g, 1.0 mmol), bis(pinacolato)diboron (0.38 g, 1.5 mmol), potassium acetate (0.29 g, 3.0 mmol), [1,1-bis(diphenylphosphino)ferrocene]palladium(II) dichloride dichloromethane complex (22 mg, 0.03 mmol) and 1,4-dioxane (10 mL) was deoxygenated and stirred under argon in an oil bath held at 105 °C for 16 h. The mixture was allowed to cool to room temperature and then the solvent removed under reduced pressure. Water (50 mL) and ethyl acetate (50 mL) were added and the organic phase was separated. The aqueous layer was extracted with ethyl acetate (3 × 30 mL). The ethyl acetate extracts were combined, washed with brine (2 × 50 mL), dried over anhydrous sodium sulfate, and filtered. The filtrate was collected and the solvent removed. The residue was purified by column chromatography over silica using dichloromethane
![[thin space (1/6-em)]](https://www.rsc.org/images/entities/char_2009.gif) :
:![[thin space (1/6-em)]](https://www.rsc.org/images/entities/char_2009.gif) petroleum ether (1
petroleum ether (1![[thin space (1/6-em)]](https://www.rsc.org/images/entities/char_2009.gif) :
:![[thin space (1/6-em)]](https://www.rsc.org/images/entities/char_2009.gif) 3) as eluent to give the product as a white solid (0.29 g, 56%). Mp 168–169 °C; mp (DSC) = 171 °C (first heating scan – scan rate 50 °C min−1). Tg = 71 °C (second heating scan – DSC scan rate 50 °C min−1). T5% = 287 °C (sublimed). Elemental analysis (%) cal. For C32H36BF3O2 C, 73.85; H, 7.0. Found: C, 73.7; H, 7.0. λmax(dichloromethane)/nm: 290 sh (log
3) as eluent to give the product as a white solid (0.29 g, 56%). Mp 168–169 °C; mp (DSC) = 171 °C (first heating scan – scan rate 50 °C min−1). Tg = 71 °C (second heating scan – DSC scan rate 50 °C min−1). T5% = 287 °C (sublimed). Elemental analysis (%) cal. For C32H36BF3O2 C, 73.85; H, 7.0. Found: C, 73.7; H, 7.0. λmax(dichloromethane)/nm: 290 sh (log![[thin space (1/6-em)]](https://www.rsc.org/images/entities/char_2009.gif) ε/dm3 mol−1 cm−1 4.39), 300 (4.49), 323 (4.60). λmax(fluorescence) (dichloromethane)/nm: 350, 365, 383 sh. 1H NMR (δ, 500 MHz, CDCl3): 0.67–0.70 (10H, m, Pr-H), 1.40 (12H, s, BE-H), 1.97–2.08 (4H, m, Pr-H), 7.56 (1H, brm, Fl-H), 7.58 (1H, dd, J = 1.5, J = 8.0, Fl-H), 7.71 and 7.76 (4H, AA′BB′, CF3Ph-H), 7.73 (1H, d, J = 8.0, Fl-H), 7.78 (1H, s, Fl-H), 7.80 (1H, d, J = 7.5, Fl-H), 7.83 (1H, d, J = 7, Fl-H). 13C NMR (δ, 100 MHz, CDCl3): 14.4, 17.2, 24.9, 42.6, 55.5, 83.8, 119.2, 120.5, 121.7, 124.3 (q, 1JC–F = 270.2), 125.7 (q, 3JC–F = 3.6), 126.1, 127.5, 128.9, 129.1 (q, 2JC–F = 31.4), 133.9, 139.0, 141.1, 143.3, 145.1, 150.2, 152.2. m/z [ESI+]: expected 521.3 ([M + H]+), found: 521.1 ([M + H]+).
ε/dm3 mol−1 cm−1 4.39), 300 (4.49), 323 (4.60). λmax(fluorescence) (dichloromethane)/nm: 350, 365, 383 sh. 1H NMR (δ, 500 MHz, CDCl3): 0.67–0.70 (10H, m, Pr-H), 1.40 (12H, s, BE-H), 1.97–2.08 (4H, m, Pr-H), 7.56 (1H, brm, Fl-H), 7.58 (1H, dd, J = 1.5, J = 8.0, Fl-H), 7.71 and 7.76 (4H, AA′BB′, CF3Ph-H), 7.73 (1H, d, J = 8.0, Fl-H), 7.78 (1H, s, Fl-H), 7.80 (1H, d, J = 7.5, Fl-H), 7.83 (1H, d, J = 7, Fl-H). 13C NMR (δ, 100 MHz, CDCl3): 14.4, 17.2, 24.9, 42.6, 55.5, 83.8, 119.2, 120.5, 121.7, 124.3 (q, 1JC–F = 270.2), 125.7 (q, 3JC–F = 3.6), 126.1, 127.5, 128.9, 129.1 (q, 2JC–F = 31.4), 133.9, 139.0, 141.1, 143.3, 145.1, 150.2, 152.2. m/z [ESI+]: expected 521.3 ([M + H]+), found: 521.1 ([M + H]+).Aqueous hydrogen peroxide (30%, 3 mL) was added to a solution of 2 (61 mg, 0.12 mmol) in N,N-dimethylformamide (10 mL). The mixture was stirred at room temperature for 3 h before ethyl acetate (30 mL) was added. The mixture was washed with hydrochloric acid (1 M, 2 × 50 mL) and brine (3 × 30 mL), then dried over anhydrous sodium sulfate and filtered. The filtrate was collected and the solvent removed. The residue was purified by column chromatography over silica using dichloromethane as eluent to give the product as a white solid (40 mg, 83%). Mp 168–169 °C. Elemental analysis (%) calcd for C26H25F3O C 76.1, H 6.1. Found: C 76.1, H 6.1. IR νmax/cm−1 3277 (OH). λmax(dichloromethane)/nm: 310 sh (log
![[thin space (1/6-em)]](https://www.rsc.org/images/entities/char_2009.gif) ε/dm3 mol−1 cm−1 4.43), 326 (4.52). λmax(fluorescence) (dichloromethane)/nm: 385. 1H NMR (δ, 500 MHz, CDCl3): 0.66–0.75 (10H, m, Pr-H), 1.90–2.02 (4H, m, Pr-H), 4.80 (1H, br, OH), 6.82 (1H, dd, J = 2.0, J = 8.0, Fl-H), 6.85 (1H, d, J = 2.0, Fl-H), 7.51–7.52 (1H, brm, Fl-H), 7.54 (1H, dd, J = 1.5, J = 8.0, Fl-H), 7.58 (1H, d, J = 8.0, Fl-H), 7.67 (1H, d, J = 8.0, Fl-H), 7.70 and 7.75 (4H, AA′BB′, CF3Ph-H). 13C NMR (δ, 100 MHz, CDCl3): 14.4, 17.2, 42.9, 55.4, 110.2, 114.1, 119.2, 120.9, 121.4, 124.4 (q, 1JC–F = 216), 125.6 (q, 3JC–F = 3), 126.1, 127.3, 128.9 (q, 2JC–F = 26), 133.6, 137.4, 141.2, 145.2, 151.0, 153.5, 155.6. m/z [ESI−]: expected 409.2 ([M − H]−), found: 409.3 ([M − H]−).
ε/dm3 mol−1 cm−1 4.43), 326 (4.52). λmax(fluorescence) (dichloromethane)/nm: 385. 1H NMR (δ, 500 MHz, CDCl3): 0.66–0.75 (10H, m, Pr-H), 1.90–2.02 (4H, m, Pr-H), 4.80 (1H, br, OH), 6.82 (1H, dd, J = 2.0, J = 8.0, Fl-H), 6.85 (1H, d, J = 2.0, Fl-H), 7.51–7.52 (1H, brm, Fl-H), 7.54 (1H, dd, J = 1.5, J = 8.0, Fl-H), 7.58 (1H, d, J = 8.0, Fl-H), 7.67 (1H, d, J = 8.0, Fl-H), 7.70 and 7.75 (4H, AA′BB′, CF3Ph-H). 13C NMR (δ, 100 MHz, CDCl3): 14.4, 17.2, 42.9, 55.4, 110.2, 114.1, 119.2, 120.9, 121.4, 124.4 (q, 1JC–F = 216), 125.6 (q, 3JC–F = 3), 126.1, 127.3, 128.9 (q, 2JC–F = 26), 133.6, 137.4, 141.2, 145.2, 151.0, 153.5, 155.6. m/z [ESI−]: expected 409.2 ([M − H]−), found: 409.3 ([M − H]−).Vapour generation
TATP vapour was generated using a previously reported setup.15 TATP powder (200 mg) was mixed with sand (10.5 g) and then placed into a glass tube (∅0.5 cm × 20 cm). The glass tube was connected to a mass flow controller (MFC) at one end and to a Teflon tube (∅2 mm × 20 mm) filled with Amberlyst-15 solid-state acid at the other. The Amberlyst-15 was used to decompose the TATP into hydrogen peroxide and acetone. A second MFC was employed for dilution. Nitrogen was used as both the carrier and dilution gas. The temperature at which the experiments were carried out was 20 ± 1 °C. The TATP vapour pressure was estimated from the Clausius–Clapeyron equation, log10![[thin space (1/6-em)]](https://www.rsc.org/images/entities/char_2009.gif) P = 19.791 − 5708/T, where P is vapour pressure (pascal) and T is temperature (kelvin).18 The TATP vapour concentration was calculated from the dilution factor. The PL response without hydrogen peroxide input was tested in air, rather than in nitrogen, in order to predict the LOD that would be expected under real world usage conditions.
P = 19.791 − 5708/T, where P is vapour pressure (pascal) and T is temperature (kelvin).18 The TATP vapour concentration was calculated from the dilution factor. The PL response without hydrogen peroxide input was tested in air, rather than in nitrogen, in order to predict the LOD that would be expected under real world usage conditions.
Film preparation
Films were prepared on planar fused silica substrates by drop-casting from solution. The typical solution comprised 2 mg of boronate ester sensing material and, tetra-n-butylammonium hydroxide (6 equiv.) in ethanol (0.20 mL). The solutions comprising of 1 or 2 were stirred at room temperature in a 1 mL-vial for 10 min before use. The coatings were fabricated by drop-casting the solution on the substrate at a loading amount of 5 μL cm−2 and then drying under a nitrogen stream for 5 min followed by placing in a vacuum for 10 min.Photophysical measurements
Solution photoluminescence spectra and intensity were recorded on an Horiba Jobin-Yvon Fluoromax 4. Solution photoluminescence quantum yields (PLQYs) were measured by a relative method using quinine sulfate in 0.5 M sulfuric acid, which has a PLQY of 0.55, as a standard.19Sensing measurements
The sensing film samples on fused silica substrates were mounted in a sample cell in a fluorometer (Jobin-Yvon Fluorolog 3). The sample cell possessed three optical windows to allow for excitation of the films and subsequent detection of the film PL at right angles to the excitation. The gas mixture containing diluted {TATP} was directed onto the sample at a flow rate of 500–1000 mL min−1, controlled using two MFCs. Film PL spectra before and after exposure to {TATP} were recorded. The PL kinetics at the emissive peak were measured with an excitation wavelength at the absorption peak of the corresponding phenoxides.Conflicts of interest
There are no conflicts of interest to declare.Acknowledgements
PES is supported by an Advance Queensland Research Fellowship. PLB is an Australian Research Council Laureate Fellow (FL160100067). This research was supported by funding from the Australian Research Council under the Discovery Program (DP130102422).References
- J. J. Sabatini and K. D. Oyler, Crystals, 2016, 6, 5 CrossRef.
- National Academies of Sciences, Engineering, and Medicine, Reducing the Threat of Improvised Explosive Device Attacks by Restricting Access to Explosive Precursor Chemicals, The National Academies Press, Washington, 2018, DOI:10.17226/24862.
- P. E. Shaw and P. L. Burn, Phys. Chem. Chem. Phys., 2017, 19, 29714–29730 RSC.
- X. Sun, Y. Wang and Y. Lei, Chem. Soc. Rev., 2015, 44, 8019–8061 RSC.
- Y. Salinas, R. Martinez-Manez, M. D. Marcos, F. Sancenon, A. M. Costero, M. Parra and S. Gil, Chem. Soc. Rev., 2012, 41, 1261–1296 RSC.
- S. W. Thomas, G. D. Joly and T. M. Swager, Chem. Rev., 2007, 107, 1339–1386 CrossRef CAS PubMed.
- R. Schulte-Ladbeck, P. Kolla and U. Karst, Analyst, 2002, 127, 1152–1154 RSC.
- R. Schulte-Ladbeck, P. Kolla and U. Karst, Anal. Chem., 2003, 75, 731–735 CrossRef CAS PubMed.
- S. Malashikhin and N. S. Finney, J. Am. Chem. Soc., 2008, 130, 12846–12847 CrossRef CAS PubMed.
- S. Girotti, E. Ferri, E. Maiolini, L. Bolelli, M. D'Elia, D. Coppe and F. S. Romolo, Anal. Bioanal. Chem., 2011, 400, 313–320 CrossRef CAS PubMed.
- J. Chen, W. Wu and A. J. McNeil, Chem. Commun., 2012, 48, 7310–7312 RSC.
- H. Lin and K. S. Suslick, J. Am. Chem. Soc., 2010, 132, 15519–15521 CrossRef CAS PubMed.
- J. Chan, S. C. Dodani and C. J. Chang, Nat. Chem., 2012, 4, 973–984 CrossRef CAS PubMed.
- X. Chen, F. Wang, J. Y. Hyun, T. Wei, J. Qiang, X. Ren, I. Shin and J. Yoon, Chem. Soc. Rev., 2016, 45, 2976–3016 RSC.
- S. Fan, J. Lai, P. L. Burn and P. E. Shaw, ACS Sens., 2019, 4, 134–142 CrossRef CAS PubMed.
- M. Xu, J.-M. Han, Y. Zhang, X. Yang and L. Zang, Chem. Commun., 2013, 49, 11779–11781 RSC.
- A. Liedtke, M. O'Neill, A. Wertmöller, S. P. Kitney and S. M. Kelly, Chem. Mater., 2008, 20, 3579–3586 CrossRef CAS.
- J. C. Oxley, J. L. Smith, K. Shinde and J. Moran, Propellants, Explos., Pyrotech., 2005, 30, 127–130 CrossRef CAS.
- J. N. Demas and G. A. J. Crosby, J. Phys. Chem., 1971, 75, 991–1024 CrossRef.
Footnote |
| † Electronic supplementary information (ESI) available. See DOI: 10.1039/c9ra00693a |
| This journal is © The Royal Society of Chemistry 2019 |


