 Open Access Article
Mulberry-like heterostructure (Fe–O–Ti): a novel sensing material for ethanol gas sensors†
Min Li,
Jianxing Shen *,
Chuanbing Cheng,
Tailin Wang,
Yan Shen,
Shuai Wang and
Pan Chen
Key Laboratory of Processing and Testing Technology of Glass & Functional Ceramics of Shandong Province, Qilu University of Technology (Shandong Academy of Sciences), Jinan 250353, PR China. E-mail: sjx@qlu.edu.cn; Tel: +86-531-89631225
First published on 19th March 2019
Abstract
The gas sensors have been widely used in various fields, to protect the safety of life and property. A novel heterostructure of Fe–O–Ti nanoparticles is fabricated by hydrothermal and wet chemical deposition methods. The Fe–O–Ti nanoparticles with a large number of pores possess high surface area, which is in favour of high-performance gas sensors. Compared with pure Fe2O3 and TiO2, the Fe–O–Ti composite exhibits obviously enhanced sensing characteristics, such as faster response–recovery time (Tres = 6 s, Trec = 48 s), higher sensing response (response = 35.6) and better selectivity. The results show that the special morphology and large specific surface area of mulberry-like Fe–O–Ti heterostructures provided a large contact area for gas reactions.
1. Introduction
Gas sensors are used for detection of inflammable gas and toxic chemicals, testing of air quality and environmental pollution.1–3 Over the past decades, various gas sensors, for example metal oxide gas sensors,4,5 graphene-based gas sensors,6,7 organic compounds gas sensors8,9 and solid electrolyte sensors,10,11 have been extensively explored. Among them, metal oxide semiconductor sensors draw special attention due to their large specific surface area,12 flexible surface functional modification13,14 and simple preparation process. The types of charge carriers in gas sensing materials and the properties of gas molecules (for instance reductive or oxidative atmosphere) are also one of the factors for the resistance change.As self-sacrificing templates, metal–organic frameworks (MOFs) have been extensively used in the preparation of porous metal nanomaterials.15 Due to the large specific surface area and high porosity, MOF-based materials have been widely used in catalysis, energy, chemical sensors and gas storage.16 Furthermore, sets of functional derivatives could be synthesized controllably because of the tunable size and morphology of MOF precursors. Porous nanorod α-Fe2O3 nanostructures were fabricated by a two steps strategy (hydrothermal method for MOF precursors and calcination for Fe2O3), exhibiting an enhanced volatile organic compounds (VOCs) gas sensing property.16 In addition, some other porous materials, such as sandwich-like heterostructure of TiO2 nanosheet,17 the large-scale NiO nano/micro materials18 and ZnO nanowires,19 also have been synthesized by calcination of the MOF precursors, which show excellent performances in lithium batteries20,21 and gas sensors.
In spite of a series of metal oxide material with tunable sizes and morphologies have been fabricated, the development of metal oxide with multi-advantages is still a great challenge. To address this drawback, a controllable synthetic strategy with MOFs precursor is adopted. Gao16 et al. prepared α-Fe2O3 nanorod by MOF-template controlled gas sensor and its response to 100 ppm ethanol was about 6.5, and Daniel51 et al. synthesized Au/ε-Fe2O3 as monitoring NO2 gas sensors. In view of the shortcomings of low sensitivity of raw materials, this paper reported a new type of heterojunction and improved the gas sensitivity.
In this paper, an effective two-step hydrothermal method route to synthesize Fe2O3–TiO2 (termed as Fe–O–Ti) heterostructures with excellent sensing performances was reported. The ethanol sensing properties of Fe–O–Ti heterostructures and single phase Fe2O3 were investigated. The sensors based on Fe–O–Ti heterostructures exhibit higher response value, better selectivity to low concentration ethanol at 300 °C, compared with pure Fe2O3 sensors. Moreover, the response-time and recovery-time for the sensors is also shorter than the pure one. The excellent sensing performances mainly resulted from the unique heterostructures of Fe–O–Ti nanoparticles.
2. Experimental
2.1 Synthesis of Fe–O–Ti nanoparticles
To obtain the MOF precursors, 1.06 g of FeCl3·6H2O and 0.86 g of 1,4-benzenedicarboxylic acid were added into 54 mL N,N-dimethyl formamide. After stirring for 30 minutes, 5 mL 0.4 M NaOH was added, vigorous stirred for another 10 minutes. And then, the mixture solution was transferred into Teflon-lined stainless autoclaves sealed and heated at 100 °C for 24 h. After cooling to room temperature, the samples were centrifuged (12![[thin space (1/6-em)]](https://www.rsc.org/images/entities/char_2009.gif) 000 rpm), washed with deionized water (DI water) and ethanol for 5 times, and dried overnight at 50 °C.
000 rpm), washed with deionized water (DI water) and ethanol for 5 times, and dried overnight at 50 °C.
The as-prepared MOFs precursor, 0.15 mL NH3·H2O and 0.28 mL tetrabutyl titanate were dissolved in 50 mL ethanol and stirred vigorously. The mixed solution was stewing at 55 °C for 12 h. Then the product was vacuum filtration and washed with DI water and ethanol several times and dried at 70 °C for 8 hours. Finally, these precursor were heated at 500 °C for 4 h in tube furnace with N2 protection and then heated at 600 °C in muffle furnace to obtain uniform Fe–O–Ti nanoparticles. Similarly, single component of Fe2O3 were prepared by annealing Fe-MOF precursor at 600 °C (Fig. 1).
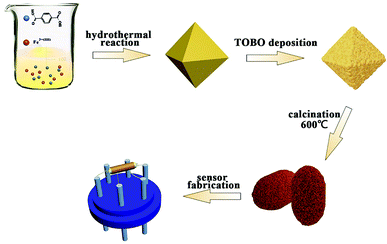 | ||
| Fig. 1 Schematic diagram of synthesis process for Fe–O–Ti heterogeneous nanostructure and gas sensor. | ||
2.2 Sensor fabrication and measurements
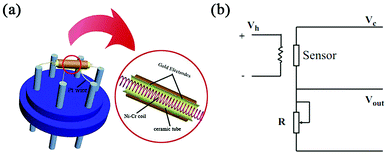
The material was ground uniformly with water and coated on the alumina ceramic tube as a sensing layer, drying at room temperature about 24 h. The nickel–chromium heating wire passes through the ceramic tube. And the Pt wire and the heating wire are welded on the six feet of the sensor base respectively to form the indirect heating gas sensor. The working temperature of the sensor is changed by controlling the heating voltage. To get more stable performance, the sensors was stayed at 5 V for 7 days. The circuit diagram of the sensor is shown in Fig. 2. WS-30A is used as the sensor detection device, and the input voltage (Vh) is 5 V. The testing process is as follows: the sensor is placed in the glass chamber with the test board, and the liquid or gas is injected into the glass chamber. After the response value is stable, the glass cover is removed and the sensor is recovered in the air. If the target gas is obtained from the liquid, the following formula (eqn (1)) is used for calculation.22 Sensor response (S) was defined as the ratio of Ra/Rg, where Ra and Rg refer to the sensor resistances in air and in target atmosphere respectively.
 | (1) |
2.3 Characterization
The morphology of the product was observed by scanning electron microscopy (SEM, ZEISS GeminiSem 500, on 20.0 kV). The elemental valence was confirmed by X-ray photoelectron spectroscopy (XPS, Thermo ESCALAB 250XI). The sample morphology was examined by transmission electron microscopy (TEM) and the images were taken by a FEI Tecnai G2 F20 transmission electron microscope. X-ray diffractometer (Rigaku RINT-2500) was used to determine the crystal structure of iron oxides. The specific surface area analysis was performed in Brunauer–Emmett–Teller (BET) method, by using Tristar3020 system.3. Results and discussion
3.1 Composition and microstructure
To demonstrate phase composition and the crystallographic structure of the materials, the samples were measured by X-ray diffractometer. Fig. 3 compares the XRD patterns of precursor, FeTiO3 and Fe–O–Ti. As show in Fig. 3c, a series of enhanced diffraction peaks at 27.5°, 36.1°, 39.2°, 41.2°, 44.0°, 54.3°, 56.6°, 62.7°, 64.0°, 65.5° and 69.0° are observed, which are assigned to (110), (101), (200), (111), (210), (211), (220), (002), (310), (221) and (301) crystal planes of TiO2 (JCPDS no. 01-1292) respectively. The ε-Fe2O3 (JCPDS no. 16-0653) exhibits three diffraction peaks at 32.8°, 36.5°, and 60.2°, which are same as previous report, indicating the co-existence of Fe2O3 and TiO2 in the Fe–O–Ti heterostructures nanoparticles.24,25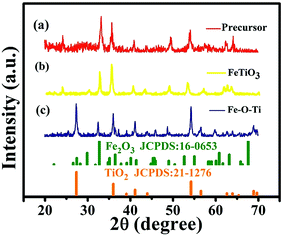 | ||
| Fig. 3 XRD pattern of (a) precursor, (b) FeTiO3, and (c) Fe–O–Ti heterostructures nanoparticles, respectively. | ||
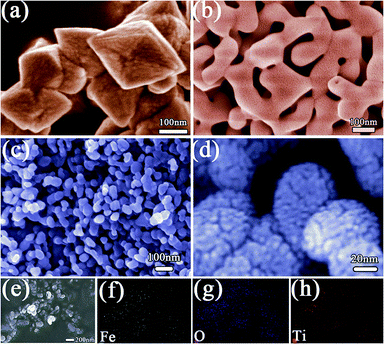
In order to observe the microstructures of the materials, SEM tests are carried out. The SEM image (Fig. 4a) show that the MOFs precursor have a typical morphology of octahedron with an average size about 200–300 nm. As can be seen from Fig. 4b, the sample obtained at 600 °C shows a regular morphology with uniformly distributed network structure. Fig. 4c and d show low- and high-magnification SEM images of Fe–O–Ti heterostructures nanoparticles. It can be observed that the Fe–O–Ti heterostructures turned into ellipsoidal nanoparticles with a typical length of ∼100 nm and a diameter of ∼50 nm after the calculating at 600 °C, which distributed uniformly and were independent with each other. The mulberry-like branches grew radially to form the heterostructure on the surface of the nanoparticles, which greatly increased the surface area of the nanoparticles. The higher surface area is conducive to the full contact of the air with the particle surface, which could increase the gas sensitivity rapidly. The composition of the Fe–O–Ti heterostructure nanoparticles were characterized by energy dispersive X-ray spectroscopic (EDS) elemental mapping. As shown in Fig. 4e–h, the Fe–O–Ti heterostructure nanoparticles are mainly composed of Fe, O, Ti, and all elements are dispersed uniformly throughout the nanoparticles.
TEM and high resolution TEM (HRTEM) were performed to characterize the internal structure of Fe–O–Ti heterostructure nanoparticles. The Fe–O–Ti heterostructure nanoparticles (Fig. 5a) have a clear ellipsoidal internal structure with a typical length of around 100 nm and in a diameter of about 50 nm, which is in accordance with the SEM results. As shown in Fig. 5b, the measured lattice fringe with interplanar spacing of 0.403 nm and 0.331 nm can be attributed to the (220) plane of the rhombohedral Fe2O3 and the (110) planes of TiO2, respectively, indicating that the Fe–O–Ti are composed of Fe2O3 and TiO2 heterostructure. Furthermore, the lattice fringe line is painted by the black imaginary line, which show that there are good connection between TiO2 and Fe2O3 in the nanoparticles, confirming that the Fe–O–Ti heterostructures are not a simple mixture of phases.
 | ||
| Fig. 5 (a) TEM image of Fe–O–Ti heterostructure nanoparticles (b) HRTEM image of Fe–O–Ti heterostructure nanoparticles. | ||
The chemical composition and surface structure of Fe–O–Ti heterostructure nanoparticles was further measured by the XPS. The XPS spectrum of Fe–O–Ti heterostructure nanoparticles in Fig. 6a suggests that the elements O, Fe and Ti were existed in Fe–O–Ti heterostructure nanoparticles.26,27 The binding energies at 710.45 and 724.10 eV respectively correspond to Fe 2p3/2 and Fe 2p1/2 (Fig. 5b).28,29 XPS spectrum of O 1s spectrum can be divided into peaks situated at 529.74 eV and 531.27 eV (Fig. 6c), which are largely caused by oxygen in the crystal lattice, that is oxygen atoms that are bound to titanium (Ti–O) and iron (Fe–O)30 and also attributed to the bulk oxygen (O2−) and surface adsorbed oxygen.31 The high-resolution XPS of Ti 2p spectrum shows that the binding energies of Ti 2p3/2 and Ti 2p1/2 (Fig. 6d) were located at 458.66 and 463.8 eV, which fitted well with the binding energy of TiO2.32–34 The result of XPS analysis further demonstrates that preparation of the Fe–O–Ti nanoparticles is the success.
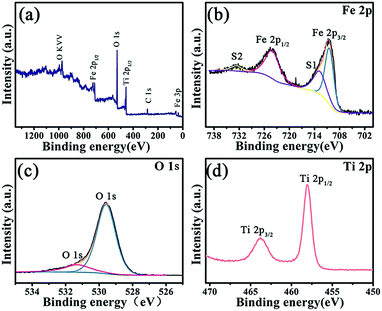 | ||
| Fig. 6 XPS spectra of Fe–O–Ti heterostructure nanoparticle: (a) full spectrum; (b) Fe 2p; (c) O 1s; (d) Ti 2p. | ||
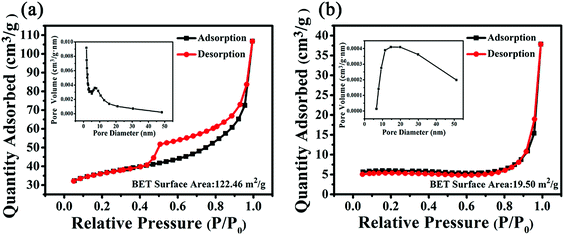
The pore size dispersion and specific surface areas were measured by N2 adsorption/desorption isotherms. Fig. 7a showed that the Brunauer–Emmett–Teller (BET) surface area of Fe–O–Ti heterostructures nanoparticles was 122.46 m2 g−1. The isotherm of Fe–O–Ti heterostructures showed a typical type IV isotherm.35,36 Mesopores and micropores structures can be analyzed in Fig. 7a. Due to the previous period relatively flat and rise faster at the relative pressure was 0.45, so it could make for gas diffusion and gas transport in applications of sensor. The pore size distribution curve of Fe–O–Ti nanoparticles was revealed in the inset of Fig. 7a. As the pore aperture is relatively wide in the range of 5–10 nm, it suggested that the proportion of mesoporous volume to the total aperture is in greater proportion, mesopore structure is one of the most reasons for large surface area.37 In contrast, the BET and pore-size distribution of the nonporous nanoparticles is displayed in Fig. 7b. The specific surface areas of Fe–O–Ti heterostructures nanoparticles (122.46 m2 g−1) is larger than that of the solid Fe2O3 nanoparticles (19.50 m2 g−1), which could allow them to absorb more gas molecules and improve sensing capability.
3.2 Gas-sensing properties
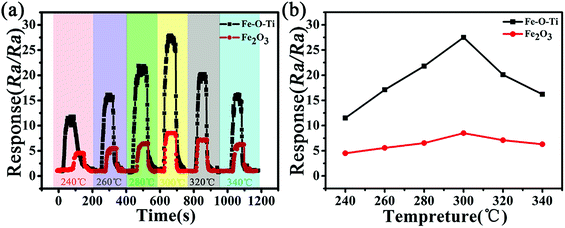
Gas sensor conduction was evaluated by the variation of the conductance of the sensing material (humidity of 20–24%). Gas sensing was greatly influenced by the operating temperature, in other words, with the variation of the operating temperature, not only the redox reaction rate but also the adsorption–desorption process would be greatly changed. In different temperature from 240 to 340 °C, the relationship between working temperature and gas response of the sensor to 100 ppm ethanol was investigated (Fig. 8a). The maximum response of Fe–O–Ti nanoparticles and pure Fe2O3 at 300 °C appearing is 27.0, 8.4, respectively. However, the reduction of response value is due to nano-size effect of the introduction of new energy levels with the increasing of temperature.38 The result demonstrated that 300 °C was the optimal operating temperature, which is lower than most of previous reports reported.39 At the optimal operating temperature, the response–recovery performance curve for the sample was tested (Fig. 8b). Compared to previous reports, Fe–O–Ti heterostructures exhibit a lower reaction temperature and higher response value.40Fig. 9 draws the response–recovery characteristic curves of the Fe–O–Ti heterostructures gas sensing to different concentrations of ethanol gas (5, 10, 30, 70, 100, and 200 ppm). It is clear to see that the gas sensor based on Fe–O–Ti heterostructures presents excellent response–recovery performances to different concentrations. When exposed to 5, 10, 30, 70, 100 and 200 ppm, the corresponding responses are 2.9, 4.7, 8.7, 19.7, 27.0 and 35.6, respectively (inset Fig. 9a). At the optimal operating temperature, Fe–O–Ti heterostructures exhibits 5 times higher response value compared to previous reports.40
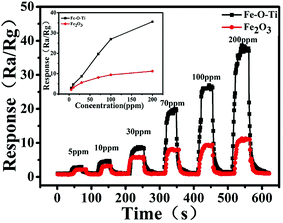 | ||
| Fig. 9 Response–recovery characteristics of Fe–O–Ti heterostructure nanoparticles and Fe2O3 at 300 °C, to different concentration of ethanol gas. | ||
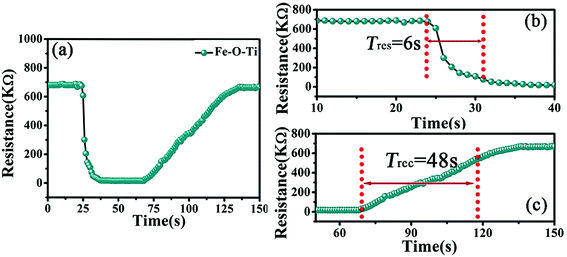
To explore the response sensitivity of materials, Fig. 10 displays the sensors response-time and recovery-time of the Fe–O–Ti heterostructures gas sensor. The response raises the reductive ethanol vapor concentration and then decreases and recovered to the initial states after that the vapor is released. The time interval when the resistance attains a fixed percentage of 90% of the final value was defined as the response time (Tres). The time consumed for the resistance recovery to 90% of the initial value after removing the test gas was defined as the recovery time (Trec). The Tres and Trec of Fe–O–Ti nanoparticles sensor toward 200 ppm of ethanol at 300 °C is determined to be 6 s and 48 s, respectively. The nanoscale porous structure of the Fe–O–Ti heterostructures can accelerate the reaction rate of gas sensing reaction, which lead to faster response and recovery time of the gas sensor.26,41 Gas sensing performance of Fe2O3- or TiO2-based nanomaterials to ethanol were listed in Table 1. It suggested that mulberry-like heterostructure Fe–O–Ti has a good sensing performance.
| Composition | Meas. temp. (°C) | Response | Concentration (ppm) | Tres/Trec (s) | Ref. |
|---|---|---|---|---|---|
| Fe2O3/TiO2 tube-like nanostructures | 320 | 19.4 | 500 | — | 40 |
| Brookite TiO2 decorated α-Fe2O3 nanoheterostructures | 370 | 14.2 | 100 | — | 39 |
| Core–shell α-Fe2O3 nanospindles@ZnO | 280 | 17.8 | 100 | ∼60/∼60 | 42 |
| γ-Fe2O3/In2O3 | 300 | 68 | 100 | 50–60/50–60 | 43 |
| Core–shell α-Fe2O3 nanowires@ZnO | 220 | 22.1 | 500 | 20/20 | 44 |
| SnO2 nanospheres functionalized TiO2 | 320 | 27.5 | 400 | — | 45 |
| TiO2/SnO2 core–shell nanocomposites | 200 | 12.7 | 1000 | ≤50/50 | 46 |
| Mulberry-like heterostructure Fe–O–Ti | 300 | 35.6 | 200 | 6/48 | This work |
The presence of this unique heterostructures may play an important role in adjusting the properties of the multiple oxides, which obviously improved the gas-sensing behavior. The gas response values to the VOCs of several species under a gas concentration of 100 ppm at 300 °C were tested. The values of Fe–O–Ti heterostructures gas sensor under formaldehyde, benzene, acetone, methanol and ethanol were 10.0, 7.1, 15.2, 13.8, 27.3, respectively, which were much higher than that of pure Fe2O3 (Fig. 11a). Moreover, the response recovery curves of other organic gases are shown in Fig. S1 (please refer to ESI†). Fe–O–Ti sensor with heterostructure has better gas sensing performance than pure Fe2O3 sensor. To explore the long term stability, the data was gathered every day (Fig. 11b). Obviously, the sensor with Fe–O–Ti heterostructures shows better stability. After 15 days, the Fe–O–Ti nanoparticles sensor showed an average response value of 26.83 to 100 ppm ethanol at 300 °C, demonstrating that Fe–O–Ti heterostructures may be a promising practical sensing material to detect ethanol gas.
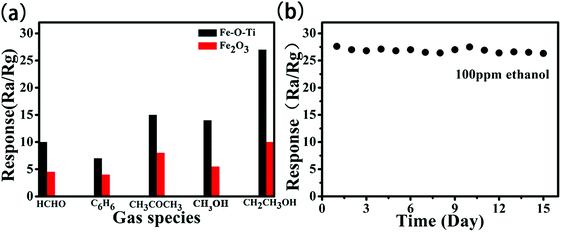 | ||
| Fig. 11 (a) Responses of the sensors based on Fe–O–Ti nanoparticles to various different gases at 300 °C (b) stability of the sensor based on Fe–O–Ti nanoparticles to 100 ppm ethanol at 300 °C. | ||
3.3 Gas sensing mechanism
The good selectivity of the Fe–O–Ti sensor to ethanol explained as follows. First, bond energy of organic gases plays a very important role in the activity of compound. That is to say, the lower the bond energy of organic gases, the easier the bond breaks. The bond energies of different compounds are listed in Table 2.47| Chemical bond | Representative Compounds | Bond energy (kJ mol−1) |
|---|---|---|
| O–H | Ethanol, methanol | 458.8 |
C![[double bond, length as m-dash]](https://www.rsc.org/images/entities/char_e001.gif) C C |
Benzene | 610.3 |
C![[double bond, length as m-dash]](https://www.rsc.org/images/entities/char_e001.gif) O O |
Formaldehyde, acetone | 798.9 |
It is obvious that the bond strength of O–H in ethanol is the lowest, indicating the high response of Fe–O–Ti sensors. Therefore, the reducing ability of ethanol is higher than those reducing gases. This fact is matched well with some previous reports.13,48 Second, the electron cloud density around O atom is far higher than that around C atom, so it's easier to get electrons. Thus, the attractive force between O atom in ethanol and Ti4+ on α-Fe2O3 surfaces can significantly facilitate the adsorption of ethanol.49 During the whole processes (eqn (2) and (3)), six electrons will be released from one ethanol molecule. But for methanol, only three electrons can be released under the same conditions.47 For the above reasons, our obtained sensor has a better selectivity to ethanol.
| CH3CH2OH + 6O− → CO2 + H2O + 6e− | (2) |
| CH3OH + 3O− → CO2 + H2O + 3e− | (3) |
Due to the different of the energy levels of Fe2O3 and titanium dioxide, the one-way electron flowing from Fe2O3 to titanium dioxide makes the Fermi energy level reach equilibrium state, which leads to the improvement of the separation efficiency of hole–electron pairs at the interface between two phases. Subsequently, interface reaction is going on, causing the increase in amount of free electrons involved in the reaction. The oxygen molecules (O− and O2−) are easily absorbed on the surface, generating electron depletion layers on the surface of oxide material. It give rise to the increasing resistance of the sensing material and the reduced conductivity. When the sensor with Fe–O–Ti heterostructure exposed to the ethanol vapor, the reducing gas could react with the absorbed Oδ− in the surfaces of semiconductor material, and the captured free electrons could be released back to the conduction bands of Fe2O3 and TiO2, resulting in reducing the height of the potential barrier and the width of the electron depletion layer at the interfaces of the Fe–O–Ti heterostructure sensor (Fig. 12). So, there is a significant variation in the conductivity of the Fe–O–Ti heterostructure. In consequence, the change in the height of the heterojunction barriers in the reducing gas helps to the improved performance of the Fe–O–Ti heterostructures.
| O2 + e− → O2− | (4) |
| O2− + e− → 2O− | (5) |
| O− + e− → O2− | (6) |
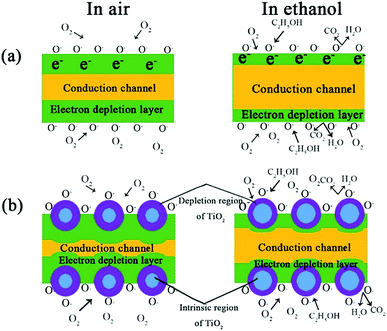 | ||
| Fig. 12 Surface processes associated with the reaction with ambient oxygen and testing ethanol of Fe2O3 (a) and Fe–O–Ti heterostructure (b). | ||
The specie and number of the chemisorbed oxygen on the compound surface play a crucial role in the performance of sensor. In general, large surface area of sensing materials could provide more adsorption sites for the tested gases and different types of oxygen, and is favorable for oxidation and target gas reaction.50 Thus, higher significant degree of electron transfer and more significant output of electric signal are found, which is detected by the electric circuit. In this respect, Fe–O–Ti can benefit for the enhancement of gas-sensing performance.
4. Conclusions
In summary, Fe–O–Ti heterostructures were successfully prepared by hydrothermal process and wet chemical deposition. The nanoparticles were ellipsoidal nanoparticles with a typical length of ∼100 nm and a diameter of ∼50 nm. The ethanol sensing behavior of Fe–O–Ti nanoparticles has been tested within the scope of 240–340 °C. The response value to 200 ppm ethanol vapor was 35.6, and the response time and recovery time were 6 and 48 s at 300 °C, respectively. The significant enhancement of gas sensitivity properties for these VOCs can be attributed to the large surface area and excellently porous structure. Finally, these results also demonstrated that Fe–O–Ti nanostructures were a great potential option as the gas sensing material. This material is expected to exploit the new sensing application in the future.Conflicts of interest
There are no conflicts to declare.References
- A. Kolmakov, Y. X. Zhang, G. S. Cheng and M. Moskovits, Adv. Mater. Res., 2003, 15, 997–1000 CrossRef CAS.
- S. Kim, S. Park, G.-J. Sun, S. K. Hyun, K.-K. Kim and C. Lee, Curr. Appl. Phys., 2015, 15, 947–952 CrossRef.
- Y. Liu, E. Koep and M. Liu, Chem. Mater., 2005, 17, 3997–4000 CrossRef CAS.
- S. R. Gawali, V. L. Patil, V. G. Deonikar, S. S. Patil, D. R. Patil, P. S. Patil and J. Pant, J. Phys. Chem. Solids, 2018, 114, 28–35 CrossRef CAS.
- N. Pal and E. P. Murray, Sens. Actuators, B, 2018, 256, 351–358 CrossRef CAS.
- W. C. Huang, H. J. Tsai, T. C. Lin, W. C. Weng, Y. C. Chang, J. L. Chiu, J. J. Lin, C. F. Lin, Y. S. Lin and H. Chen, Ceram. Int., 2018, 44, 12308–12314 CrossRef CAS.
- O. Ovsianytskyi, Y. S. Nam, O. Tsymbalenko, P. T. Lan, M.-W. Moon and K.-B. Lee, Sens. Actuators, B, 2018, 257, 278–285 CrossRef CAS.
- A. H. Alinoori and S. Masoum, Anal. Chem., 2018, 90, 6635–6642 CrossRef CAS PubMed.
- A. Simo, K. Kaviyarasu, B. Mwakikunga, M. Mokwena and M. Maaza, Ceram. Int., 2017, 43, 1347–1353 CrossRef CAS.
- W. Gathright, M. Jensen and D. Lewis, Electrochem. Commun., 2011, 13, 520–523 CrossRef CAS.
- Y. Zhu, V. Thangadurai and W. Weppner, Sens. Actuators, B, 2013, 176, 284–289 CrossRef CAS.
- X. Liu, N. Chen, X. Xing, Y. Li, X. Xiao, Y. Wang and I. Djerdj, RSC Adv., 2015, 5, 54372–54378 RSC.
- X. Yang, Q. Yu, S. Zhang, P. Sun, H. Lu, X. Yan, F. Liu, X. Zhou, X. Liang, Y. Gao and G. Lu, Sens. Actuators, B, 2018, 266, 213–220 CrossRef CAS.
- M. Subramanian, V. V. Dhayabaran, D. Sastikumar and M. Shanmugavadivel, J. Alloys Compd., 2018, 750, 153–163 CrossRef CAS.
- J.-K. Sun and Q. Xu, Energy Environ. Sci., 2014, 7, 2071 RSC.
- P. Gao, R. Liu, H. Huang, X. Jia and H. Pan, RSC Adv., 2016, 6, 94699–94705 RSC.
- X. Liu, R. Dang, W. Dong, X. Huang, J. Tang, H. Gao and G. Wang, Appl. Catal., B, 2017, 209, 506–513 CrossRef CAS.
- S. M. Majhi, G. K. Naik, H.-J. Lee, H.-G. Song, C.-R. Lee, I.-H. Lee and Y.-T. Yu, Sens. Actuators, B, 2018, 268, 223–231 CrossRef CAS.
- M. Drobek, J. H. Kim, M. Bechelany, C. Vallicari, A. Julbe and S. S. Kim, ACS Appl. Mater. Interfaces, 2016, 8, 8323–8328 CrossRef CAS PubMed.
- J. He, W. Lv, Y. Chen, J. Xiong, K. Wen, C. Xu, W. Zhang, Y. Li, W. Qin and W. He, J. Mater. Chem. A, 2018, 6, 10466–10473 RSC.
- D. Ji, H. Zhou, Y. Tong, J. Wang, M. Zhu, T. Chen and A. Yuan, Chem. Eng. J., 2017, 313, 1623–1632 CrossRef CAS.
- P. Song, Q. Wang and Z. Yang, Sens. Actuators, B, 2012, 168, 421–428 CrossRef CAS.
- Y. Shi, Z. Li, J. Shi, F. Zhang, X. Zhou, Y. Li, M. Holmes, W. Zhang and X. Zou, Sens. Actuators, B, 2018, 260, 465–474 CrossRef CAS.
- Y. Wang, J. Ma, S. Zuo-Jiang and K. Chen, Ceram. Int., 2017, 43, 16482–16487 CrossRef CAS.
- U. O. Bhagwat, J. J. Wu, A. M. Asiri and S. Anandan, J. Photochem. Photobiol., A, 2017, 346, 559–569 CrossRef CAS.
- X. Song, Q. Xu, T. Zhang, B. Song, C. Li and B. Cao, Sens. Actuators, B, 2018, 268, 170–181 CrossRef CAS.
- Z. Guanghong, D. Hongyan, Z. Yufu, L. Yuebin and L. Peng, Rare Met. Mater. Eng., 2016, 45, 1117–1121 CrossRef.
- S. S. Kumbhar, M. A. Mahadik, S. S. Shinde, K. Y. Rajpure and C. H. Bhosale, J. Photochem. Photobiol., B, 2015, 142, 118–123 CrossRef CAS PubMed.
- Q. Xu, Z. Zhang, X. Song, S. Yuan, Z. Qiu, H. Xu and B. Cao, Sens. Actuators, B, 2017, 245, 375–385 CrossRef CAS.
- X. Li, H. Lin, X. Chen, H. Niu, J. Liu, T. Zhang and F. Qu, Phys. Chem. Chem. Phys., 2016, 18, 9176–9185 RSC.
- K. S. Kim and N. Winograd, Sens. Actuators, B, 1974, 43, 625–643 CAS.
- Y. Wang, L. Liu, C. Meng, Y. Zhou, Z. Gao, X. Li, X. Cao, L. Xu and W. Zhu, Sci. Rep., 2016, 6, 33092 CrossRef CAS PubMed.
- L. Wang, J. Gao, B. Wu, K. Kan, S. Xu, Y. Xie, L. Li and K. Shi, ACS Appl. Mater. Interfaces, 2015, 7, 27152–27159 CrossRef CAS PubMed.
- C. Xie, S. Yang, J. Shi and C. Niu, Catalysts, 2016, 6, 117 CrossRef.
- M. Kruk and M. Jaroniec, Chem. Mater., 2001, 13, 3169–3183 CrossRef CAS.
- S. Bai, C. Liu, R. Luo and A. Chen, Chem. Mater., 2018, 437, 304–313 CAS.
- Y. L. Pang, S. Lim, H. C. Ong and W. T. Chong, Ultrason. Sonochem., 2016, 29, 317–327 CrossRef CAS PubMed.
- W. Zhang, B. Yang, J. Liu, X. Chen, X. Wang and C. Yang, Sens. Actuators, B, 2017, 243, 982–989 CrossRef CAS.
- Y. Wang, S. Wang, H. Zhang, X. Gao, J. Yang and L. Wang, J. Mater. Chem. A, 2014, 2, 7935 RSC.
- C. L. Zhu, H. L. Yu, Y. Zhang, T. S. Wang, Q. Y. Ouyang, L. H. Qi, Y. J. Chen and X. Y. Xue, ACS Appl. Mater. Interfaces, 2012, 4, 665–671 CrossRef CAS PubMed.
- Y. J. Chen, C. L. Zhu, L. J. Wang, P. Gao, M. S. Cao and X. L. Shi, Nanotechnology, 2009, 20, 045502 CrossRef PubMed.
- J. Zhang, X. Liu, L. Wang, T. Yang, X. Guo, S. Wu, S. Wang and S. Zhang, Nanotechnology, 2011, 22, 185501 CrossRef PubMed.
- M. Ivanovskaya, D. Kotsikau, G. Faglia and P. Nelli, Sens. Actuators, B, 2003, 96, 498–503 CrossRef CAS.
- C. L. Zhu, Y. J. Chen, R. X. Wang, L. J. Wang, M. S. Cao and X. L. Shi, Sens. Actuators, B, 2009, 140, 185–189 CrossRef CAS.
- W. Zeng, T. Liu and Z. Wang, J. Mater. Chem., 2012, 22, 3544 RSC.
- S. Khoby-Shendy, M. R. Vaezi and T. Ebadzadeh, Int. J. Mod. Phys.: Conf. Ser., 2012, 05, 251–256 CAS.
- L. Guo, C. Wang, X. Kou, N. Xie, F. Liu, H. Zhang, X. Liang, Y. Gao, Y. Sun, X. Chuai and G. Lu, Sens. Actuators, B, 2018, 266, 139–148 CrossRef CAS.
- L. Zhang, J. Zhao, H. Lu, L. Li, J. Zheng, J. Zhang, H. Li and Z. Zhu, Sens. Actuators, B, 2012, 171–172, 1101–1109 CrossRef CAS.
- D. X. Ju, H. Y. Xu, Z. W. Qiu, Z. C. Zhang, Q. Xu, J. Zhang, J. Q. Wang and B. Q. Cao, ACS Appl. Mater. Interfaces, 2015, 7, 19163–19171 CrossRef CAS.
- N. Chen, D. Deng, Y. Li, X. Liu, X. Xing, X. Xiao and Y. Wang, Sci. Rep., 2017, 7, 7692 CrossRef.
- D. Peeters, D. Barreca, G. Carraro, E. Comini, G. Alberto, M. Chiara, C. Sada and G. Sberveglieri, J. Phys. Chem. C, 2014, 118, 11813–11819 CrossRef CAS.
Footnote |
| † Electronic supplementary information (ESI) available. See DOI: 10.1039/c9ra00619b |
| This journal is © The Royal Society of Chemistry 2019 |

