 Open Access Article
Systematically quantitative proteomics and metabolite profiles offer insight into fruit ripening behavior in Fragaria × ananassa†
Li Li‡
 ab,
Qiong Wu‡ac,
Youyong Wanga,
Morteza Soleimani Aghdam
 d,
Zhaojun Bane,
Xiaochen Zhanga,
Hongyan Lua,
Dong Lia,
Jiawei Yana,
Jarukitt Limwachiranona and
Zisheng Luo*ab
aKey Laboratory for Agro-Products Postharvest Handling of Ministry of Agriculture and Rural Affairs, Zhejiang Key Laboratory for Agro-Food Processing, College of Biosystems Engineering and Food Science, Zhejiang University, Hangzhou, 310058, China. E-mail: luozisheng@zju.edu.cn
bNingbo Research Institute, Zhejiang University, Ningbo, 315100, China
cCollaborative Innovation Center of Henan Grain Crops, Henan Collaborative Innovation Center of Grain Storage and Security, School of Food Science and Technology, Henan University of Technology, Zhengzhou, 450001, China
dDepartment of Horticultural Science, Imam Khomeini International University, Qazvin, Iran
eZhejiang Provincial Key Laboratory of Chemical and Biological Processing Technology of Farm Products, School of Biological and Chemical Engineering, Zhejiang University of Science and Technology, Hangzhou 310023, China
First published on 7th May 2019
Abstract
Profound metabolic and proteomic changes involved in the primary and the secondary metabolism are required for the ripeness of fleshy fruit such as strawberries (Fragaria × ananassa). Here we present the quantitative proteomic profiling in parallel with metabolic and transcriptional profiling at five developmental stages of strawberry fruit ripening, and correlations between changes in representative metabolites and the abundance of related proteins were analyzed. Hierarchical clustering analysis of the quantitative proteomic profiling identified 143 proteins in strawberry fruit across five developmental stages. Meanwhile, both protein abundance and gene expression spanned a wide range of roles, such as the primary and the secondary metabolism, defense system, and response to stress stimuli. The decreased abundance of proteins contributed to the carbohydrate metabolism and the up-regulated expression of secondary biosynthetic proteins was found to be positively correlated with the accumulation of primary and secondary metabolites during strawberry development. Moreover, with the same annotations and high homology, the gene function of key genes involved in primary and secondary metabolism (FaTPI, FaPAL, FaMDH and FaME) was confirmed in Nicotiana via the transient expression assay, which provides further evidence for the role of those genes in metabolism of strawberry fruit. The results of the present study may serve as an important resource for the functional analysis of the proteome and offer new perspectives on regulation of fruit quality.
1. Introduction
Fruit ripening is a highly complicated and cooperative developmental process that results in profound regulation of the primary and the secondary metabolism, and variations in color, flavor, aroma, texture, and nutritional values.1 Strawberry (Fragaria × ananassa) is a worldwide consumed fruit with well-known nutritional value, antioxidant capacities, and flavor quality. Given the sequence of both diploid woodland strawberry (Fragaria vesca) and cultivated strawberry (Fragaria × ananassa),2,3 the molecular dissection of strawberry ripening and development has recently attracted considerable interest.4As a typical non-climacteric fruit, strawberry exhibit dramatic changes in color, flavor (aroma and taste) and sugar and acidity contents during ripening.5 The carbohydrates and acids take pivotal action in determining accumulation of secondary metabolites such as volatiles and pigments in strawberry ripening. In strawberry, most inputted carbohydrates are sharply metabolized through glycolysis pathway and the tricarboxylic acid (TCA) cycle during the early developmental stages. During early ripening, the less accumulation of sugars and more organic acids are accumulated; and afterwards glucose and sucrose are accumulated while additional carbon is shifted into starch in plastid for storage, as the cell expansion as well as the slowdown of carbohydrate metabolism; during late development, ribose, arabinose, raffinose, and sucrose are accumulated while the starch is broken down.6 This in combination with further declining organic acids, such as gluconate and galacturonate, contribute to the sweetness and flavour quality.7 In addition to sugar and acid content, amino acids also significantly contribute to strawberry quality.8 In the case of secondary metabolism, flavor and aromatic compounds, derived from sugars, acids, and amino acids, as well as anthocyanins and flavonoids are the majority of ripening-associated metabolites. Currently, the molecular mechanism of primary and secondary metabolism during strawberry ripening is still not completely elucidated.
In recent years, quantitative proteomic research has increased due to its simultaneous screening of evolutionary innovations in metabolic pathways. ITRAQ, the isobaric tags for a relative and absolute quantification approach, is widely used to investigate the identification and quantification of proteins in fruit such as melons,9 grapes,10 citrus fruit,11 pears,12 and tomatoes.13 Up to now, efforts in global proteomic profiling of strawberries, tomatoes, pears and grapes have been focused on fruit ripening and, fruit allergens, as well as physiological disorder.14–19 For strawberry, several research have been carried out to describe the proteomic changes in fruit ripening,5,14 varietal difference,20 strawberry allergen,17 as well as response to environmental stress stimuli.21,22 However, the relationship between the protein changes and the carbohydrate metabolism during strawberry ripening and development remains obscure.
In this study an integrated isobaric tag for iTRAQ and metabolomic analysis was conducted. The objectives were to make better sense of the dynamic proteome of strawberry at stages of small green (SG), big green (BG), white fruit (WF), turning (TU), and red fruit (RF), and to pinpoint the functional proteins contributed to the primary and the secondary metabolism in strawberry development, that intriguingly provided a stepping stone for elucidating the molecular mechanism of quality development.
2. Materials and methods
2.1 Plant materials
Strawberries (Fragaria × ananassa Duch. ‘Benihoppe’, registration no. 10371 in Japan, http://www.hinsyu.maff.go.jp/) plants were cultivated in a local orchard (Hangzhou, China). Every three rows were regarded as one replication, for a total of fifteen rows and twenty-five plants (with similar size and development stage) per row were used in the present study. Strawberries from five developmental stages were harvested and collected. Developmental stages were defined as small green (SG, seven days post-anthesis (DPA)), big green (BG, 14 DPA), white fruit (WF, 21 DPA), turning (TU, 28 DPA), and red fruit (RF, 35 DPA), as described by Li et al.21 The calyxes and pedicels of strawberry were removed and both strawberry achenes and receptacle were frozen in liquid nitrogen immediately before stored at −80 °C. Three independent biological replications at three harvest times (Dec 5th 2015, Jan 5th 2016 and Feb 5th 2016) were prepared for each developmental stage using mixed achene and receptacle tissues from twenty five individual strawberries for subsequent analyses.2.2 Non-volatile metabolites
Non-volatile metabolites were extracted and analyzed with fully ground samples at each of the five developmental stages (SG, BG, WF, TU and RF) as described by Roessner et al.23 Briefly, the frozen strawberry powder and methanol (1![[thin space (1/6-em)]](https://www.rsc.org/images/entities/char_2009.gif) :
:![[thin space (1/6-em)]](https://www.rsc.org/images/entities/char_2009.gif) 1, v/v) was mixed and vortexed, then sonicated and centrifuged at 16
1, v/v) was mixed and vortexed, then sonicated and centrifuged at 16![[thin space (1/6-em)]](https://www.rsc.org/images/entities/char_2009.gif) 000 × g for ten minutes, the procedure repeated three times, then the resulting extracts were used for the following assay.
000 × g for ten minutes, the procedure repeated three times, then the resulting extracts were used for the following assay.
The extracted metabolites were analyzed by the HPLC system (Agilent Technologies 1100) and a ion-trap mass spectrometer (MS, Bruker Daltonics), equipped with a C18 reverse-phase column. Isovitexin (CAS: 29702-25-8) was used as the internal standard. The mobile phase was composed by the 0.1% (v/v) formic acid in water (Solvent A) and 0.1% formic acid (v/v) in methanol (Solvent B). The analyze gradient was: Solvent B 0% to 50%, 0–30 min; Solvent B 50% to 100%, 30–35 min; Solvent B 100%, 35–50 min; Solvent B 100% to 0%, 50–55 min. The MS data were analyzed with Data Analysis software (Bruker Daltonics, version 5.1). Compounds were identified with the reference compounds using the retention time and mass spectra. The results were presented based on a fresh weight (FW) from three independently technical replications.
2.3 Volatile metabolites
The volatile metabolites were measured according to Li et al.21 Briefly, the volatile compounds were extracted with a solid phase microextraction (SPME) fiber, and were then analyzed with gas chromatography-mass spectrometry (GC-MS, QP2010, Shimadzu Co., Kyoto, Japan), equipped with a DB-5MS column (J & W Scientific Inc., Folsom, USA). The experiment procedure was: initial temperature, 35 °C; increased to 240 °C at 0.25 °C s−1; held at 240 °C for 4.5 min. The concentrations of volatile compounds were presented based on FW from three technical replications.2.4 Proteomic analysis
Proteins of the five developmental stages (SG, BG, WF, TU and RF) were extracted and purified as reported by Li et al.5 The concentrations of protein were analyzed with a Reducing agent Compatible/Detergent Compatible™ (RC/DC™) kit (Bio-Rad Laboratories, CA, USA). Then, the proteins were digested by the modified trypsin (Promega, Madison, WI) at 37 °C.The digested peptides were labeled by the iTRAQ 5-plex with 113-tag (SG, 7 DPA), 114-tag (BG, 14 DPA), 115-tag (WF, 21 DPA), 116-tag (TU, 28 DPA), or 121-tag (RF, 35 DPA). The labeled peptides were pooled, fractionated and lyophilized by HPLC system (Shimadzu LC-20AB). Afterwards, the re-suspended peptide samples were loaded and then eluted from a Capillary C18 in Shimadzu LC-20AD HPLC following the solvent gradient: buffer B (95% ACN, 1% formic acid), 2% to 35%, 0–40 min; buffer B, 35% to 80%, 40–45 min; buffer B, 80%, 45–49 min. The results were analyzed with a Q-Exactive MS system (Thermo Fisher Scientific, CA, USA) and the raw MS data were searched using Proteome Discoverer software (Thermo Fisher Scientific, CA, USA, version 1.3) in comparison to a total of 2![[thin space (1/6-em)]](https://www.rsc.org/images/entities/char_2009.gif) 474
474![[thin space (1/6-em)]](https://www.rsc.org/images/entities/char_2009.gif) 089 sequences, updated on December 01, 2014 (NIH, Bethesda, MD, USA). The protein abundance was analyzed with Mascot (Matrix Science, London, UK, version 2.3.02). Carboxamidomethyl cysteine was set as the fixed modification and oxidized methionine was set as the variable modification. For the protein identification and quantification, the false discovery rate (FDR) of 5% and the regulation of proteins abundance greater than twofold, as well as p-values below 0.05 were set to identify and quantify proteins.
089 sequences, updated on December 01, 2014 (NIH, Bethesda, MD, USA). The protein abundance was analyzed with Mascot (Matrix Science, London, UK, version 2.3.02). Carboxamidomethyl cysteine was set as the fixed modification and oxidized methionine was set as the variable modification. For the protein identification and quantification, the false discovery rate (FDR) of 5% and the regulation of proteins abundance greater than twofold, as well as p-values below 0.05 were set to identify and quantify proteins.
2.5 Real-time quantitative PCR (RT-qPCR)
The target genes involved in primary or secondary metabolism used for RT-qPCR in the present study were selected based on protein profiles (Table S1†) in Table S2.† Total RNA was extracted by the hot borate protocol.24 The resulting RNA was quantified and reverse transcripted to cDNA. Then RT-qPCR was performed on an ABI 7500 Real-Time PCR System (Applied Biosystems, USA) following the protocol of the Kit (RR420A, TAKARA, Tokyo, Japan). Genes expression was normalized against the actin gene expression using 2−ΔΔCt method. Primers used for RT-qPCR were listed in ESI Tables S2 and S3.†2.6 VIGS and transient expression analysis
The transient over-expression and VIGS analysis were performed in Nicotiana benthamiana and Nicotiana tabacum, respectively.For transient overexpression analysis, full-length open reading frame of genes encoding triose phosphate isomerase, malic enzyme, malate dehydrogenases and phenylalanine ammonia lyase in strawberry (FaTPI, FaME, FaMDH and FaPAL) were amplified with primers listed in Table S2.† After digestion and purification, the resulting PCR products were introduced into a modified pCAMBIA1305vector, 1305-Glup9P-Glup9LL-GFP (1305-GFP),25 and ten tobacco plants in each batch were infiltrated and the successfully overexpressed plants were selected for further analysis.
For VIGS experiment, the resulting PCR product of genes encoding triose phosphate isomerase, malic enzyme, malate dehydrogenases and phenylalanine ammonia-lyase in Nicotiana tabacum (NtTPI, NtPAL, NtMDH and NtME) was purified and inserted into XbaI-BamHI-digested pBIN2mDNA1 (2mDNA1) plasmid to construct the VIGS vectors 2mDNA1-NtTPI, 2mDNA1-NtPAL, 2mDNA1-NtMDH and 2mDNA1-NtME.26 Tobacco curly shoot virus (TbCSV) infection clones Pbinplus-Y35-1.9A was used as a helper virus and 2mDNA1-NtSu was set as positive control,25 in each batch, ten tobacco plants were infiltrated and the successfully silenced plants were selected for further analysis.
Microscopy of infiltrated leaf was studied using the Leica TCS SP8 laser confocal scanning microscope (Leica, Heideberg, Germany) on 3 d after inoculation. The metabolite profiles and gene expression related to the primary and the secondary metabolism were analyzed on 5 d after infiltration according to the protocol mentioned above.
2.7 Statistical analysis
All sampling and experiments were carried out with three technical replicates of determinations and three biological replicates of different harvest times (Dec 5th 2015, Jan 5th 2016 and Feb 5th 2016). Data were analyzed using ANOVA by the JMP IN software package (SAS Institute, 2003, version 5.1) at a level of LSD = 0.05. The proteomic datasets were normalized to log2 ratios and analyzed by cluster software (http://biit.cs.ut.ee/clustvis/).3. Results
3.1 Primary and secondary metabolites
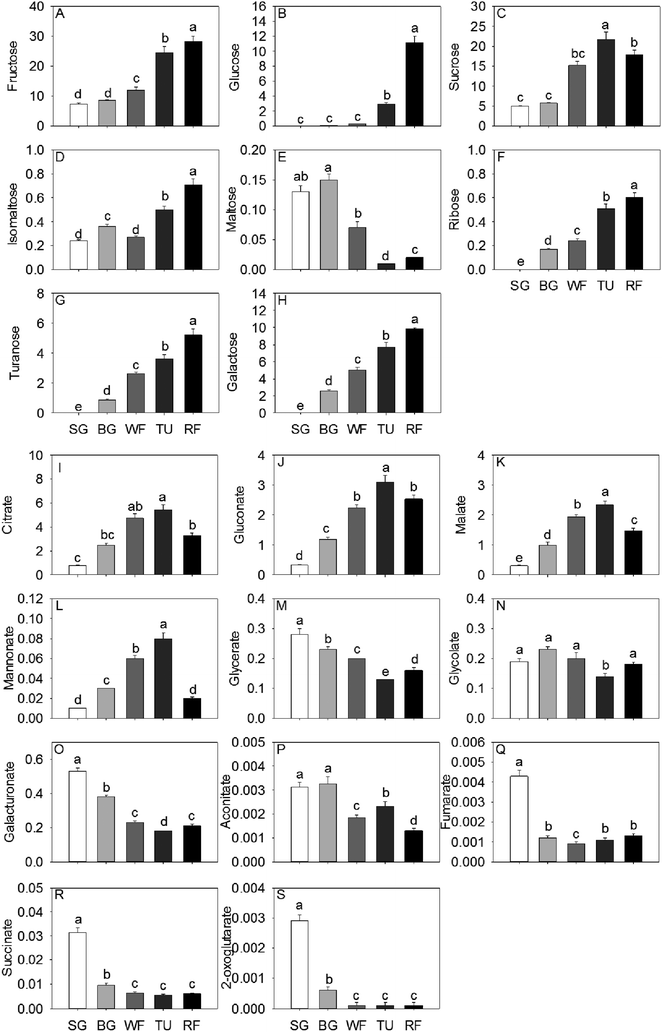
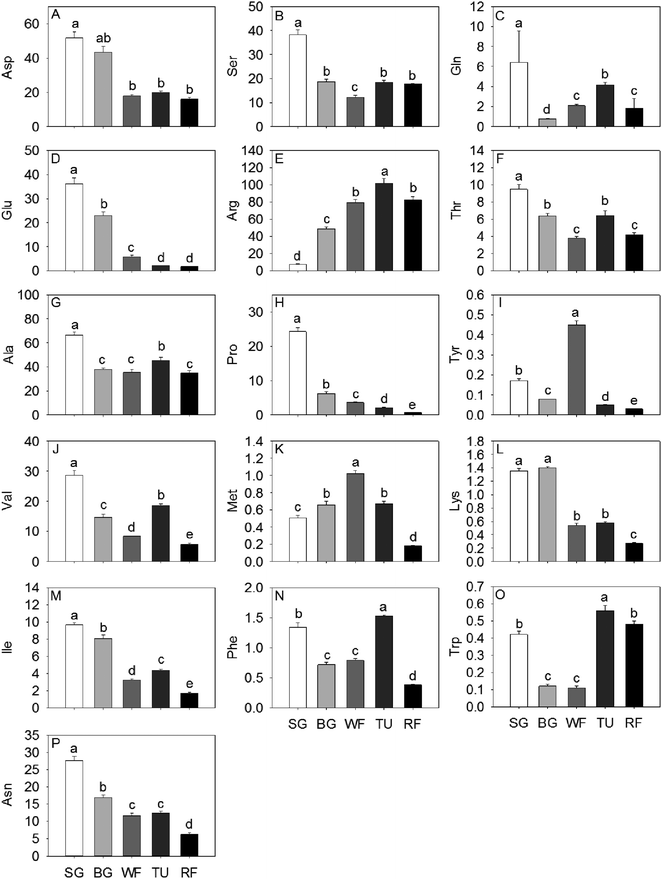
In general, total sugar content went up gradually as strawberry development. The predominant soluble sugars were fructose, sucrose and glucose, all of which were significantly increased by a factor of 3.81, 3.58 and 139.50, respectively, from SG to RF stage (Fig. 1). In addition, the isomaltose, ribose, turanose, and galactose content also increased significantly along with the developmental stages. The accumulation of maltose initially increased to 115.38% in the BG stage and thereafter decreased to 15.36% in the RF stage compared to the initial (Fig. 1). Citrate, malate, and gluconate were the most abundant acids in strawberry and the highest level of total acid concentration was detected at the TU stage. Organic acid content, including citrate, gluconate, malate, and mannonate displayed a unimodal pattern with a peak in content at the TU stage. In contrast, both glycerate and galacturonate exhibited an inverse unimodal curve, with a maximum at the SG stage and a minimum at the TU stage. Additional organic acids such as succinate and fumarate had maximum concentrations of 31.4 mg kg−1 and 4.3 mg kg−1, respectively, at the SG stage and thereafter decreased by a factor of 3.34 and 3.58 remaining constant through the remaining developmental stages (Fig. 1).Sixteen amino acids were identified and quantified in the five different developmental stages (Fig. 2). Glu, Pro and Asn decreased gradually, while Asp exhibited a sharp decrease at the WF stage and remaining constant in TU and RF stage And Ala, Val, and Ile decreased in early ripening and exhibited a sharp increase at the TU stage. In addition, Ser, Thr and Trp levels dropped sharply to 32.09%, 39.98% and 26.19%, respectively of initial values in the WF stage and thereafter increased to 48.52%, 68.25% and 133.33%, respectively in the TU phase. Arg, Met, Phe, Tyr, and Trp showed the highest level at the TU or WF stage, whereas the Lys exhibited a bimodal trend with two peaks of 104.00% and 42.96% at BG and TU stages, respectively. Gln also showed two accumulation peaks at the SG and TU stages.
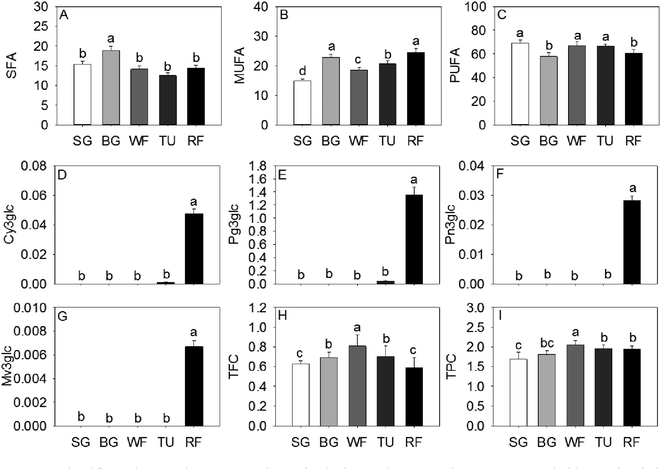
The monounsaturated fatty acids (MUFA) and saturated fatty acids (SFA) significantly increased at the BG stage followed by a decrease in late ripening process. An opposite trend of accumulation was observed for polyunsaturated fatty acids (PUFA) in strawberry (Fig. 3). The majority of anthocyanins were derivatives of pelargonidins, cyanidins, and peonidins. As expected, the 3-O-β-glucopyranosides of malvidin (Mv3glc), 3-O-β-glucopyranosides of peonidin (Pn3glc), 3-O-β-glucopyranosides of cyanidin (Cy3glc), and 3-O-β-glucopyranosides of pelargonidin (Pg3glc), related to the pigments and coloration, were significantly increased from the SG to the RF stage (Fig. 3).
The main volatile compounds were two furanones, 4-methoxy-2,5-dimethyl-3(2H)-furanone (DMMF, 19.6731 mg kg−1) and 5-hexyldihydro-2(3H)-furanone (γ-dodecalactone, 17.4564 mg kg−1), two esters, butanoic acid, methyl ester (4.4383 mg kg−1) and (Z)-2-hexen-1-ol, acetate (4.8025 mg kg−1), two terpenes, ocimene (8.4542 mg kg−1) and γ-elemene (5.3952 mg kg−1), one aldehyde (E)-2-hexenal (17.2140 mg kg−1), and one acid, hexanoic acid (9.3494 mg kg−1). Most of these volatile compounds increased significantly in accompany with developmental stages, with the exception of (E)-2-hexenal, which decreased significantly. Only (E)-2-hexenal was found in the SG phase, while (Z)-2-hexen-1-ol, (E)-2-hexenal, and 5-hexyldihydro-2(3H)-furanone were found in the BG stage (Table 1).
| RIa | RIb | Retention time (min) | SG | BG | WF | TU | RF | |
|---|---|---|---|---|---|---|---|---|
| a Calculated retention indices using a series of n-alkanes.b Published retention indices on DB-5 column according to Adams (2001) and the Flavornet database (http://www.flavornet.org).c The concentrations of volatiles compounds identified were presented as means of mg kg−1 fresh weight of strawberry ± standard deviations from three replications(n = 3).d Different letters followed means indicated significantly different in the same row (p < 0.05). ND means not detected. | ||||||||
| Esters | ||||||||
| Methyl butyrate | 792 | 729 | 4.597 | NDc | ND | ND | ND | 4.4383a ± 0.3289d |
| Butyl acetate | 810 | 811 | 4.923 | ND | ND | 0.0066c ± 0.0004 | 0.0101b ± 0.0006 | 0.5426a ± 0.0217 |
| 1-Butanol-3-methyl-acetate | 838 | 881 | 5.518 | ND | ND | 0.0022c ± 0.0003 | 0.1071b ± 0.0086 | 0.4986a ± 0.0316 |
| Methyl hexanoate | 897 | 927 | 6.763 | ND | ND | 0.3501c ± 0.0134 | 0.5852b ± 0.0412 | 3.6471a ± 0.2140 |
| Hexyl acetate | 949 | 1009 | 8.135 | ND | ND | 0.1244c ± 0.0081 | 1.0778b ± 0.0735 | 1.5485a ± 0.0947 |
| (Z)-2-Hexen-1-ol, acetate | 985 | 1005 | 9.086 | ND | ND | 0.8718c ± 0.0413 | 6.1749a ± 0.5140 | 4.8025b ± 0.2714 |
| Methyl nonynoate | 1046 | — | 10.785 | ND | ND | 0.2294a ± 0.0168 | 0.1825ab ± 0.0108 | 0.1210c ± 0.0073 |
| α-Terpineol acetate | 1159 | 1349 | 13.974 | ND | ND | 0.1821c ± 0.0041 | 0.2931b ± 0.0164 | 1.7973a ± 0.0706 |
| Phenylethyl acetate | 1177 | 1194 | 14.467 | ND | ND | 0.1666c ± 0.0037 | 0.7893b ± 0.0083 | 2.0789a ± 0.1713 |
![[thin space (1/6-em)]](https://www.rsc.org/images/entities/char_2009.gif) |
||||||||
| Alcohols | ||||||||
| (Z)-2-Hexen-1-ol | 805 | 859 | 4.835 | ND | 0.4571c ± 0.0048 | 1.9520a ± 0.1073 | 0.8152b ± 0.0416 | 0.9922b ± 0.0736 |
| 1-Hexyn-3-ol | 914 | — | 7.191 | ND | ND | 0.6685a ± 0.0218 | 0.4034b ± 0.0214 | 0.3324b ± 0.0264 |
| cis-Linalool oxide | 1060 | 1008 | 11.190 | ND | ND | 0.0555c ± 0.0033 | 0.1709a ± 0.0153 | 0.1073b ± 0.0081 |
| α-Bisabolol | 1341 | 1686 | 18.881 | ND | ND | 0.0130c ± 0.0011 | 0.1335b ± 0.0072 | 0.6236a ± 0.0306 |
![[thin space (1/6-em)]](https://www.rsc.org/images/entities/char_2009.gif) |
||||||||
| Aldehydes | ||||||||
| (E)-2-Hexenal | 925 | 855 | 7.498 | 42.7164a ± 2.7161 | 33.4542b ± 1.9677 | 29.7748c ± 1.8638 | 18.1924d ± 1.2341 | 17.214d ± 1.0410 |
![[thin space (1/6-em)]](https://www.rsc.org/images/entities/char_2009.gif) |
||||||||
| Acids | ||||||||
| 2-Methylbutanoic acid | 1145 | — | 13.566 | 0.0100c ± 0.0020 | ND | 0.0238c ± 0.0013 | 0.1351b ± 0.0086 | 1.2098a ± 0.1004 |
| Hexanoic acid | 1216 | — | 15.537 | 0.0725d ± 0.0047 | ND | 0.1765c ± 0.0119 | 0.6938b ± 0.0413 | 9.3494a ± 0.6716 |
![[thin space (1/6-em)]](https://www.rsc.org/images/entities/char_2009.gif) |
||||||||
| Terpenes | ||||||||
| 7,7-Dimethyl-3,4-octadiene | 1021 | 1104 | 10.077 | ND | ND | 0.5261a ± 0.0314 | 0.4115b ± 0.0314 | 0.3671c ± 0.0224 |
| Ocimene | 1086 | 1050 | 11.908 | ND | ND | 0.2807c ± 0.0192 | 0.9392b ± 0.0712 | 8.4542a ± 0.6670 |
| Caryophyllene | 1141 | 1409 | 13.461 | ND | ND | 0.0009c ± 0.0001 | 0.0028b ± 0.0003 | 0.4250a ± 0.0262 |
| γ-Elemene | 1290 | 1437 | 17.537 | ND | ND | 0.0081c ± 0.0004 | 0.0361b ± 0.0024 | 5.3952a ± 0.3465 |
![[thin space (1/6-em)]](https://www.rsc.org/images/entities/char_2009.gif) |
||||||||
| Furanones | ||||||||
| 4-Methoxy-2,5-dimethyl-3(2H)-furanone (DMMF) | 1119 | — | 12.832 | ND | ND | ND | 0.0627b ± 0.0014 | 19.6731a ± 1.6325 |
| 5-Hexyldihydro-2(3H)-furanone(γ-decalactone) | 1349 | 1422 | 19.067 | ND | 0.0716d ± 0.0018 | 0.1001c ± 0.0071 | 0.3691b ± 0.0234 | 17.4564a ± 1.0652 |
![[thin space (1/6-em)]](https://www.rsc.org/images/entities/char_2009.gif) |
||||||||
| Others | ||||||||
| 2-Ethylfuran | 1033 | — | 10.423 | ND | ND | 0.7231b ± 0.0617 | 0.5434a ± 0.0341 | 0.5434a ± 0.0335 |
| Benzoyl bromide | 1095 | — | 12.175 | 0.0171e ± 0.0012 | 0.0348d ± 0.0033 | 1.5613c ± 0.1264 | 2.0924b ± 0.1713 | 3.6538a ± 0.2716 |
| 2,4-Bis(1,1-dimethylethyl)-phenol | 1393 | 1349 | 20.205 | ND | ND | 0.9058b ± 0.0719 | 0.7926c ± 0.0518 | 1.3933a ± 0.0877 |
| 2-(7-Dodecynyloxy)tetrahydro-2H-pyran | 1445 | — | 21.481 | ND | ND | 0.0060c ± 0.0004 | 0.0474b ± 0.0021 | 1.6060a ± 0.1096 |
3.2 Overview of proteins identification and quantification
The proteins in three replications at five stages were iTRAQ labeled and the relative abundance were determined based on iTRAQ-plex reporter ion ratios of 115/114 (BG/SG), 116/114 (WF/SG), 117/114 (TU/SG), 118/114 (RF/SG), and 119/114 (technical replication for SG). Detailed information of protein identification and quantifications are shown in Tables S1 and S2.† Overall, the Venn diagram shows 143 proteins overlapped in all developmental stages and biological replications (Fig. 4A). The protein profiles at the SG stage were used as the denominator and a 2-fold change was used as the variance for abundance shift. The normalized ratio of protein abundance depicted the dynamic variations in protein abundance with developmental stage (Fig. 4B).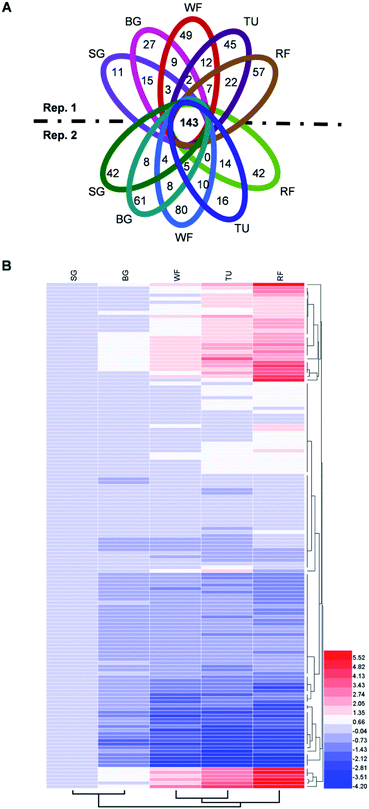 | ||
| Fig. 4 Venn diagram and hierarchical cluster analysis of identified proteins in strawberry fruit at five developmental stages. (A) Venn diagram; (B) hierarchical cluster analysis. Detailed information were listed in Table S2.† The red or blue colors indicates differentially altered abundances compared with strawberry proteins at small green (SG) stage. | ||
3.3 Virus-induced gene silencing (VIGS) and transient expression analysis
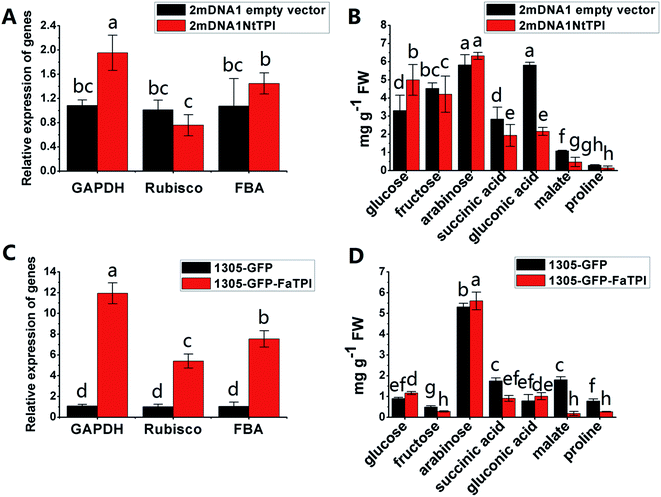
In order to further elucidate the role of some identified proteins in strawberry development and ripening. The corresponding genes of FaTPI, FaPAL, FaMDH and FaME, which were proposed to be key participants in primary and secondary metabolism in strawberry, were selected for transient overexpression analysis in Nicotiana benthamiana. And the Nicotiana tabacum genes NtTPI, NtPAL, NtMDH and NtME which shared the same KEGG and GO annotations and high homology with targeted genes in strawberry were selected for VIGS assay in Nicotiana tabacum. As shown in Fig. S1A,† the typical white-yellow phenotype of Su silencing gene was observed in newly developed tissues of 2mDNA1-NtSu infected plants, indicating the Su gene was successfully silenced in the tobacco plants. Compared with the control, green fluorescence was observed in all plants agroinoculated with 1305-GFP derived or empty vector (Fig. S1B†), suggesting the target strawberry genes were successfully overexpressed in incubated tobacco. Moreover, the results of RT-qPCR showed that the transcript expression of NtSu decreased by 84.98% in 2mDNA1-NbSu incubated tobacco. Meanwhile, the silencing efficiency of NtTPI, NtPAL, NtMDH and NtME in corresponding gene-silenced plants were 67.77%, 71.62%, 72.58% and 71.30% (Fig. S1C†), respectively.It was shown that the expression of NtGAPDH increased in both 2mDNA1NtTPI or 1305-GFP-FaTPI agroinoculated tobacco plants, whereas the expression of NtRubisCO and NtFBA were only induced in 1305-GFP-FaTPI infected tobacco (Fig. 5A and C). Nevertheless, the analysis of the primary metabolites indicated that the changes of glucose, arabinose, succinic acid and malate were similar in tobacco overexpressing FaTPI and silencing NtTPI, and the content of fructose and malate decreased by 43.64% and 89.71% respectively in 1305-GFP-FaTPI infected tobaccos; while the content of gluconic decreased to 41.34% in 2mDNA1NtTPI agroincubated tobacco plants compared to those in tobacco plants inoculated with empty vectors.
The NtCHI and FaCHI expression was inhibited in NtPAL silenced and was induced in FaPAL overexpressed tobacco plants, respectively (Fig. 6A and C). Moreover, the accumulation of phenylalanine, which showed a contrary trend with the expression levels of NtCHI and NtCHI, decreased by 61.89% in FaPAL overexpressed tobacco plants compared to the tobacco plants with the empty vector (Fig. 6D).
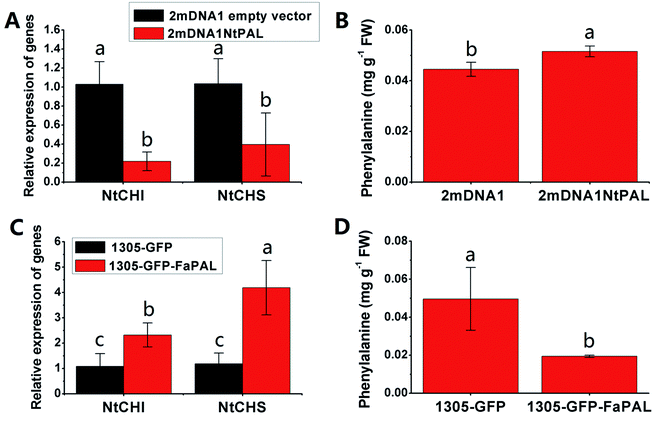 | ||
| Fig. 6 Transient expression assay of NtPAL and FaPAL genes in tobacco plants. (A) Relative gene expression in 2mDNA1 empty and 2mDNA1-NtMDH infected tobacco plants; (B) changes of phenylalanine contents in 2mDNA1 empty and 2mDNA1-NtPAL infected tobacco plants (C) relative gene expression in 1305-GFP empty and 1305-GFP-FaPAL infected tobacco plants; (D) changes of phenylalanine contents in 1305-GFP empty and 1305-GFP-FaPAL infected tobacco plants, the others were the same with that in Fig. 5. | ||
The NtME expression was not significantly different between tobacco plants expressing 2mDNA1NtMDH and 2mDNA1 empty vectors, and the NtPEPC expression was induced in 2mDNA1NtMDH infected tobaccos. The expression of NtME was remarkably induced and the expression of NtPEPC was slightly inhibited in 1305-GFP-FaMDH infected tobacco compared to the tobacco plants with the empty vector (Fig. 7A and C). Regarding the primary metabolites analysis, the accumulation of threonic acid was enhanced (4.12-fold) and the content of citric acid was decreased by 58.32% in FaMDH overexpressed tobaccos compared to control (Fig. 7D). It is worthwhile to mention that the NtME and NtPEPC expression in FaME overexpressed tobaccos were both significantly up-regulated compared to that with the empty vector. Nevertheless, there was no significantly difference observed between 2mDNA1NtME and 2mDNA1 incubated tobaccos (Fig. 8A and C). Additionally, the content of threonic acid in 1305-GFP-FaME infected tobaccos was increased to 5.15-fold level, and the citric acid was decreased to 59.08%, in comparison to that in 1305-GFP empty vector infected sample. The accumulation of malate was inhibited in both 1305-GFP-FaME and 2mDNA1NtME infected tobacco plants in contrast to that in 2mDNA1 or 1305-GFP empty vector infected plants (Fig. 8B and D).
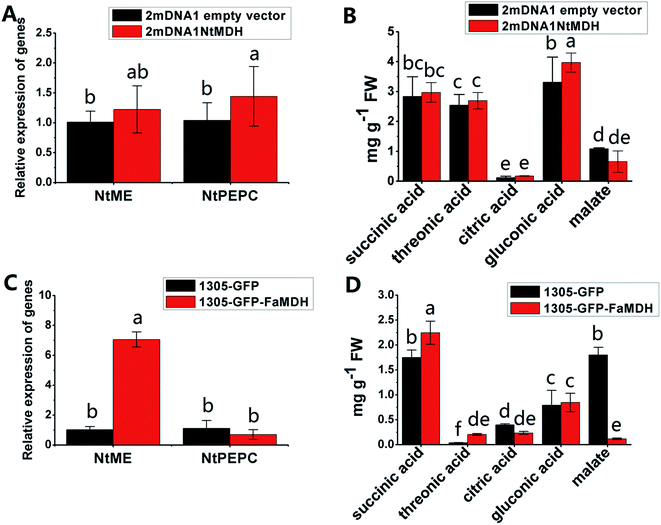 | ||
| Fig. 7 Transient expression assay of NtMDH and FaMDH genes in tobacco plants. (A) Relative gene expression in 2mDNA1 empty and 2mDNA1-NtMDH infected tobacco plants; (B) changes of primary metabolites in 2mDNA1 empty and 2mDNA1-NtMDH infected tobacco plants (C) relative gene expression in 1305-GFP empty and 1305-GFP-FaMDH infected tobacco plants; (D) changes of primary metabolites in 1305-GFP empty and 1305-GFP-FaMDH infected tobacco plants, the others were the same with that in Fig. 5. | ||
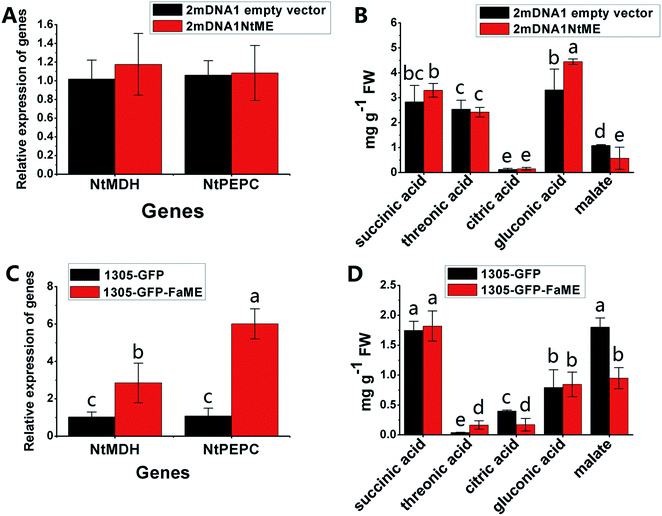 | ||
| Fig. 8 Transient expression assay of NtME and FaME genes in tobacco plants. (A) Relative gene expression in 2mDNA1 empty and 2mDNA1-NtME infected tobacco plants; (B) changes of primary metabolites in 2mDNA1 empty and 2mDNA1-NtME infected tobacco plants (C) relative gene expression in 1305-GFP empty and 1305-GFP-FaME infected tobacco plants; (D) changes of primary metabolites in 1305-GFP empty and 1305-GFP-FaME infected tobacco plants, the others were the same with that in Fig. 5. | ||
4. Discussion
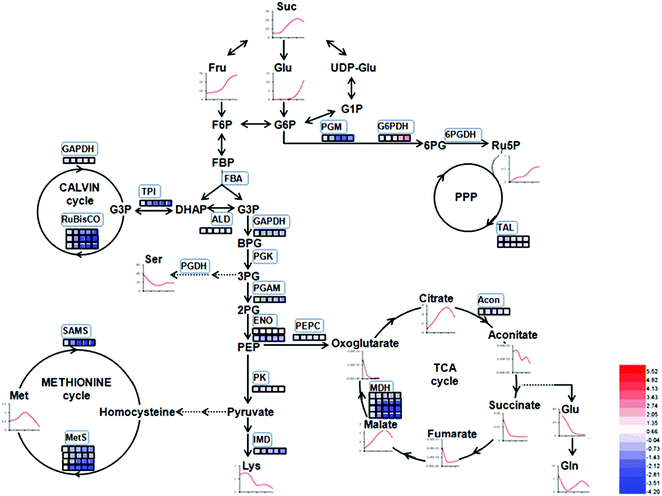
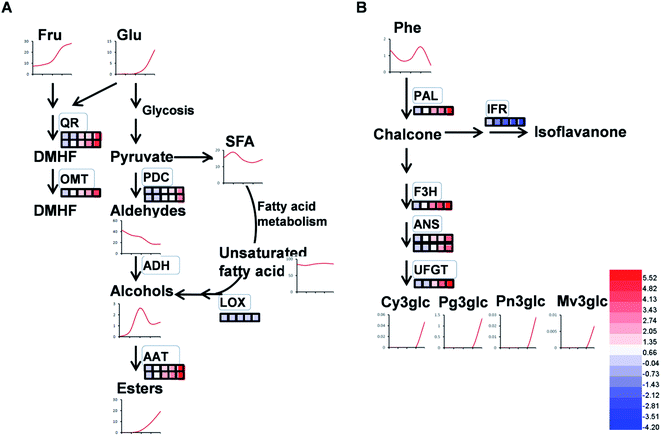
‘Benihoppe’ strawberry, ‘Akihime’ × ‘Sachinoka’ progenies, exhibits the characteristics including large size, rich flavor, firm texture, and has become one of the main strawberry cultivars in China. It has been widely known to be a rich source of the primary and the secondary metabolites.27,28 In this study, we applied iTRAQ to characterize the significant changes in proteins abundance that may be related to fruit metabolism during ripening and to obtain a global view of ‘Benihoppe’ strawberry ripening from a proteomic standpoint. The identified proteins were associated with the primary and the secondary (including volatile compounds and flavonoids) metabolisms, antioxidant and defense systems, as well as protein and amino acid metabolism. To gain a better understanding the molecular machineries involved in strawberry development at the proteomic level, the protein profiles and the functional categories and metabolic pathways with which they are associated were analysed (Fig. 9 and 10). The significantly abundant proteins encoding genes expression involved in primary and secondary metabolism were firstly verified by the transient expression assay in the present study.4.1 Proteins related to carbohydrate and energy metabolism
Carbohydrate and energy metabolism play a vital role in strawberry development and provide energy and the precursors for metabolism of secondary substances, such as pigments and aromatic compounds. Previous research has shown that differentially abundant proteins in grape berry flesh at different developmental stages are mainly related to carbohydrate and organic acid metabolism.29 In the present study, three proteins of ribulose 1,5-bisphosphate carboxylase/oxygenase (RuBisCO, gi|116672873, gi|17154560 and gi|22859628) were identified and showed a significant decreasing trend with development, which was consistent with that of other non-climacteric fruit of grape berry and sweet cherry.15,29–31 This decrease could be due to the drop of photosynthetic activity which related to fruit development.32 The relative expression of RuBisCO genes was highest at the big green stage but was not significantly different from other developmental stages (Fig. S2†). It has been previously reported widely that glycolysis decreases after veraison in similar fruit such as grape pulp, seeds, and skin.33 Compare to SG, the significantly lower abundance of chloroplastic triose phosphate isomerase (TPI, gi|13431949) at BG and other developmental stages also supports a decrease in photosynthetic activity. However, the mRNA expression of TPI showed the highest level in white stage (Fig. S2†). Moreover, the role of TPI involved in the flux from carbohydrate compounds to organic acids was evident as the TPI silence significantly decreased the contents of succinic acid and gluconic acid; whereas the TPI over-expression also significantly decreased the succinic acid content in transient assay (Fig. 5). The same accumulation pattern of succinic acid in both TPI silenced and over-expressed tobaccos due probably to the reversibility and ubiquitous of the catalytic action of the corresponding proteins and genes of TPI.34 The overall down-regulation of photosynthesis related proteins in the present study is in consistent with observations of both mango and grape development.15,35Two additional proteins in the glycolytic pathway, enolase (ENO) and pyruvate kinase (PK) were identified. The abundance of one ENO (gi|238814974) increased significantly with development, which was in consistent with the previous research on apricot ENOs during fruit ripening.36 The abundance of the terminal protein cytosolic PK (gi|225441044) increased slightly with strawberry development, which was in line with previous research on apples.37 The abundance of the phosphoglucomutase (PGM, gi|15220668) protein, which converts the glucose 1-phosphate to glucose 6-phosphate, was reduced significantly with development, which was in agreement with the previous research in mangos that the carbon flow is decreased during ripening through the glycolysis pathway, together with the down-regulated expression level of PGM.35 The identified proteins involved in carbon metabolism include a malic enzyme (ME, gi|148807201) and three malate dehydrogenases (MDHs, gi|259414628, gi|21388552 and gi|162464321), and all of them decreased in abundance with a minimum at the TU or RF stage. The profile of MDHs was correlated with observed increases in malate content (Fig. 1). The carbon source for malate biosynthesis is provided by imported carbohydrates and photosynthesis during fruit development.38 The resulting malate is likely utilized as a respiratory substrate in the TCA cycle or converted to pyruvate via ME.39 The decrease of NAD-dependent ME has been shown to affect the glycolytic flux.38 The decreasing trend of MDHs indicate a suppression of oxaloacetate in the TCA cycle (Fig. 1). The actively synthesized and accumulated malate in strawberries before the turning stage is similar to non-climacteric grapes,30 and the decreasing trend of MDHs has also been observed in ripening of sweet cherry.31 Similar to trends of TPI, ME transcript levels during strawberry development was unimodal with a peak at the turning stage (Fig. S2†). The phosphoenolpyruvate carboxylase protein (PEPC, gi|294864784) is a key enzyme involved in malate metabolism. By transient assay, results demonstrated that overexpression of FaME up regulated the expression of NtPEPC in tobacco plants, and overexpression of FaME and FaMDH both dramatically increased the content of threonic acid and decreased the accumulation of malate. Additionally, overexpression of FaME decreased the accumulation of citric acid and overexpression of FaMDH increased the accumulation of succinic acid, respectively. Indicating the potential important roles of FaME and FaMDH in carbohydrate metabolism in ripening strawberry fruit. Other metabolic pathways for energy production such as the pentose phosphate pathway (PPP), the TCA cycle, and the electron transport chain contribute to the supply of ATP to sustain respiration in strawberry.21 The abundance of glucose-6-phosphate dehydrogenase (G6PDH) increased significantly during development, indicating an acceleration of the PPP pathway.
4.2 Proteins associated with volatile production
As expected, the production of total volatiles increased significantly as strawberry ripening and was positively correlated with ester and acid contents, while that negatively correlated to total alcohol content (Table 1). Volatile biosynthesis was also correlated with pyruvate decarboxylases (PDC, gi|10121330 and gi|17225598), alcohol acyltransferases (AAT, gi|10121328 and gi|254771939), quinone oxidoreductase (QR, gi|15808674 and gi|259414628) and O-methyltransferase (OMT, gi|6760443). The abundance of these volatile-related proteins was up-regulated during strawberry ripening, consistent with previous results of PDC expression during pear development and the report of AAT in previous strawberry research.12,40 Our results provide proteomic evidence that increased abundance of both PDC and AAT contribute to ester biosynthesis during strawberry development. The gene expressions of PDC, AAT, QR and OMT were 10 to100 times higher than their protein expressions (Fig. S3†), probably due to post-translation and post-transcription events.12In addition to ester compounds, a number of volatile furanone compounds were also identified in the present study, such as furaneol [4-hidroxy-2,5-dimethyl(2,3H), DMHF, furanone] and 4-methyoxy-2,5-dimethyl-3(2H)-furanone (DMMF, mesifurane). The concentrations of these compounds in strawberry are maturity-dependent. The methylation of DMMF and the accumulation of furanones in strawberry were reported controlled by OMT and contributed to the variation of mesifurane content.41 In the present study, there was a significant increase in OMT protein and transcript abundance with strawberry development as well as an increase of DMMF concentration (Fig. 10A), which was in agreement with measured OMT abundance in peaches during early development.42 Two quinone oxidoreductases (gi|15808674 and gi|29468088) were also significantly increased by strawberry development, which was consistent with previous studies of strawberries.5 The QR protein is an enone oxidoreductase in DMMF biosynthesis and the balance between DMHF and DMMF. In the present study, QR abundance was consistent with other characteristic volatiles during strawberry development (Fig. 10A), the results provided evidence for the contribution of QR in fruit quality during ripening. The relative expression level of OMT and QRin the present study were in agreement with their proteomic expression levels (Fig. S3†), both of them increased during strawberry development. From a targeted quantitative proteomic view, our results provide evidence that QR, PDC, and AAT play vital role in the development of volatile repertoire during strawberry development.43
4.3 Proteins associated with flavonoid biosynthesis
Flavonoids are vital secondary metabolites which relate to the nutritional value and antioxidant capacity in strawberries. The content of some flavonoid compounds increased with development but total phenolic content (TPC) and total flavonoid content (TFC) were relatively constant. It has been previously reported that TFC biosynthesis exhibits two phases during fruit ripening and development with major flavonoid compounds being reduced with ripening.44 Consistent with the present results, the increase of pigmentation in strawberry resulted from the accumulation of glycosylated cyanidins and higher amounts of glycosylated pelargonidins.27 These differences were probably resulted from the different genetic background and different sampled period. The key proteins involved in anthocyanin and flavonoid biosynthesis were phenylalanine ammonia-lyase (PAL, gi|39777534), flavanone 3-hydroxylase (F3H, gi|51493451), anthocyanidin synthases (ANSs, gi|51872681 and gi|51872683) and UDP glucose: flavonoid-3-O-glucosyltransferase (UFGT, gi|46370000). The abundance of these proteins increased significantly during strawberry development, coincided with the synthesis of anthocyanin pigments, which was a previously reported increase in the abundance of PAL, F3H, ANS, UFGT at targeted proteomic and genomic levels has shown correlation with anthocyanin accumulation in fruit of more advanced ripeness.45 The expression profiles of PAL, F3H, ANS, and UFGT reveal that up-regulation during anthocyanin biosynthesis contributes to the red pigments in ripe strawberry fruit. A similar correlation between F3H and anthocyanins was found in red grape by Deytieux et al.15 It has been reported that the UFGT protein level was over-expressed four to nine fold at the end of color-change in grape skin development.15 As expected, the phenylalanine content in transient study was increased by silenced PAL and was decreased by over-expressed PAL, both significantly (Fig. 6B and D). Moreover, the expression level of CHI, which was widely regarded to play key role in PAL pathway, was inhibited in PAL silenced and was induced in PAL overexpressed tobaccos, respectively (Fig. 6A and C). These results further indicated the pivotal of PAL in strawberry ripening. Isoflavone reductase IFR catalyzes the NADPH-dependent reduction in phenylpropanoid pathway. The observed down-regulation of isoflavonoid biosynthesis has also been observed in other strawberry varieties.5 As expected, the variable pattern in mRNA of the PAL, F3H, ANS, UFGT and IFR encoding genes was highly correlated with the corresponding protein profiles (Fig. S4†), indicating the biosynthesis of flavonoids in strawberry fruit were ripening-regulated.4.4 Proteins associated with redox and antioxidant system
Redox homeostasis is the balancing level between the physiological response and the environmental oxidative stress. The ascorbate–glutathione cycle is of great importance in the cellular antioxidant system.46 Ascorbate peroxidase (APX) is a key protein participated in the H2O2 detoxification, and the over-expression of APX in fruit boosts tolerance to chilling and salt stress.22 APXs (gi|15808779 and gi|5257552) abundance showed two peaks in the white fruit and ripe fruit stages, indicating elevated flow from ascorbate to monodehydroascorbate in detoxification reactions. In contrast, the expression level of APX encoding gene was gradually increased to the highest level at the red ripe stage (Fig. S4†). The abundance of both the cytoplasmic Cu/Zn-SOD (gi|95106179) and leaf catalase (CAT, gi|3202032) did not show any significant difference during strawberry development. However, due to the presence of climacteric feature, the Cu/Zn-SOD showed up-regulation during ripening of papaya,47 apricot36,48 and tomato.19 It has been suggested that antioxidant protein profiles are correlated with respiratory bursts during fruit ripening and senescence.49 It is worthwhile to mention another protein nucleoside diphosphate kinase (NDK, gi|47026989), which is recognized as a phosphoprotein, were reported involved with CAT as well as ROS resistance.50 In the present study, the abundance of NDK showed relatively higher levels in the turning fruit phase.Peroxiredoxin (PrxR) plays a important role in plant development. It has been suggested that PrxR is involved in redox sensing and homeostasis to protect strawberry tissues against the environmental stimuli during development.51 The 1-cys PrxR (gi|54306593) and 2-cys PrxR (gi|269980509) were significantly reduced during strawberry development, which was in agreement with the report in a decrease of in USB35, Miss, Honeoye, and Mira cultivars of strawberry fruit that there was a decrease of 1-cys PrxR expression during fruit ripening.5,14 The decrease of PrxR indicates a direct or indirect reduction of NADPH or ferredoxin power in ROS scavenging system.
4.5 Allergens and defense response proteins
Allergen proteins involved in fruit protections responded to environmental stress stimuli.52 The abundance of four allergen proteins, fra a 1 (gi|74197562), fra a 1-B (gi|90185678), fra a 1-C (gi|90185686) as well as non-specific lipid transfer proteinprecursor (nsLTP, gi|67937775) significantly decreased with development, while the fra a 2 allergen protein (gi|260600660) significantly increased at the turning and ripe fruit stages. Previous research has shown that the isoforms of fra a proteins could bind and transport flavonoids intermediated within cell cytosol or through membranes.53,54 The fra a1 protein was reported response to environmental stress stimuli and was poorly correlated with antioxidant characteristics in strawberry fruit.55 The fra a 2 and nsLTP proteins were essential for flavonoid biosynthesis in strawberry.53 The nsLTP genes and the encoded proteins have reported to accumulated with development in several Rosacea fruit, such as apple56 and peach.57 Consistently, the expression level of Bet v 1 homologous allergen is down-regulated at coincidently with the activity of flavonoids biosynthesis enzymes (FaF3H, FaDFR, and FaCHS) in white-fruited cultivars.17 The expression of fra a 1, fra a 2 and nsLTP encoding genes during strawberry development exhibited low correlations with protein abundance (Fig. S3†), likely due to the post-transcriptional and post-translational modifications.58The heat shock proteins (HSPs) are a family of proteins that protect against oxidative damage when cells are expose to stress such as the thermal shock, free radicals, and oxidative injury.59 The accumulation of HSPs is associated with the regulatory mechanisms of fruit ripening.14,30,60 In total six HSPs70 (gi|1143427, gi|123601, gi|254558248, gi|3023068, gi|6911549, gi|6911551) proteins were detected in the present study. HSPs of different molecular weights have shown to contribute to oxidative stress response during the development and senescence of fruit.14 HSPs play a pivotal role in the protection against oxidative stimuli by stabilizing the old and newly synthesized proteins,61 or by re-establishing the protein conformation.62
The aldo/keto reductase (AKR, gi|53988164) protein is involved in the detoxification of toxic compounds. The present result of up-regulated AKR abundance during strawberry development was consistent with the induction of AKR in papaya ripening,47 which revealed the common profiles of AKR expression between non-climacteric strawberry and climacteric papaya.
4.6 Protein and amino acid synthesis, degradation and folding
Proteasome is associated with the degradation of ubiquitinated proteins and contributes to regulation of protein abundance related to cellular processes,63 the expression level of the proteasome, elongation factors, and ribosomal protein also indicate cellular response to oxidative stress.64 In the present study, four proteasome protein units (gi|225442079, gi|255552111, gi|3421123 and gi|77745479) were identified and quantified, and only the abundance of 26S proteasome subunit 4 like (gi|77745479) was increased during development. The abundance of most identified elongation factors and ribosomal proteins were decreased during strawberry development, with the exception of a significant increase of ribosomal protein S5 family protein (gi|238479752).Methionine in fruit was a precursor of several metabolic processes, such as ethylene biosynthesis,65 polyamine synthesis, and protein synthesis.66 In the present study, the decreased abundance of methionine synthases (METs, gi|115361539, gi|151347486, gi|219522337 and gi|71000469) coincided with a decrease in 5-methyltetrahydropteroyltriglutamate-homocysteinemethyltransferase (gi|255569484), which catalyzes the formative of methionine. The synergic actions of these protein expressions contribute to Met accumulations during strawberry development (Fig. 2). This result suggests a decreased demand for MET biosynthesis.5 It has been reported that the abundance of MET proteins in citrus fruit decreases at early development stages and then increases in later development stages.67 S-Adenosyl-L-homocysteine hydrolase, is the enzyme involved in AdoMet-dependent transmethylations, has been shown to decrease with development.35 Results indicate that the methionine metabolism (Yang cycle) is inhibited by ripening and development, which was in agreement with the results from mango fruit.35
5. Conclusions
In the present study, proteins involved in primary and secondary metabolism at five developmental stages of strawberry fruit ripening were identified using the quantitatively proteomic approach in parallel with metabolic and transcriptional profiling, and the function of important genes involved in carbohydrate metabolism such as TPI, PAL, MDH and ME were conserved in Nicotiana via the transient expression assay. The results demonstrate that proteomic, coupled with metabolic profiling, represents a promising approach in the analysis of plant complexity. Proteomic profiling of the non-climacteric strawberry fruit in conjunction with metabolic shifts and expression validates the existence of genes involved in the primary/secondary metabolisms as well as stress and defense systems during strawberry development. Both the metabolomic and proteomic profiling allow a comprehensive understanding of the complexity of the biological entity under study. Further research should focus on the comprehensive investigation of targeted proteins employing multiple reactions monitoring (MRM) and protein–protein interactive networks to fully understand the mechanism of fruit development and senescence.Contributions
Conceived and designed the experiments: Li Li and Zisheng Luo; Methodology, Qiongwu; Software, Youyong Wang; Validation, Morteza Soleimani Aghdam, Dong Li and Zisheng Luo; Formal analysis, Hongyan Lu, and Jiawei Yan; Investigation and resources, Zhaojun Ban and Xiaochen Zhang; Data curation, Qiong Wu; Wrote the paper: Li Li and Qiong Wu; Writing-review and editing, Jarukitt Limwachiranon and Zisheng Luo; Visualization and supervision, Li Li and Zisheng Luo; Project administration, Zisheng Luo; Funding acquisition, Li Li.Conflicts of interest
There are no conflicts to declare.Acknowledgements
This work was supported by the grants of The National Key Research and Development Program of China (2017YFD0401304), and was supported by Key Laboratory of Storage of Agro-products, Ministry of Agriculture (Kf2018009).References
- J. J. Giovannoni, Plant Cell, 2004, 16, S170–S180 CrossRef CAS PubMed.
- V. Shulaev, D. J. Sargent, R. N. Crowhurst, T. C. Mockler, O. Folkerts, A. L. Delcher, P. Jaiswal, K. Mockaitis, A. Liston, S. P. Mane, P. Burns, T. M. Davis, J. P. Slovin, N. Bassil, R. P. Hellens, C. Evans, T. Harkins, C. Kodira, B. Desany, O. R. Crasta, R. V. Jensen, A. C. Allan, T. P. Michael, J. C. Setubal, J.-M. Celton, D. J. G. Rees, K. P. Williams, S. H. Holt, J. J. R. Rojas, M. Chatterjee, B. Liu, H. Silva, L. Meisel, A. Adato, S. A. Filichkin, M. Troggio, R. Viola, T.-L. Ashman, H. Wang, P. Dharmawardhana, J. Elser, R. Raja, H. D. Priest, D. W. Bryant Jr, S. E. Fox, S. A. Givan, L. J. Wilhelm, S. Naithani, A. Christoffels, D. Y. Salama, J. Carter, E. L. Girona, A. Zdepski, W. Wang, R. A. Kerstetter, W. Schwab, S. S. Korban, J. Davik, A. Monfort, B. Denoyes-Rothan, P. Arus, R. Mittler, B. Flinn, A. Aharoni, J. L. Bennetzen, S. L. Salzberg, A. W. Dickerman, R. Velasco, M. Borodovsky, R. E. Veilleux and K. M. Folta, Nat. Genet., 2010, 43, 109 CrossRef PubMed.
- H. Hirakawa, K. Shirasawa, S. Kosugi, K. Tashiro, S. Nakayama, M. Yamada, M. Kohara, A. Watanabe, Y. Kishida, T. Fujishiro, H. Tsuruoka, C. Minami, S. Sasamoto, M. Kato, K. Nanri, A. Komaki, T. Yanagi, Q. Guoxin, F. Maeda, M. Ishikawa, S. Kuhara, S. Sato, S. Tabata and S. N. Isobe, DNA Res., 2014, 21, 169–181 CrossRef CAS PubMed.
- J. M. Palma, F. J. Corpas and L. A. del Rio, J. Proteomics, 2011, 74, 1230–1243 CrossRef CAS PubMed.
- L. Li, J. Song, W. Kalt, C. Forney, R. Tsao, D. Pinto, K. Chisholm, L. Campbell, S. Fillmore and X. Li, J. Proteomics, 2013, 94, 219–239 CrossRef CAS PubMed.
- T. M. Montero, E. M. Mollá, R. M. Esteban and F. J. López-Andréu, Sci. Hortic., 1996, 65, 239–250 CrossRef.
- A. Fait, K. Hanhineva, R. Beleggia, N. Dai, I. Rogachev, V. J. Nikiforova, A. R. Fernie and A. Aharoni, Plant Physiol., 2008, 148, 730–750 CrossRef CAS PubMed.
- A. G. Pérez, J. J. Rios, C. Sanz and J. M. Olías, J. Agric. Food Chem., 1992, 40, 2232–2235 CrossRef.
- X. O. Guo, J. J. Xu, X. H. Cui, H. Chen and H. Y. Qi, BMC Plant Biol., 2017, 17, 28 CrossRef PubMed.
- J. Lücker, M. Laszczak, D. Smith and S. T. Lund, BMC Genomics, 2009, 10, 50 CrossRef PubMed.
- J. Wu, Z. Xu, Y. Zhang, L. Chai, H. Yi and X. Deng, J. Exp. Bot., 2014, 65, 1651–1671 CrossRef CAS PubMed.
- J. M. Li, X. S. Huang, L. T. Li, D. M. Zheng, C. Xue, S. L. Zhang and J. Wu, Planta, 2015, 241, 1363–1379 CrossRef CAS PubMed.
- X. Pan, B. Zhu, H. Zhu, Y. Chen, H. Tian, Y. Luo and D. Fu, J. Proteome Res., 2014, 13, 1979–1993 CrossRef CAS PubMed.
- L. Bianco, L. Lopez, A. G. Scalone, M. Di Carli, A. Desiderio, E. Benvenuto and G. Perrotta, J. Proteomics, 2009, 72, 586–607 CrossRef CAS PubMed.
- C. Deytieux, L. Geny, D. Lapaillerie, S. Claverol, M. Bonneu and B. Donèche, J. Exp. Bot., 2007, 58, 1851–1862 CrossRef CAS PubMed.
- A. Herndl, G. Marzban, D. Kolarich, R. Hahn, D. Boscia, W. Hemmer, F. Maghuly, E. Stoyanova, H. Katinger and M. Laimer, Electrophoresis, 2007, 28, 437–448 CrossRef CAS PubMed.
- K. Hjernø, R. Alm, B. Canbäck, R. Matthiesen, K. Trajkovski, L. Björk, P. Roepstorff and C. Emanuelsson, Proteomics, 2006, 6, 1574–1587 CrossRef PubMed.
- R. Pedreschi, M. Hertog, J. Robben, J. P. Noben and B. Nicolaï, Postharvest Biol. Technol., 2008, 50, 110–116 CrossRef CAS.
- M. Rocco, C. D'Ambrosio, S. Arena, M. Faurobert, A. Scaloni and M. Marra, Proteomics, 2006, 6, 3781–3791 CrossRef CAS PubMed.
- R. Alm, A. Ekefjärd, M. Krogh, J. Häkkinen and C. Emanuelsson, J. Proteome Res., 2007, 6, 3011–3020 CrossRef CAS PubMed.
- L. Li, D. Li, Z. Luo, X. Huang and X. Li, Sci. Rep., 2016, 6, 27094 CrossRef CAS PubMed.
- L. Li, Z. Luo, X. Huang, L. Zhang, P. Zhao, H. Ma, X. Li, Z. Ban and X. Liu, J. Proteomics, 2015, 120, 44–57 CrossRef CAS PubMed.
- U. Roessner, A. Luedemann, D. Brust, O. Fiehn, T. Linke, L. Willmitzer and A. R. Fernie, Plant Cell, 2001, 13, 11–29 CrossRef CAS.
- C. Y. Wan and T. A. Wilkins, Anal. Biochem., 1994, 223, 7–12 CrossRef CAS PubMed.
- X. F. Cui, X. R. Tao, Y. Xie, C. M. Fauquet and X. P. Zhou, J. Virol., 2004, 78, 13966–13974 CrossRef CAS PubMed.
- C. Huang, Y. Xie and X. Zhou, Plant Biotechnol. J., 2009, 7, 254–265 CrossRef CAS PubMed.
- K. Aaby, D. Ekeberg and G. Skrede, J. Agric. Food Chem., 2007, 55, 4395–4406 CrossRef CAS PubMed.
- A. Aharoni, L. C. P. Keizer, H. C. Van Den Broeck, R. Blanco-Portales, J. Muñoz-Blanco, G. Bois, P. Smit, R. C. H. De Vos and A. P. O'Connell, Plant Physiol., 2002, 129, 1019–1031 CrossRef CAS PubMed.
- M. J. Martínez-Esteso, S. Sellés-Marchart, D. Lijavetzky, M. A. Pedreño and R. Bru-Martínez, J. Exp. Bot., 2011, 62, 2521–2569 CrossRef PubMed.
- M. Giribaldi, I. Perugini, F. X. Sauvage and A. Schubert, Proteomics, 2007, 7, 3154–3170 CrossRef CAS PubMed.
- B. Prinsi, A. S. Negri, L. Espen and M. C. Piagnani, J. Agric. Food Chem., 2016, 64, 4171–4181 CrossRef CAS PubMed.
- B. Prinsi, A. S. Negri, C. Fedeli, S. Morgutti, N. Negrini, M. Cocucci and L. Espen, Phytochemistry, 2011, 72, 1251–1262 CrossRef CAS PubMed.
- A. S. Negri, B. Prinsi, M. Rossoni, O. Failla, A. Scienza, M. Cocucci and L. Espen, BMC Genomics, 2008, 9, 378 CrossRef PubMed.
- S. Dorion, Parveen, J. Jeukens, D. P. Matton and J. Rivoal, Plant Sci., 2005, 168, 183–194 CrossRef CAS.
- J. D. M. Andrade, T. T. Toledo, S. B. Nogueira, B. R. Cordenunsi, F. M. Lajolo and J. R. O. do Nascimento, J. Proteomics, 2012, 75, 3331–3341 CrossRef CAS PubMed.
- W. Zhang, X. Li, L. Li, Y. Tang, W. Qi, X. Liu, L. Qiao, W. Wang and X. Jia, J. Hortic. Sci. Biotechnol., 2017, 92, 261–269 CrossRef CAS.
- M. Li, D. Li, F. Feng, S. Zhang, F. Ma and L. Cheng, J. Exp. Bot., 2016, 67, 5145–5157 CrossRef CAS PubMed.
- C. Sweetman, L. G. Deluc, G. R. Cramer, C. M. Ford and K. L. Soole, Phytochemistry, 2009, 70, 1329–1344 CrossRef CAS PubMed.
- E. Katz, K. H. Boo, H. Y. Kim, R. A. Eigenheer, B. S. Phinney, V. Shulaev, F. Negre-Zakharov, A. Sadka and E. Blumwald, J. Exp. Bot., 2011, 62, 5367–5384 CrossRef CAS PubMed.
- A. Aharoni, L. C. P. Keizer, H. J. Bouwmeester, Z. Sun, M. Alvarez-Huerta, H. A. Verhoeven, J. Blaas, A. M. M. L. Van Houwelingen, R. C. H. De Vos, H. Van Der Voet, R. C. Jansen, M. Guis, J. Mol, R. W. Davis, M. Schena, A. J. Van Tunen and A. P. O'Connell, Plant Cell, 2000, 12, 647–661 CrossRef CAS.
- Y. Zorrilla-Fontanesi, J.-L. Rambla, A. Cabeza, J. J. Medina, J. F. Sánchez-Sevilla, V. Valpuesta, M. A. Botella, A. Granell and I. Amaya, Plant Physiol., 2012, 159, 851 CrossRef CAS PubMed.
- T. A. Colquhoun, J. Y. Kim, A. E. Wedde, L. A. Levin, K. C. Schmitt, R. C. Schuurink and D. G. Clark, J. Exp. Bot., 2011, 62, 1133–1143 CrossRef CAS PubMed.
- J. Song, L. Du, L. Li, L. C. Palmer, C. F. Forney, S. Fillmore, Z. Zhang and X. Li, J. Proteomics, 2015, 126, 288–295 CrossRef CAS PubMed.
- H. Halbwirth, I. Puhl, U. Haas, K. Jezik, D. Treutter and K. Stich, J. Agric. Food Chem., 2006, 54, 1479–1485 CrossRef CAS PubMed.
- J. Song, L. Du, L. Li, W. Kalt, L. C. Palmer, S. Fillmore, Y. Zhang, Z. Zhang and X. Li, J. Proteomics, 2015, 122, 1–10 CrossRef CAS PubMed.
- C. H. Foyer and G. Noctor, Plant Cell, 2005, 17, 1866–1875 CrossRef CAS PubMed.
- J. Á. Huerta-Ocampo, J. A. Osuna-Castro, G. J. Lino-López, A. Barrera-Pacheco, G. Mendoza-Hernández, A. De León-Rodríguez and A. P. Barba de la Rosa, J. Proteomics, 2012, 75, 2160–2169 CrossRef CAS PubMed.
- C. D'Ambrosio, S. Arena, M. Rocco, F. Verrillo, G. Novi, V. Viscosi, M. Marra and A. Scaloni, J. Proteomics, 2013, 78, 39–57 CrossRef PubMed.
- R. Nilo P, R. Campos-Vargas and A. Orellana, J. Proteomics, 2012, 75, 1618–1638 CrossRef CAS PubMed.
- M. E. Haque, Y. Yoshida and K. Hasunuma, Planta, 2010, 232, 367–382 CrossRef CAS PubMed.
- B. N. Tripathi, I. Bhatt and K.-J. Dietz, Protoplasma, 2009, 235, 3 CrossRef CAS PubMed.
- R. Pedreschi, E. Vanstreels, S. Carpentier, M. Hertog, J. Lammertyn, J. Robben, J. P. Noben, R. Swennen, J. Vanderleyden and B. M. Nicolaï, Proteomics, 2007, 7, 2083–2099 CrossRef CAS PubMed.
- C. Muñoz, T. Hoffmann, N. M. Escobar, F. Ludemann, M. A. Botella, V. Valpuesta and W. Schwab, Mol. Plant, 2010, 3, 113–124 CrossRef PubMed.
- C. Muñoz, J. F. Sánchez-Sevilla, M. A. Botella, T. Hoffmann, W. Schwab and V. Valpuesta, J. Agric. Food Chem., 2011, 59, 12598–12604 CrossRef PubMed.
- S. Tulipani, G. Marzban, A. Herndl, M. Laimer, B. Mezzetti and M. Battino, Food Chem., 2011, 124, 906–913 CrossRef CAS.
- A. I. Sancho, R. Foxall, N. M. Rigby, T. Browne, L. Zuidmeer, R. van Ree, K. W. Waldron and E. N. C. Mills, J. Agric. Food Chem., 2006, 54, 5098 CrossRef CAS PubMed.
- A. Botton, C. Andreotti, G. Costa and A. Ramina, J. Agric. Food Chem., 2009, 57, 724–734 CrossRef CAS PubMed.
- J. Gu, Y. Wang, X. Zhang, S. Zhang, Y. Gao and C. An, Front. Biosci., Landmark Ed., 2010, 15, 826–839 CrossRef CAS.
- M. Faurobert, C. Mihr, N. Bertin, T. Pawlowski, L. Negroni, N. Sommerer and M. Causse, Plant Physiol., 2007, 143, 1327–1346 CrossRef CAS PubMed.
- V. Muccilli, C. Licciardello, D. Fontanini, M. P. Russo, V. Cunsolo, R. Saletti, G. Reforgiato Recupero and S. Foti, J. Proteomics, 2009, 73, 134–152 CrossRef CAS PubMed.
- T. T. Toledo, S. B. Nogueira, B. R. Cordenunsi, F. C. Gozzo, E. J. Pilau, F. M. Lajolo and J. R. O. do Nascimento, Postharvest Biol. Technol., 2012, 70, 51–58 CrossRef CAS.
- A. L. Horwich, Cell, 2014, 157, 285–288 CrossRef CAS PubMed.
- R. D. Vierstra, Nat. Rev. Mol. Cell Biol., 2009, 10, 385–397 CrossRef CAS PubMed.
- M. O. Vega-García, G. López-Espinoza, J. C. Ontiveros, J. J. Caro-Corrales, F. D. Vargas and J. A. López-Valenzuela, J. Am. Soc. Hortic. Sci., 2010, 135, 83–89 Search PubMed.
- S. F. Yang and J. H. Oetiker, J. Jpn. Soc. Hortic. Sci., 1998, 67, 1209–1214 CrossRef CAS.
- S. Ravanel, B. Gakière, D. Job and R. Douce, Proc. Natl. Acad. Sci. U.S.A., 1998, 95, 7805–7812 CrossRef CAS PubMed.
- E. Katz, M. Fon, R. A. Eigenheer, B. S. Phinney, J. N. Fass, D. Lin, A. Sadka and E. Blumwald, Proteome Sci., 2010, 8, 68 CrossRef CAS PubMed.
Footnotes |
| † Electronic supplementary information (ESI) available. See DOI: 10.1039/c9ra00549h |
| ‡ These authors contributed equally to this work. |
| This journal is © The Royal Society of Chemistry 2019 |

