
 Open Access Article
 This Open Access Article is licensed under a Creative Commons Attribution-Non Commercial 3.0 Unported Licence
Development of different deep eutectic solvent aqueous biphasic systems for the separation of proteins†
Jiaojiao Menga,
Yuzhi Wang *a,
Yigang Zhou*b,
Jing Chena,
Xiaoxiao Weia,
Rui Nia,
Ziwei Liua and
Fangting Xua
*a,
Yigang Zhou*b,
Jing Chena,
Xiaoxiao Weia,
Rui Nia,
Ziwei Liua and
Fangting Xua
aState Key Laboratory of Chemo/Biosensing and Chemometrics, College of Chemistry and Chemical Engineering, Hunan University, Changsha, 410082, P. R. China. E-mail: wyzss@hnu.edu.cn; Fax: +86-731-88821848; Tel: +86-731-88821903
bDepartment of Microbiology, College of Basic Medicine, Central South University, Changsha, 410083, P. R. China
First published on 7th May 2019
Abstract
In this work, aqueous biphasic systems (ABSs) formed by different deep eutectic solvents (DESs) were prepared and applied to extract proteins. The five kinds of DESs comprised amino acids and polyols ([amino acids][polyols]). They were combined with another DES resulting from tetrabutylammonium chloride and polypropylene glycol 400 ([TBAC][PPG400]) to form ABSs. The phase-forming abilities of [TBAC][PPG400]/[amino acids][polyols] were compared with those of [TBAC][PPG400]/amino acids and [TBAC][PPG400]/polyols. The results exhibited that the biphasic formation ability of [amino acids][polyols] lies between those of amino acids and polyols when [TBAC][PPG400] acts as the other phase in ABSs. The systems comprising [TBAC][PPG400] and [L-proline][xylitol] ([Pro][Xyl]) were further investigated to optimize the extraction performance. It was found that 97.30% chymotrypsin tended to distribute into the [Pro][Xyl]-rich phase under optimum conditions. The practical application of the system was demonstrated by the extraction of chymotrypsin from porcine pancreas. Besides, UV-Vis spectrophotometry (UV-Vis), Fourier transform infrared spectroscopy (FT-IR), and circular dichroism (CD) spectroscopy proved that the conformation of proteins remained unchanged during the extraction process. The extraction mechanism of the formation of DES–protein aggregates was investigated via conductivity, dynamic light scattering (DLS), and transmission electron microscopy (TEM). The overall results suggest that the DES/DES-based ABSs have outstanding potential in the green extraction of proteins.
1. Introduction
With more emphasis on environmental protection, the concept of green chemistry has arisen and developed rapidly in recent years. In the separation and purification fields, green extraction technologies1 and energy-saving extraction processes with alternative and renewable natural solvents have attracted considerable attention. Among them, the synthesis and usage of green solvents has attracted spotlight in academia. Deep eutectic solvents (DESs) are novel green solvents, which contain hydrogen bond acceptors (HBAs) and hydrogen bond donors (HBDs). Compared with traditional organic solvents, DESs are non-volatile, non-toxic, biodegradable, and thermally stable and exhibit excellent solubility.2–6 Additionally, DESs can be easily obtained by heating two or three components at a proper ratio, and the products need not be purified. Based on this, DESs have been regarded as excellent substitutes for toxic organic solvents in many fields such as catalysis,7 organic synthesis,8 and separation.9–11Proteins are bioactive macromolecules, which play an important role in life activities and have extensive applications in food and medical fields. Therefore, it is crucial to achieve the purification of proteins. The traditional methods involve ion exchange chromatography,12 electrophoresis,13 membrane separation,14,15 and affinity chromatography.16 These methods have some disadvantages such as high cost and complex processes. Aqueous biphasic systems (ABSs)17,18 have emerged as a green extraction technology and they have been intensively studied. ABSs exhibit two immiscible phases. This spontaneously occurs between water-soluble substances when the concentrations of the components exceed the critical point. Compared with traditional liquid–liquid separation methods, both the phases of ABSs contain abundant water, which can provide a moderate environment for biomolecule extraction.19–21 Therefore, ABSs are usually used to extract bioactive molecules such as proteins, nucleic acids, enzymes, and drugs.
Traditional ABSs generally comprise polymers and inorganic salts or different kinds of polymers. As green solvents, ionic liquids (ILs)22,23 are used in ABSs to widen the scope of liquid–liquid separation. IL-based ABSs were first reported by Bridges in 2003.24 Then, more and more researchers focused on the application of these systems in biological separation because of their remarkable biocompatibility, excellent extraction efficiency, and short separation time. However, ILs have the drawbacks of complex synthesis and purification processes. Also, some ILs contain pyridinium or imidazolium ions, which are not completely environment-friendly. To avoid these disadvantages, DESs as novel green solvents can replace ILs to form ABSs for the extraction of biomolecules. Li et al. explored a series of new green DESs and constructed DES-based ABSs to extract proteins.25 Zhang et al. investigated the ABSs formed by novel PEG-based DESs and used them for RNA extraction.26 Xu et al. discovered novel ABSs composed of ILs and DESs for DNA extraction.27
To further enrich the category of ABSs, ABSs composed of two different DESs are studied in this work. Herein, one kind of DES comprised tetrabutylammonium chloride and polypropylene glycol 400 ([TBAC][PPG400]), while five other types of DESs were based on amino acids and polyols ([amino acids][polyols]). The phase-forming capacity of [TBAC][PPG400]/[amino acids][polyols]-based ABSs was discussed by making a comparison with those of [TBAC][PPG400]/amino acids and [TBAC][PPG400]/polyols. To assess the extraction ability of these ABSs, proteins were selected as the target analytes in this study. Furthermore, the studied ABSs were employed to investigate the influences of some factors on the extraction process. The porcine pancreas was utilized to explore the practical application of this system. At last, the conformation of the proteins was ascertained by UV-Vis spectrophotometry (UV-Vis), Fourier transform infrared spectroscopy (FT-IR), and circular dichroism (CD) spectroscopy. The extraction mechanism was confirmed via conductivity, dynamic light scattering (DLS), and transmission electron microscopy (TEM). A schematic of the extraction process is described in Scheme 1.
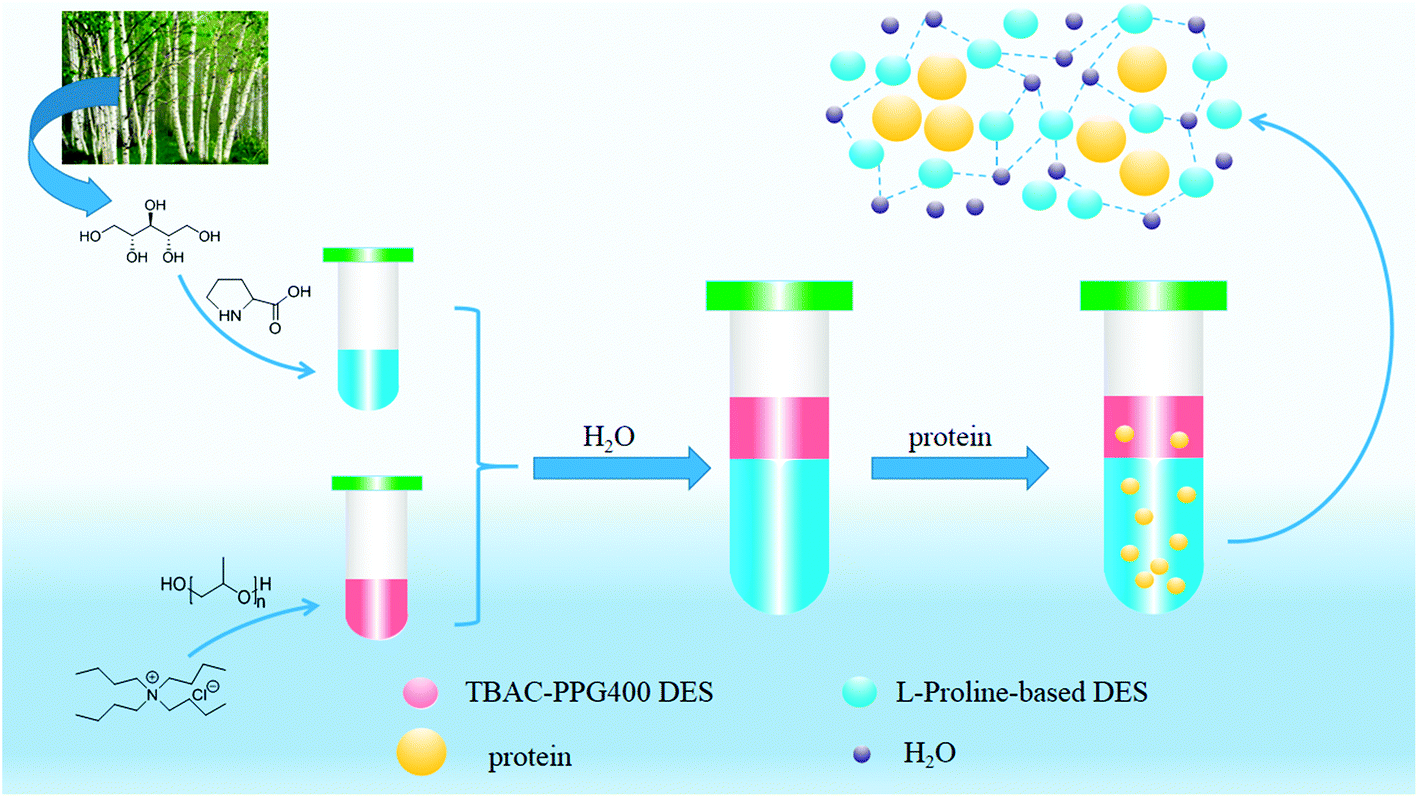 | ||
| Scheme 1 [TBAB][PPG400]/[Pro][Xyl]-based ABS for proteins extraction process. | ||
2. Experimental
2.1. Reagents and instruments
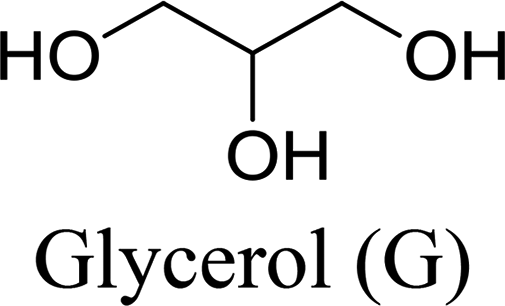
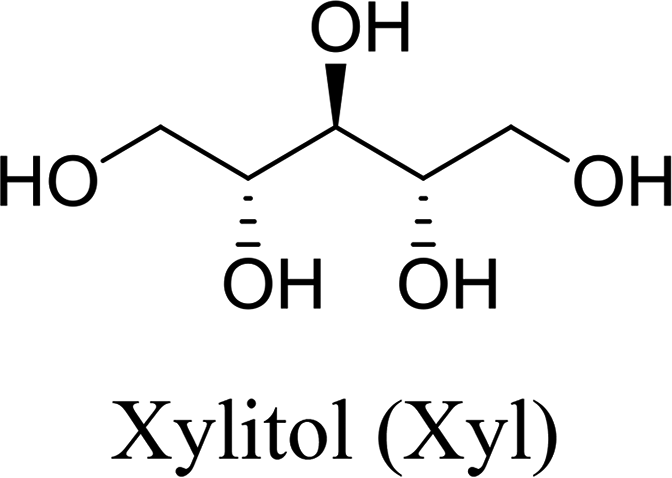
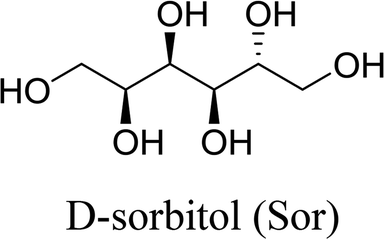
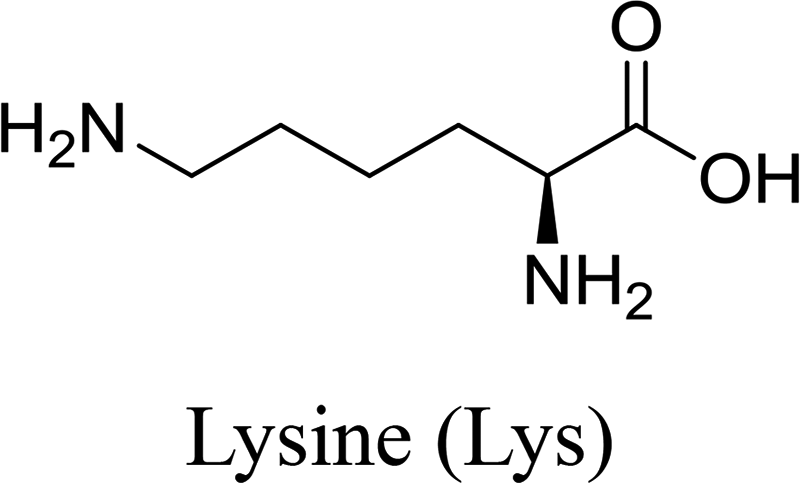
The materials required for DESs synthesis were prepared as follows. L-Proline, xylitol, and tetrabutylammonium chloride (TBAC) were received from Shanghai Source Biological Technology Co., Ltd. D-Sorbitol, glycerol, and lysine were supplied by Sinopharm Chemical Reagent Co., Ltd. Ethylene glycol was provided by Shanghai Titan Scientific Co., Ltd. Polypropylene glycol polymers with average molecular weight of 400 g mol−1 (PPG400) were acquired from Shanghai Macklin Biochemical Co., Ltd. The biomolecule bovine serum albumin (BSA) was obtained from Sinopharm Chemical Reagent Co., Ltd., and chymotrypsin and lysozyme (Lyz) were obtained from Shanghai Source Biological Technology Co., Ltd. A further purification procedure for the reagents was not required to be conducted.A DF-101S heat collection-constant temperature type magnetic stirrer (Henan, China) was used to synthesize the deep eutectic solvents. The structural characterizations of DESs were determined by FT-IR spectroscopy (PerkinElmer, USA) and proton nuclear magnetic resonance spectroscopy (1H NMR) (INOVA-400, Varian, USA). The aqueous biphasic systems were mixed by the QYC200 incubator shaker (Shanghai, China) and centrifuged by a TGL-16C high-speed centrifuge. The quantification of the protein solutions was achieved by the UV2450 UV-Vis spectrophotometer (Shimadzu, Japan). Circular dichroism (CD) spectra of the proteins were recorded by an MOS-500 Circular Dichroism Spectrometer (Bio-Logic, France). A Zetasizer Nano-ZS90 dynamic light scattering instrument (DLS, Malvern, Britain) and a JEM-3010 transmission electron microscope (TEM, JEOL, Japan) were used to prove the cluster phenomena.
2.2. Synthesis and characterization of DESs
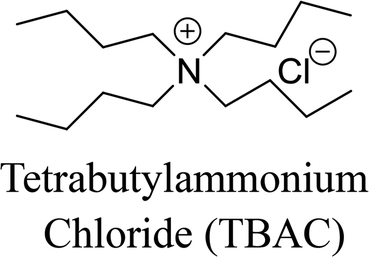
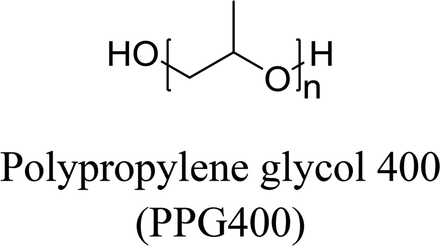
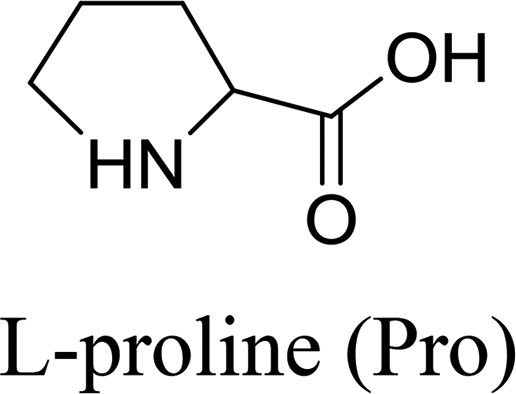
In this work, six types of deep eutectic solvents were successfully synthesized by hydrogen bond acceptors (TBAC, L-proline, and lysine) and hydrogen bond donors (PPG 400, glycerol, ethylene glycol, D-sorbitol, and xylitol).5,28–30 The structures and compositions of these DESs are shown in Table 1. The eutectic mixtures were obtained as follows: the components at a proper molar ratio were mixed and then heated with sustained magnetic stirring until an even and steady liquid was observed. For instance, the synthetic method of [TBAC][PPG400] is presented in Fig. 1. FT-IR was applied to characterize the prepared DESs (ESI, Fig. S1–S6†). The broad absorption peaks at approximately 3300 cm−1 demonstrated abundant hydrogen bonds in DESs. Compared with the observations for amino acids and polyols, the blueshift of C![[double bond, length as m-dash]](https://www.rsc.org/images/entities/char_e001.gif) O (about 1620 cm−1) and C–O (about 1100 cm−1) in [amino acids][polyols] indicated the formation of hydrogen bonds.31 Additionally, proton nuclear magnetic resonance spectra (1H NMR) were used to analyze the structure of DESs (ESI, Fig. S7–S14†). Due to the difficulty in dissolving all the synthetic DESs in deuterated dimethylsulfoxide (DMSO) or chloroform (CDCl3), deuteroxide (D2O) was selected as the solvent, which may result in the disappearance of the active hydrogen atoms such as N–H or O–H. This was proven by the disappearance of the active hydrogen atoms in L-proline and ethylene glycol (D2O as the solvent).
O (about 1620 cm−1) and C–O (about 1100 cm−1) in [amino acids][polyols] indicated the formation of hydrogen bonds.31 Additionally, proton nuclear magnetic resonance spectra (1H NMR) were used to analyze the structure of DESs (ESI, Fig. S7–S14†). Due to the difficulty in dissolving all the synthetic DESs in deuterated dimethylsulfoxide (DMSO) or chloroform (CDCl3), deuteroxide (D2O) was selected as the solvent, which may result in the disappearance of the active hydrogen atoms such as N–H or O–H. This was proven by the disappearance of the active hydrogen atoms in L-proline and ethylene glycol (D2O as the solvent).
| Hydrogen bond acceptor (HBA) | Hydrogen bond donors (HBD) | Abbreviation | Molar ratio (HBA![[thin space (1/6-em)]](https://www.rsc.org/images/entities/char_2009.gif) :HBD or HBA:HBD:H2O) :HBD or HBA:HBD:H2O) |
|---|---|---|---|
 |
 |
[TBAC][PPG400] | 1:2 |
 |
 |
[Pro][EG] | 1:3 |
 |
[Pro][G] | 1:3 |
|
 |
[Pro][Xyl] | 1:1:5 |
|
 |
[Pro][Sor] | 1:1:5 |
|
 |
 |
[Lys][Xyl] | 1:1:5 |
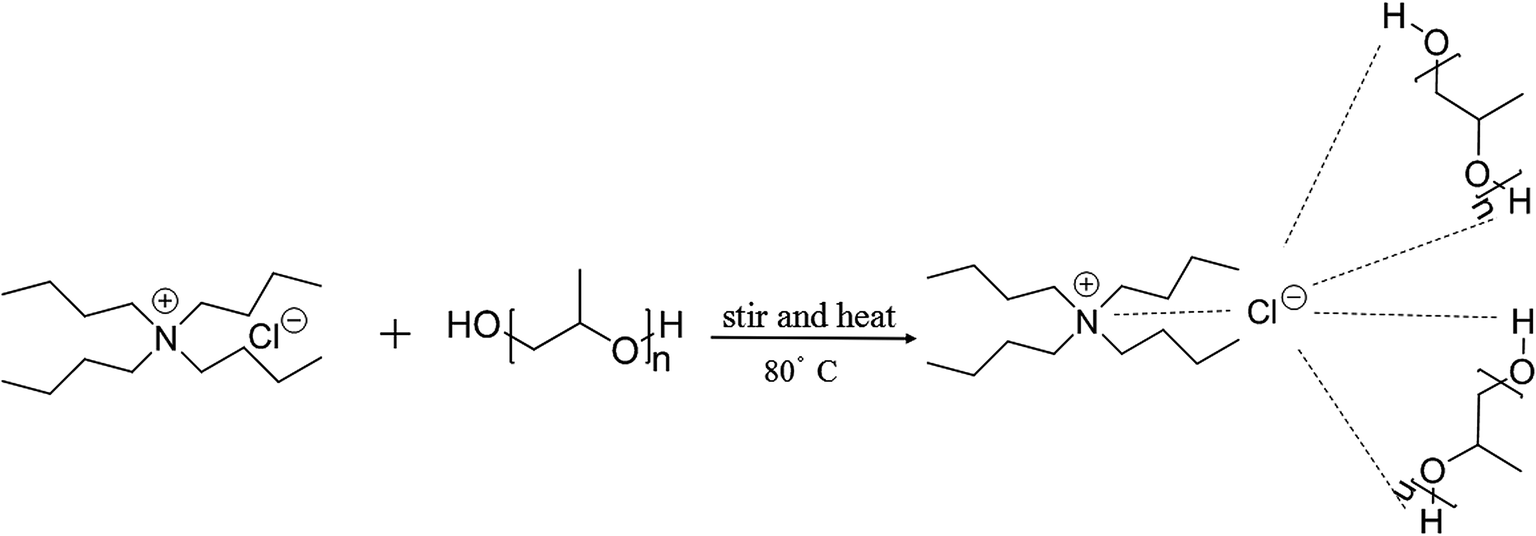 | ||
| Fig. 1 The synthetic route of [TBAB][PPG400]. | ||
2.3. Preparation of phase diagrams
The turbidimetric titration method was employed in drawing the phase diagrams at indoor temperature and atmospheric pressure.32 First, well weighed phase-forming agents were mixed in a 10 mL centrifuge tube until the mixture became muddy, which implied that the biphasic region was generated. Then, deionized water was added dropwise into the solution until a transparent state was observed, suggesting that the monophasic region was achieved. A number of phase transition points were acquired by repeating the above procedures. Finally, a liquid–liquid equilibrium binodal curve was obtained by calculating the mass fractions of individual constituents as the X axis and Y axis values.2.4. Partitioning of the proteins in ABSs
In this study, three kinds of proteins (chymotrypsin, BSA, and Lyz) were chosen to evaluate the extraction abilities of ABSs. Certain amounts of phase-forming components were mixed in 10 mL centrifuge tubes to form ABSs. Afterwards, proteins (about 10 mg) were added into the systems. In order to achieve complete extraction and splitting phases, the centrifuge tubes were shaken in a thermostats cultivating shaker for 20 min at 200 rpm and then centrifuged for 5 min at 3000 rpm. The volumes of the top and bottom phases were recorded after reaching two-phase equilibrium. The liquids of the top and bottom phases were separated and diluted. The concentrations of proteins were identified through the UV-Vis spectrophotometer at 280 nm. The partition coefficient (K), phase volume ratio (R), and extraction efficiency (E) of the proteins are defined as follows: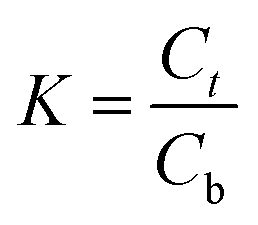
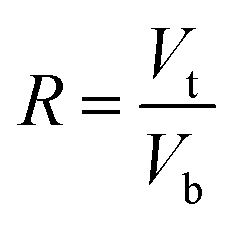
Here, Ct and Cb express the concentrations of proteins in the top and bottom phases after extraction, respectively; Vt and Vb denote the volumes of the top phase and the bottom phase, respectively.
2.5. Preparation of porcine pancreas crude extract
According to previous literature,33 50 g shredded fresh porcine pancreas tissue and 150 mL acetate buffer (0.1 M, pH 4.0) were mixed in a round-bottom flask and stirred at low temperature for 12 h. Afterwards, the pancreas homogenate was centrifuged at 5000 rpm for 30 min and separated to obtain the filtrate. Then, 10 mL CaCl2 solution (0.3 M) and 8 mg pure chymotrypsin were blended with the filtrate to activate proteolysis. Subsequently, Tris–HCl (50 mM, pH 7.5) and NaOH solutions were used to regulate the solution pH to 8.0. After that, the solution was stirred for 3 h at 25 °C. The HCl solution was used to improve the pH of the mixture to 5.5. At last, the centrifugation process (7000 rpm, 30 min) was indispensable to get the final porcine pancreas crude extract.3. Results and discussion
3.1. Equilibrium phase behavior
The stability of this system was certified by elemental analysis. According to previous literature,34 the non-stoichiometric partition of HBA and HBD between two phases can be observed when DESs are destroyed. ABS combined with 1.0 g [TBAC][PPG400] and 1.6 g [Pro][Xyl] was applied to determine the stability of DES/DES-based ABS. Chlorine only existed in [TBAC][PPG400]; thus, the elemental analysis of the [Pro][Xyl] phase was conducted after extraction. The results are exhibited in Table S1.† If [TBAC][PPG400] was disrupted completely, the concentration of chlorine would be 0.0109 g mL−1 in the bottom phase in theory. The detectable concentration of chlorine was 0.000672 g mL−1. After calculation, it was found that 6.13% [TBAC][PPG400] distributed into the bottom phase. A negligible amount of DES was decomposed, which can be neglected. The results indicated that ABSs were composed of [TBAC][PPG400] and [Pro][Xyl] in this work.The phase diagrams offered some informations about the composition of the two-phase systems, which were crucial for separation and extraction. In the phase diagrams, the mixtures above the bi-nodal curves can develop two phases, while the systems in the remaining area are monophasic. The closer the curve to the ordinate origin, the stronger the phase-forming ability was. In this part, three kinds of ABSs, namely, [TBAC][PPG400]/[amino acids][polyols], [TBAC][PPG400]/amino acids, and [TBAC][PPG400]/polyols were used to investigate the biphase-forming abilities. In all the systems, most of [TBAC][PPG400] occurred in the top phase, while the bottom phase comprised amino acids/polyols/[amino acid][polyols]. The phase diagrams are exhibited in Fig. 2.
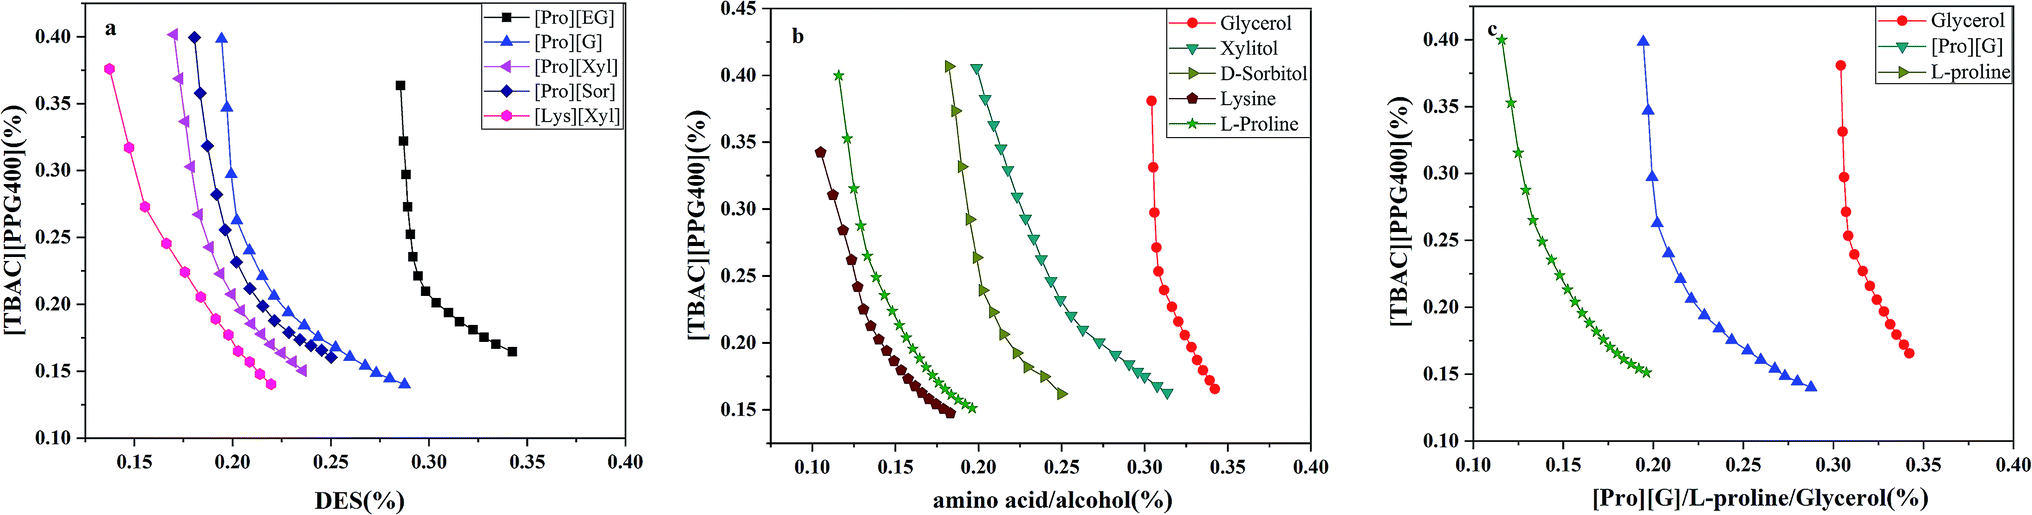 | ||
| Fig. 2 Phase diagrams of ABSs at 25 °C: (a) ABS composed of [TBAC][PPG400] and [amino acids][polyols]; (b) ABS composed of [TBAC][PPG400] and amino acids/polyols; (c) ABS composed of [TBAC][PPG400] and [Pro][G]/L-proline/glycerol. | ||
From Fig. 2a, the phase-forming abilities of [amino acids][polyols] can be obtained: [Lys][Xyl] > [Pro][Xyl] > [Pro][Sor] > [Pro][G] > [Pro][EG]. The complex factors such as viscosity, density, and hydrophilic property resulted in different phase-forming abilities of DESs. The hydrophilic property was the primary factor.25 Therefore, the higher the hydrophilic property of [amino acids][polyols], the fewer the [TBAC][PPG400] required to promote phase splitting.
In Fig. 2b, the phase-forming abilities of the individual DES components are shown: lysine > L-proline > D-sorbitol > xylitol > glycerol. It was clear that the amino acids acting as the phase-forming components exhibited stronger competence in producing a second phase than the polyols. This was because the amino acids presented a stronger salting-out effect,35 resulting in higher affinity for water and easier creation of hydration complexes. This rendered superior potential for developing ABSs. Furthermore, the polyols manifested relatively weak salting-out property.36 In addition, the impact of the polyols' nature on the phase-forming ability was explored as well. It was clear that the ability decreased when the length of the alkyl chains and the number of the hydroxyl groups simultaneously increased. On the one hand, the hydrophobicity of the polyols improved with the increase in the carbon chain length,37 indicating decreasing attraction to water and further resistance to phase formation. On the other hand, owing to the presence of more –OH groups, the polyols' hydrophilicity was stronger,36,38 which increased the hydrogen bonding interaction with water molecules and enhanced the phase-splitting ability. Therefore, compared with the alkyl chain length of the polyols, the number of the hydroxyl groups is a more dominant factor in the phase separation process.
Fig. 2c exhibits the phase-forming abilities of amino acids, polyols, and [amino acids][polyols]. The results are as follows: L-proline > [Pro][G] > glycerol. Compared with the isolated amino acids, [amino acids][polyols] existed in weak salting-out species and thus had more difficulty in achieving ABSs.
In conclusion, the abilities to form ABSs were related to the hydrophobicity of different components.38 The trend can be described as follows: the additional the hydrophilic components combined with more hydrophobic components, the easier it was to form ABSs.
3.2. Extractability of different ABSs
To evaluate the extraction performance of different ABSs on three analytes (chymotrypsin, BSA, and Lyz), [amino acids][polyols] and [TBAC][PPG400] were used to produce bi-phasic systems. As a comparison, [TBAC][PPG400]/amino acids (L-proline and lysine) and [TBAC][PPG400]/polyols (xylitol, D-sorbitol, glycerol, and ethylene glycol) were also explored. After accomplishing extraction, a UV-Vis spectrophotometer was used to detect the concentrations of the proteins at 280 nm. As seen in Fig. 3, every kind of ABS has different extraction abilities for the proteins. For the ABSs mentioned above, except for BSA in [TBAC][PPG400]/[Lys][Xyl] and chymotrypsin in [TBAC][PPG400]/xylitol and [TBAC][PPG400]/lysine, most of the proteins were distributed into the bottom phase. The extraction efficiencies of [TBAC][PPG400]/amino acids ranged from 52.72% to 85.73%. The extraction efficiencies of [TBAC][PPG400]/polyol ABSs ranged from 60.16% to 98.85%. For ABSs with two DESs, the extraction efficiencies ranged from 72.87% to 99.15%. This signified that the studied systems exhibited outstanding extraction performance for the proteins. In this work, chymotrypsin served as the model protein and [Pro][Xyl] with [TBAC][PPG400] systems were chosen to further optimize the extraction performance in the influencing factor experiments.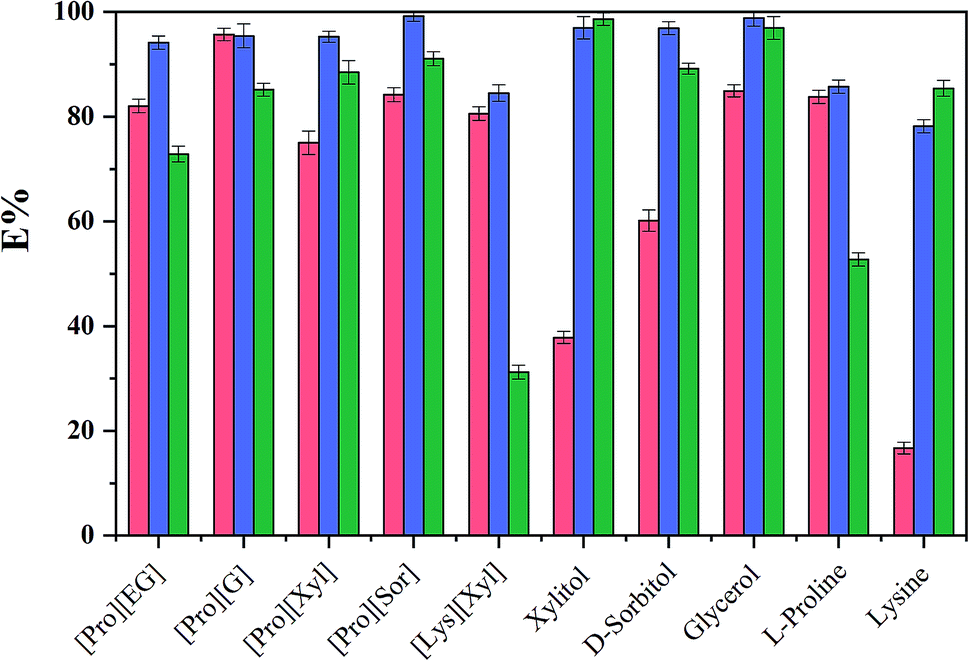 | ||
Fig. 3 The extraction efficiencies (E) of ABSs for diverse substances ( , ,  and and  correspond to chymotrypsin, Lyz, and BSA). correspond to chymotrypsin, Lyz, and BSA). | ||
3.3. Single factor experiments
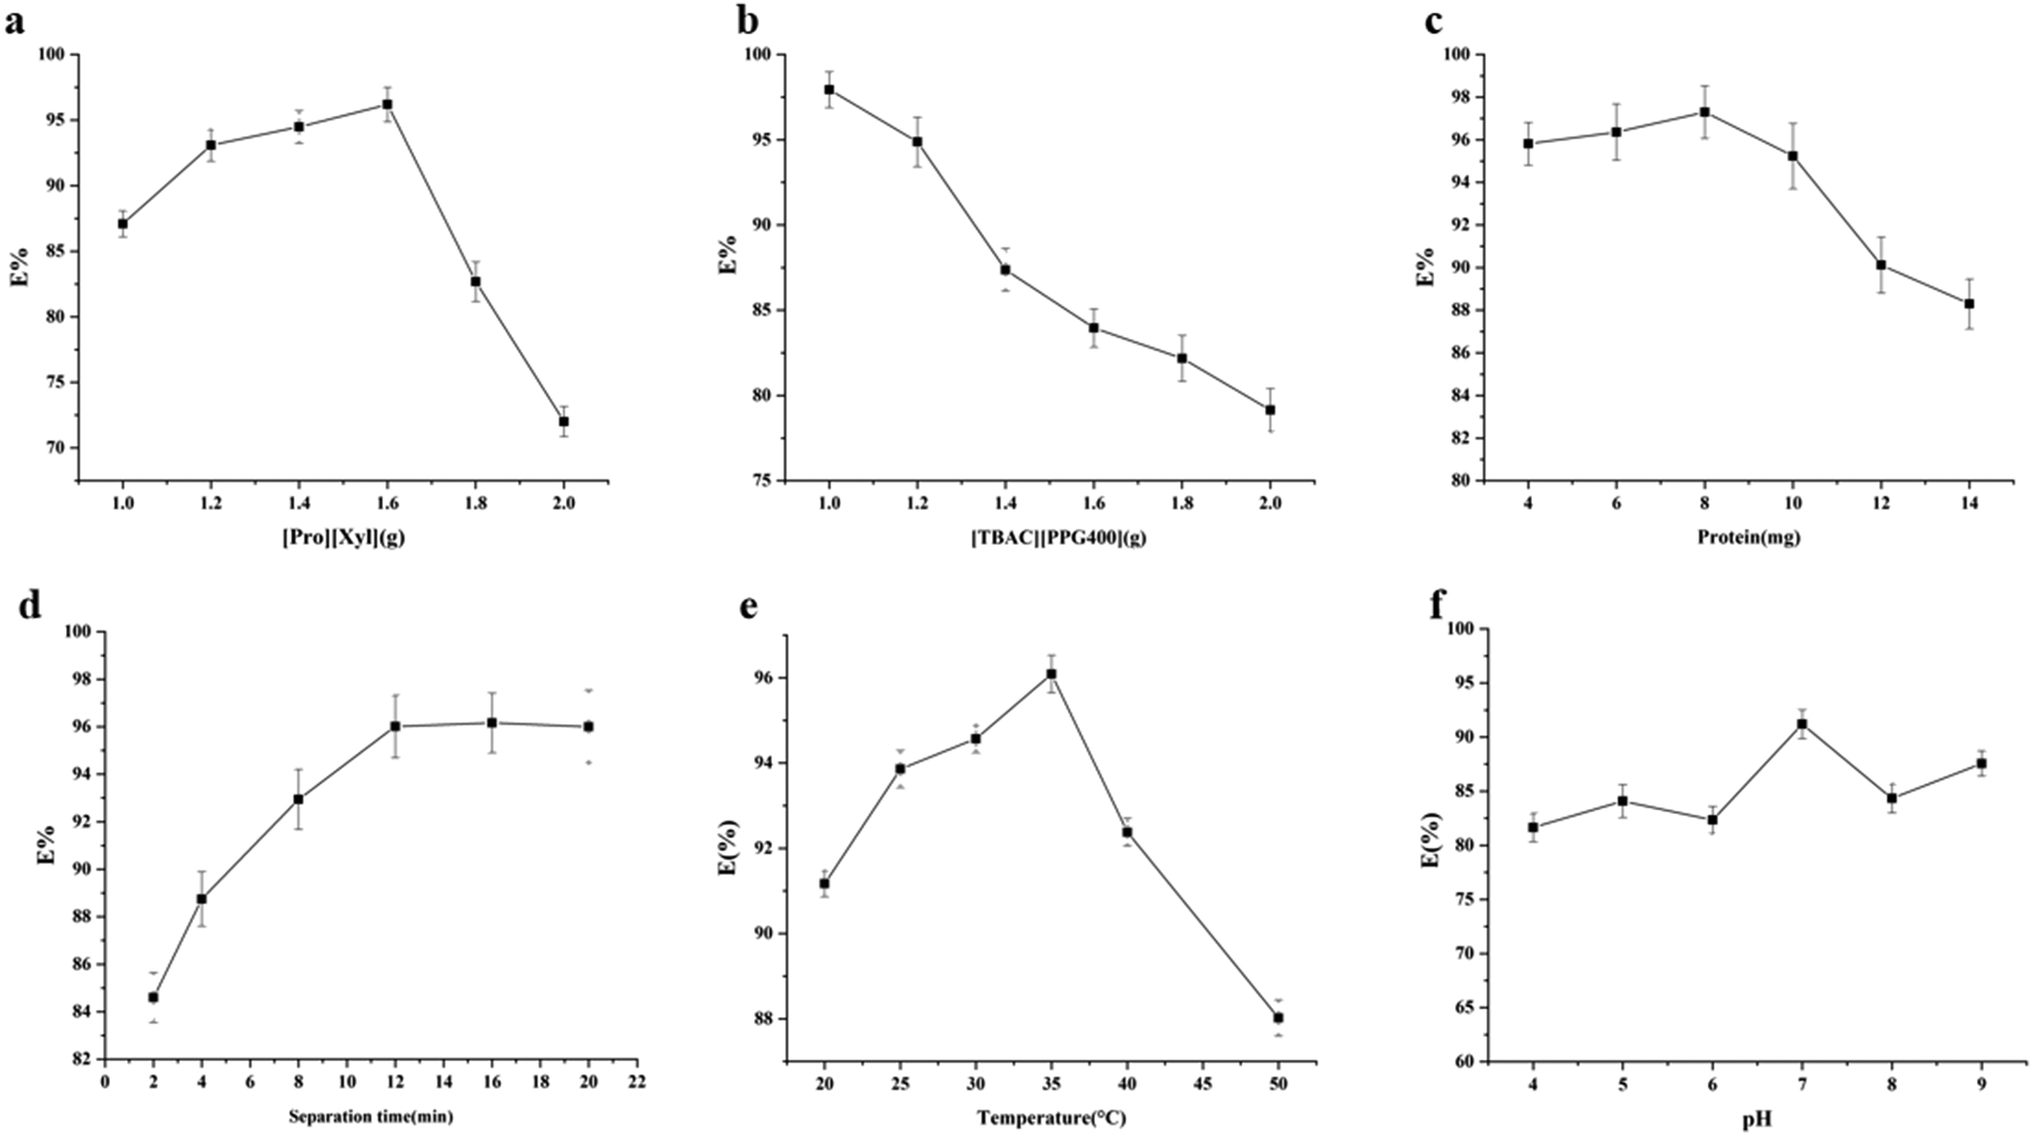 | ||
| Fig. 4 Influencing factors in the protein extraction process: (a) mass of [Pro][Xyl]; (b) mass of [TBAC][PPG400]; (c) amount of the proteins; (d) separation time; (e) temperature; (f) pH. | ||
Based on the single factor experimental results, the optimal extraction conditions were as follows: [Pro][Xyl] (1.6 g), [TBAC][PPG400] (1.0 g), chymotrypsin (8.0 mg), splitting time of 12 min, and extraction temperature of 35 °C. The maximum extraction efficiency attained under these conditions was 97.30%.
3.4. Analysis of practical samples
In order to confirm the practical application of [TBAC][PPG400]/[Pro][Xyl]-based ABS for chymotrypsin extraction, 1.5 mL porcine pancreas crude extract was added into ABSs. After extraction, SDS-PAGE was applied to detect the proteins in the top and bottom phases. The electrophoretograms are depicted in Fig. 5: Lane a denotes the protein molecular mass standard. Lane b denotes the commercial pure chymotrypsin (25 kDa) and Lane c stands for the sample of porcine pancreas crude extract before extraction. The bands of the top and bottom phases after extraction are shown in Lane d and Lane e, respectively. From the electrophoresis images, it is clear that the samples of crude porcine pancreas and pure chymotrypsin are in the same position (25 kDa), which demonstrates the existence of chymotrypsin. Besides, the chymotrypsin (25 kDa) band distinctly appears in the bottom phase, while no band emerges in the top phase. The electrophoresis result indicated that [TBAC][PPG400]/[Pro][Xyl] ABSs successfully accomplished chymotrypsin extraction from the porcine pancreas crude extract.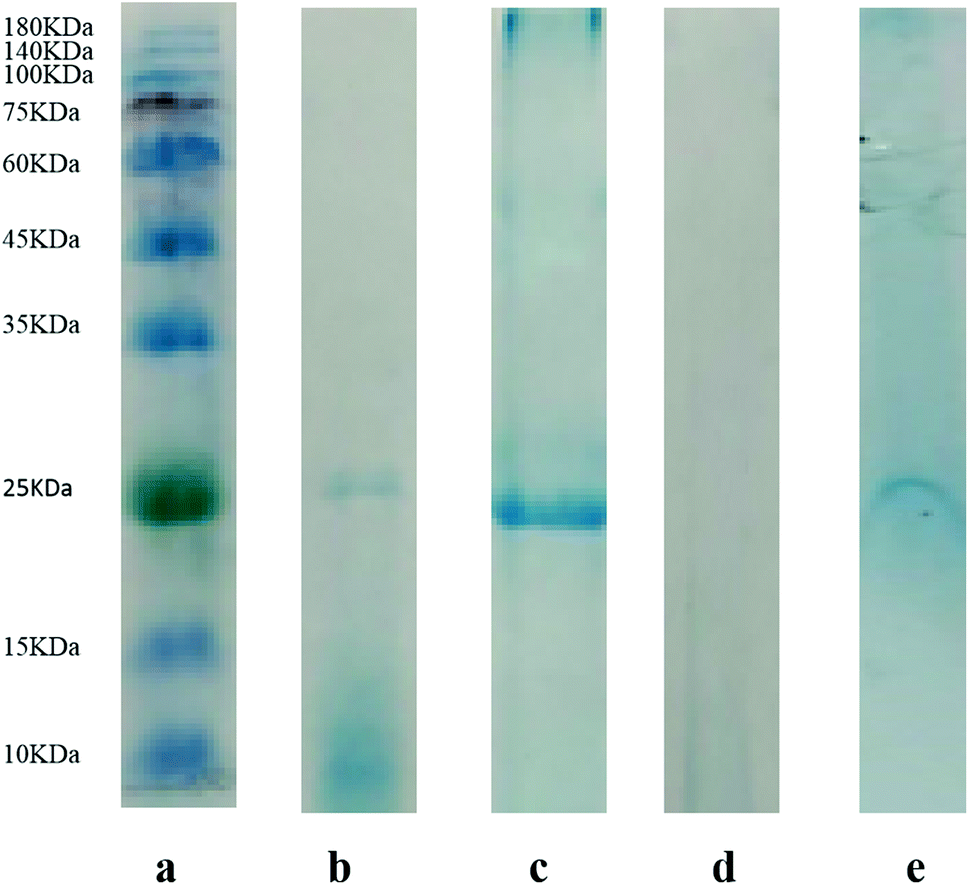 | ||
| Fig. 5 SDS-PAGE analysis of the proteins: (a) molecular mass standard; (b) commercial pure chymotrypsin; (c) the sample of crude bovine pancreas extract; (d) the top phase after the extraction of crude bovine pancreas extract; (e) the bottom phase after the extraction of crude bovine pancreas extract. | ||
3.5. Methodological study
To demonstrate the validity of the developed method, limit of detection (LOD), precision, repeatability, and stability parameters were assessed. The data obtained are shown in Table 2. The calibration equation of chymotrypsin was y = 1.3465x − 0.0214 and the correlation coefficient (R) was 0.9995, manifesting the good linear relationship of the analyte. The calculated LOD value was 0.01357 mg mL−1 in this system. Regarding the precision of the apparatus, a UV-Vis spectrophotometer was used to measure the bottom phase solution five times under the same ABS conditions. The relative standard deviation (RSD) value was 0.3084%. A repeatability experiment was carried out by detecting five replicates from the same ABS sample. The RSD value obtained was 0.9415%. The stability of the system was evaluated via the same sample detection for five sequential days. The RSD value calculated was 2.6132%. The experimental data showed that the DES/DES-based ABSs in this work exhibited excellent precision, favorable repeatability, and excellent stability.| Apparatus precision | |||||
| Repeats | 1 | 2 | 3 | 4 | 5 |
| Extraction efficiency | 96.29% | 96.75% | 96.60% | 96.30% | 95.99% |
| RSD (%) | 0.3084 | ||||
|
|||||
| Repeatability experiment | |||||
| Sample number | 1 | 2 | 3 | 4 | 5 |
| Extraction efficiency | 97.06% | 97.36% | 95.69% | 97.82% | 96.00% |
| RSD (%) | 0.9415 | ||||
|
|||||
| Stability experiment | |||||
| Day number | 1 | 2 | 3 | 4 | 5 |
| Extraction efficiency | 94.62% | 96.75% | 91.87% | 97.06% | 98.43% |
| RSD (%) | 2.6739 | ||||
3.6. Extraction mechanism
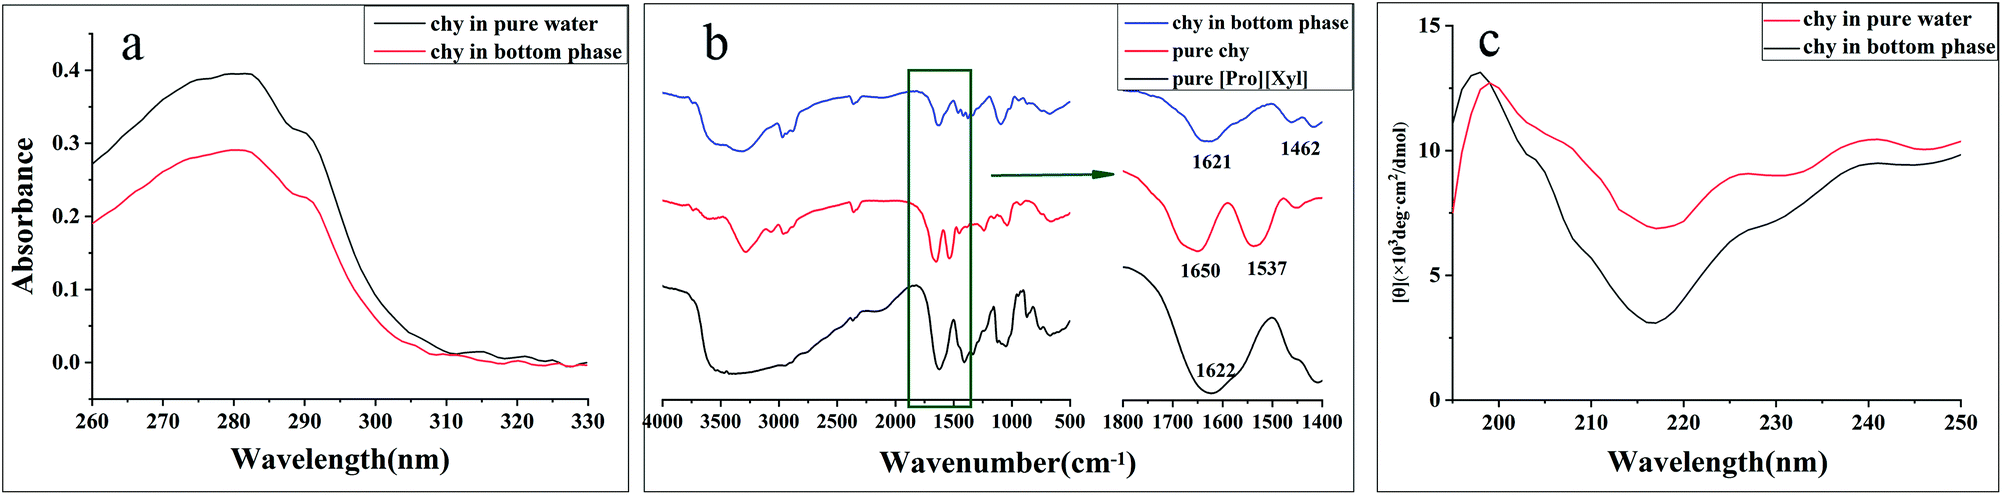 | ||
| Fig. 6 The conformational characterization of chymotrypsin before and after extraction: (a) UV-Vis spectra; (b) FT-IR spectra; (c) CD spectra. | ||
O stretching vibration. The amide II band at 1575–1480 cm−1 was attributed to the CN stretching vibration.39 The FT-IR spectra of pure [Pro][Xyl], pure chymotrypsin, and chymotrypsin extracted in the bottom phase are depicted in Fig. 6b. Compared to the observation for the FT-IR spectra of pure chymotrypsin with DES–protein complexity, the positions of the amide I band and amide II band were nearly unchanged. The above-mentioned result validated that the conformation of chymotrypsin was maintained in the extraction process.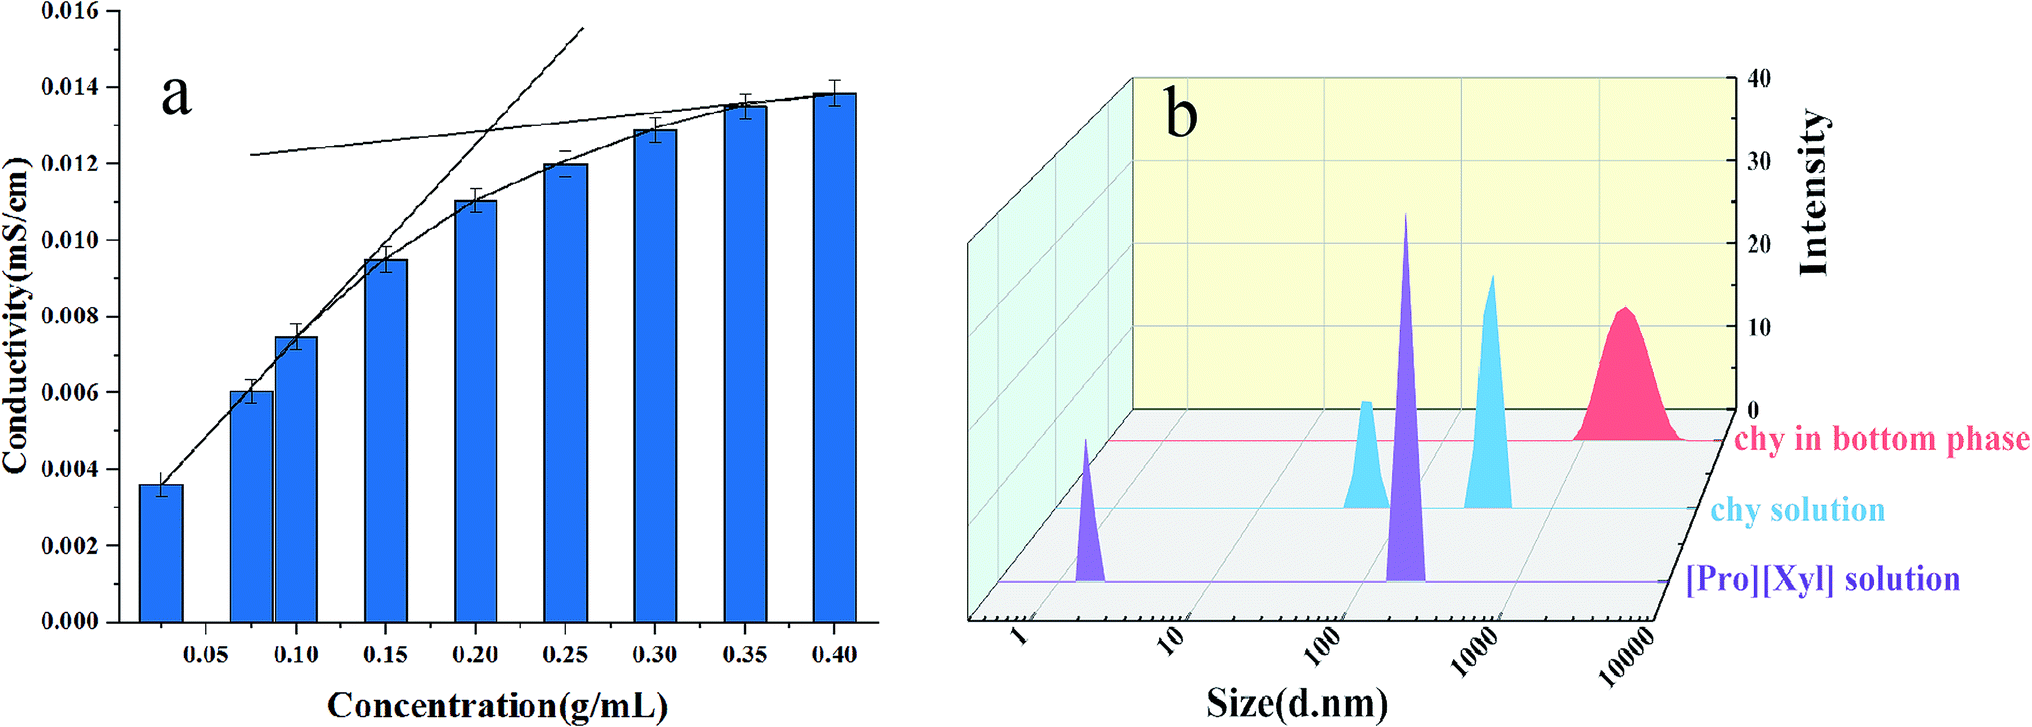 | ||
| Fig. 7 Investigation of mechanism: (a) conductivity of [Pro][Xyl]; (b) size distribution before and after extraction. | ||
The particle size distributions of chymotrypsin solution, DES solution, and the bottom phase after extraction are shown in Fig. 7b. It was clear that the largest particle dimension appeared in the extracted bottom phase solution (around 1990 nm) compared with the observations for the pure protein solution (around 400 nm) and DES solution (around 190 nm). The graph illustrates that the protein–DES aggregates are generated.
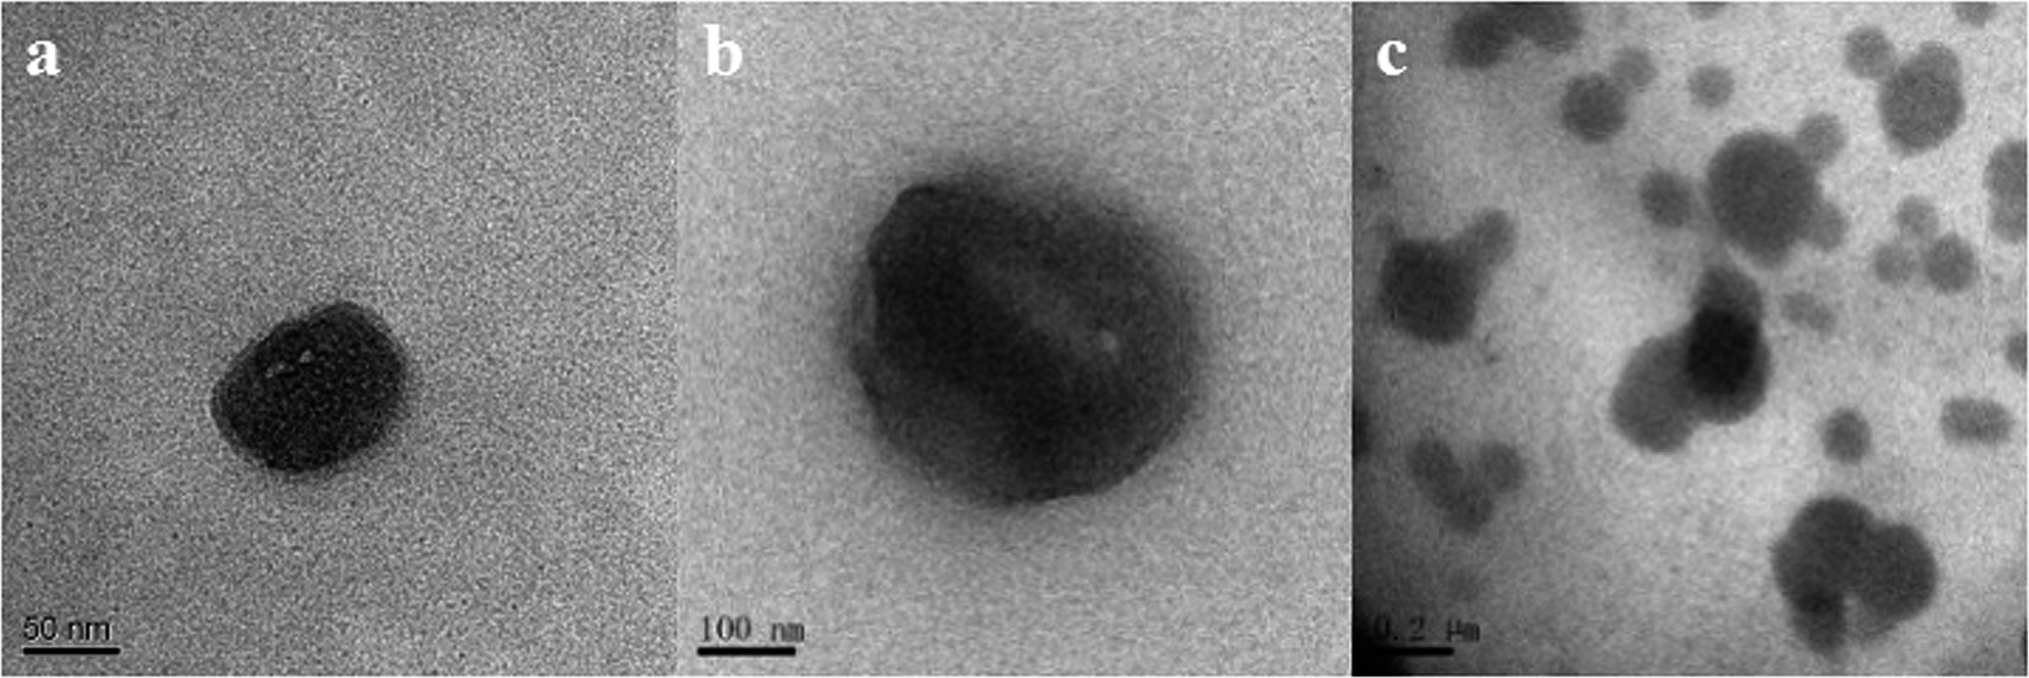 | ||
| Fig. 8 TEM images of (a) [Pro][Xyl] solution; (b) chymotrypsin solution; (c) chymotrypsin in the [Pro][Xyl]-rich phase. | ||
4. Comparison with other ABSs
In order to explore the extraction effect of DES/DES-based ABSs, the prepared ABSs were compared with three representative ABSs (polymer/salt-based ABSs, IL/salt-based ABSs, and DES/salt-based ABSs). The results are shown in Table 3. All the comparative ABSs exhibited high extraction efficiencies. In traditional ABSs, inorganic salts were used to form ABSs with polymers, ILs, or DESs. The salting-out ability of the salts plays a great role in the ABS formation. However, some salt-based ABSs are only formed within a certain pH range, which results in a certain pH environment for extraction.43,44 For pH-sensitive substances, such as some proteins and enzymes, denaturation and conformational change can occur when the pH exceeds a certain range;42 that is to say, these salt-based ABSs are not suitable for the extraction of pH-sensitive substances. Besides, the salts or ILs can induce ion exchange between the two phases in ABSs, which is unfavourable for extraction.44 In this work, the DES/DES-based ABSs were free of any salt. Thus, the studied ABSs were more pH-adjustable and appropriate for the extraction of more substances.| ABS | Extraction target | Detection technique | Extraction efficiency | Limit of detection | References |
|---|---|---|---|---|---|
| Polymer/salt | BSA | Bradford method with Coomassie Blue G250 | 99% | — | 40 |
| IL/salt | Wheat-esterase | Bradford method using BSA as a standard | 88.93% | — | 41 |
| DES/salt | BSA | UV-Vis spectrophotometer | 95.16% | — | 42 |
| DES/DES | Chy | UV-Vis spectrophotometer | 97.30% | 0.01357 mg mL−1 | This work |
5. Conclusions
This study exploited ABSs involving two different DESs for protein extraction. [TBAC][PPG400]/[Pro][Xyl] ABSs were used to discuss the influencing factors in the extraction process. The best extraction efficiency attained for chymotrypsin was 97.30% after optimization. The mechanism exploration experiments demonstrated that the configuration of the proteins remained unchanged and the cluster effect was the main driving force during the extraction process. The practical feasibility of the studied ABSs was proved by the successful extraction of chymotrypsin from porcine pancreas. All the results proved that the DES/DES-based ABSs exhibited excellent extraction performance for proteins. This revealed that the studied systems can provide a green extraction method for biomolecules in the separation and purification fields.Conflicts of interest
There are no conflicts to declare.Acknowledgements
The authors greatly appreciate the financial supports by the National Natural Science Foundation of China (No. 21675048).References
- F. Chemat, M. A. Vian and G. Cravotto, Int. J. Mol. Sci., 2012, 13, 8615–8627 CrossRef CAS PubMed.
- A. P. Abbott, G. Capper, D. L. Davies, R. K. Rasheed and V. Tambyrajah, Chem. Commun., 2003, 1, 70–71 RSC.
- M. Zdanowicz, K. Wilpiszewska and T. Spychaj, Carbohydr. Polym., 2018, 200, 361–380 CrossRef CAS PubMed.
- P. S. Saravana, Y. N. Cho, H. C. Woo and B. S. Chun, J. Cleaner Prod., 2018, 198, 1474–1484 CrossRef CAS.
- L. Duan, L. Dou, L. Guo, P. Li and E. Liu, ACS Sustainable Chem. Eng., 2016, 4, 2405–2411 CrossRef CAS.
- M. Pirsaheb and N. Fattahi, RSC Adv., 2018, 8, 11412–11418 RSC.
- P. Zamani, J. Ozdemir, Y. Ha, M. Benamara, A. V. Kuchuk, T. Wang, J. Chen, A. R. Khosropour and M. H. Beyzavi, Adv. Synth. Catal., 2018, 360, 4372–4380 CrossRef CAS.
- M. Zhang, P. Liu, Y. Liu, Z. Shang, H. Hu and Z. Zhang, RSC Adv., 2016, 6, 106160–106170 RSC.
- N. Li, Y. Wang, K. Xu, Q. Wen, X. Ding, H. Zhang and Q. Yang, RSC Adv., 2016, 6, 84406–84414 RSC.
- C. Bai, Q. Wei and X. Ren, ACS Sustainable Chem. Eng., 2017, 5, 7220–7227 CrossRef CAS.
- J. Pang, X. Sha, Y. Chao, G. Chen, C. Han, W. Zhu, H. Li and Q. Zhang, RSC Adv., 2017, 7, 49361–49367 RSC.
- E. Unsal, T. Irmak, E. Durusoy, M. Tuncel and A. Tuncel, Anal. Chim. Acta, 2006, 570, 240–248 CrossRef CAS PubMed.
- M. Hajduch, R. Rakwal, G. K. Agrawal, M. Yonekura and A. Pretova, Electrophoresis, 2001, 22, 2824–2831 CrossRef CAS PubMed.
- M. Z. M. Nor, L. Ramchandran, M. Duke and T. Vasiljevic, J. Food Sci. Technol., 2015, 52, 7103–7112 CrossRef CAS.
- S. Suwal, A. Doyen and L. M. Bazinet, J. Membr. Sci., 2015, 496, 267–283 CrossRef CAS.
- F. Wolschin, S. Wienkoop and W. Weckwerth, Proteomics, 2005, 5, 4389–4397 CrossRef CAS PubMed.
- S. Xu, K. Lan, J. Li, T. He and C. Hu, Sep. Purif. Technol., 2018, 204, 281–289 CrossRef CAS.
- Z. Li, A. Chen, Z. Li, M. Qu, H. Chen, B. Yang and Y. Wang, RSC Adv., 2017, 7, 37659–37665 RSC.
- S. S. Nadar, R. G. Pawar and V. K. Rathod, Int. J. Biol. Macromol., 2017, 101, 931–957 CrossRef CAS PubMed.
- Y. Pei, J. Wang, K. Wu, X. Xuan and X. Lu, Sep. Purif. Technol., 2008, 64, 288–295 CrossRef.
- N. Li, Y. Wang, K. Xu, Q. Wen, X. Ding, H. Zhang and Q. Yang, RSC Adv., 2016, 6, 84406–84414 RSC.
- X. Wang, L. Xing, Y. Shu, X. Chen and J. Wang, Anal. Chim. Acta, 2014, 837, 64–69 CrossRef CAS PubMed.
- X. Chen, J. Liu and J. Wang, Anal. Methods, 2010, 2, 1222–1226 RSC.
- N. J. Bridges, K. E. Gutowski and R. D. Rogers, Green Chem., 2007, 9, 177–183 RSC.
- N. Li, Y. Wang, K. Xu, Y. Huang, Q. Wen and X. Ding, Talanta, 2016, 152, 23–32 CrossRef CAS PubMed.
- H. Zhang, Y. Wang, Y. Zhou, K. Xu, N. Li, Q. Wen and Q. Yang, Talanta, 2017, 170, 266–274 CrossRef CAS PubMed.
- P. Xu, Y. Wang, J. Chen, X. Wei, W. Xu, R. Ni, J. Meng and Y. Zhou, Talanta, 2018, 189, 467–479 CrossRef CAS PubMed.
- B. Zhuang, L. Dou, P. Li and E. Liu, J. Pharm. Biomed. Anal., 2017, 134, 214–219 CrossRef CAS PubMed.
- Y. Ma, M. Liu, T. Tan, A. Yan, L. Guo, K. Jiang, C. Tan and Y. Wan, Phytochem. Anal., 2018, 29, 639–648 CrossRef CAS PubMed.
- L. Yang, L. Li, H. Hu, J. Wan and P. Li, Pharmaceutics, 2019, 11, 18 CrossRef PubMed.
- W. Zhu, C. Wang, H. Li, P. Wu, S. Xun, W. Jiang, Z. Chen, Z. Zhao and H. Li, Green Chem., 2015, 17, 2464–2472 RSC.
- K. E. Gutowski, G. A. Broker, H. D. Willauer, J. G. Huddleston, R. P. Swatloski, J. D. Holbrey and R. D. Rogers, J. Am. Chem. Soc., 2003, 125, 6632–6633 CrossRef CAS PubMed.
- K. Xu, Y. Wang, Y. Li, Y. Lin, H. Zhang and Y. Zhou, Anal. Chim. Acta, 2016, 946, 64–72 CrossRef CAS PubMed.
- F. O. Farias, H. Passos, A. S. Lima, M. R. Mafra and J. A. Coutinho, ACS Sustainable Chem. Eng., 2017, 5, 9402–9411 CrossRef CAS.
- E. V. Capela, M. V. Quental, P. Domingues, J. A. P. Coutinho and M. G. Freire, Green Chem., 2017, 19, 1850–1854 RSC.
- M. V. Quental, M. M. Pereira, A. M. Ferreira, S. N. Pedro, S. Shahriari, A. Mohamadou, J. A. P. Coutinho and M. G. Freire, Green Chem., 2018, 20, 2978–2983 RSC.
- Y. Xie, H. Xing, Q. Yang, Z. Bao, B. Su and Q. Ren, ACS Sustainable Chem. Eng., 2015, 3, 3365–3372 CrossRef CAS.
- A. M. Ferreira, P. D. O. Esteves, I. Boal-Palheiros, A. B. Pereiro, L. P. N. Rebelo and M. G. Freire, Green Chem., 2016, 18, 1070–1079 RSC.
- W. K. Surewicz, H. H. Mantsch and D. Chapman, Biochemistry, 1993, 32, 389–394 CrossRef CAS PubMed.
- J. D. Morrisett, J. S. K. David, H. J. Pownall and M. G. Antonio, Biochemistry, 1973, 12, 1290–1299 CrossRef CAS PubMed.
- Y. Lu, Y. Yang, X. Zhao and C. Xia, Food Bioprod. Process., 2010, 88, 40–46 CrossRef CAS.
- B. Jiang, Z. Feng, C. Liu, Y. Xu, D. Li and G. Ji, J. Food Sci. Technol., 2015, 52, 2878–2885 CrossRef CAS PubMed.
- J. Pang, X. Sha, Y. Chao, G. Chen, C. Han, W. Zhu, H. Li and Q. Zhang, RSC Adv., 2017, 7, 49361–49367 RSC.
- J. Chen, Y. Wang, X. Wei, W. Xu, P. Xu, R. Ni and J. Meng, ACS Sustainable Chem. Eng., 2019, 7, 6078–6092 CrossRef CAS.
Footnote |
| † Electronic supplementary information (ESI) available. See DOI: 10.1039/c9ra00519f |
| This journal is © The Royal Society of Chemistry 2019 |