 Open Access Article
Treatment of phenol by catalytic wet air oxidation: a comparative study of copper and nickel supported on γ-alumina, ceria and γ-alumina–ceria
Zenaida Guerra-Que,
Hermicenda Pérez-Vidal *,
G. Torres-Torres
 ,
Juan Carlos Arévalo-Pérez,
Adib Abiu Silahua Pavón,
Adrian Cervantes-Uribe,
A. Espinosa de los Monteros and
Ma. Antonia Lunagómez-Rocha
Laboratory of Catalytic Nanomaterials Applied to the Development of Energy Sources and Environmental Remediation, Applied Science and Technology Research Center of Tabasco (CICTAT), Juarez Autonomous University of Tabasco, DACB, Road Km. 1 Cunduacan-Jalpa de Mendez, Cunduacan, Tabasco C.P. 86690, Mexico. E-mail: hermicenda.perez@ujat.mx; Fax: +52 19143360928; Tel: +52 19143360300
First published on 13th March 2019
Abstract
Cu, Ni, CuO and NiO catalysts, prepared by wet impregnation with urea and supported on γ-Al2O3, CeO2, and Al2O3–CeO2, were evaluated for Catalytic Wet Air Oxidation (CWAO) of phenol in a batch reactor under a milder condition (120 °C and 10 bar O2). The synthesized samples, at their calcined and/or their reduced form, were characterized by XRD, H2-TPR, N2 adsorption–desorption, SEM-EDS and DR-UV-Vis to explain the differences observed in their catalytic activity towards the studied reaction. The influence of the support on the efficiency of CWAO of phenol at 120 °C and 10 bar of pure oxygen has been examined and compared over nickel and copper species. The SEM-EDS results reveal that the spherical crystalline Cu and Ni were successfully deposited on the surface of γ-Al2O3, CeO2, Al2O3–CeO2 within 16–90 nm and that they were highly homogeneously dispersed. It was found that catalysts prepared from impregnation solutions of Cu(NO3)2·3H2O and Ni(NO3)2·6H2O with urea addition had different textural characteristics and degrees of dispersion of Cu and Ni species. The urea addition in the traditional wet impregnation method was essential to improve the reducibility and degree of dispersion in Ni, and to a lesser extent, in Cu. According to the characterization analysis of H2-TPR and UV-VIS RD a structure–activity relationship can be determined. The chemical oxygen demand (COD) and GC analyses confirmed the effect of calcined and reduced species for Cu and Ni applied to the catalytic oxidation of phenol, showing their significant impact in the final performance of the catalyst.
Introduction
A great amount of aqueous waste containing organic substances is released into the environment by many industries of the world. The conventional treatments of wastewater have the main objective of removing pollutants, but on occasion these technologies such as biological, thermal, and physicochemical treatments are ineffective when the wastewater streams contain Refractory Organic Compounds (ROCs). ROCs are organic compounds that can be polycyclic aromatic hydrocarbons PAHs, formaldehyde, phenols, nitrobenzene, polychlorinated biphenyls, organophosphorus pesticides, petroleum hydrocarbons, and atrazine, and they keep their molecular structure even after application of conventional treatments, because they are refractory and difficult to destroy. They are also toxic, hazardous and non-biodegradable, and the microorganisms responsible for destroying those molecules have failed.1–4The Wet Air Oxidation (WAO) is an efficient and technologically viable advanced oxidation process for treating a variety of organic pollutants in wastewater.4–6 During WAO, the organic pollutants are either partially oxidized into biodegradable intermediates or mineralized to carbon dioxide, water (if complete oxidation is achieved), and no secondary pollutants like sludge and ashes under severe temperature (125–320 °C) and pressure (0.5–20 MPa). Contrarily, in Catalytic Wet Air Oxidation (CWAO) process, ROC is oxidized by using a solid catalyst in the presence of an activated O2 species, usually at temperatures of 125–250 °C and pressures of 10–50 bar.7–9 From the economical point of view, it is still necessary to improve reaction conditions at temperatures and pressures as milder as possible, simultaneously setting high catalytic activity and long-term stability of heterogeneous catalyst.10,11 The important factor that controls these latter characteristics is using efficient and durable catalysts.
Phenol is often chosen as a model pollutant in many CWAO researchs because it has been listed as a priority pollutant due to its toxicity and hard biodegradability, being an important raw material widely used in dye, pharmaceutical, petrochemical industries, among others. It is an oxidation by-products or intermediate of many aromatic compounds.12,13 However, owing to their bactericidal effect, it is not possible to treat highly concentrated phenolic wastewater using conventional (biological) methods.14,15
The phenol toxicity in aquatic environment has been studied and it is well established that even in low concentration this molecule affects the nervous and circulation systems, reducing the blood cells, causing the death of fish and other aquatic species, changing the ecological equilibrium. Because of this it has been listed as a priority pollutant. Besides, the tertiary conventional treatment of drinking water can also produce carcinogenic and mutagenic compounds, like chlorophenol and polichlorophenol caused by the addition of chlorine.16–18 Hence, disposing safely phenol-containing wastewater is becoming a matter of research with the increasing concern about the environment and human health. Consequently, the development of effective technologies for treating the industrial wastewater is crucial.
The influence of the catalyst is essential to obtain high catalytic activity. Besides, the catalytic performance of supported metal catalyst for oxidation reactions of ROC may strongly be influenced by the nature of support because the support modifies the properties of the active phase such as its reducibility, dispersion, degree of interaction with the metal, among others. Indeed, the use of a specific support has yielded different catalytic results.19–22 Hence, the support can act as a base promoter for the active phase in order to improve the catalytic performance. Therefore, in this study, it was tested the supports of CeO2, Al2O3, Al2O3–CeO2 to evaluate the effect of the nature of the support on the catalytic behavior of Cu and Ni for CWAO of phenol in milder condition.
Ceria has been used in oxidation process related to wastewater treatment due to its outstanding properties. It is well-known for its unique redox property, resulting from its ability to store and release oxygen due to the effective redox Ce4+/Ce3+ sites which enable exchange of oxygen via oxygen vacancy, developing in remarkable oxygen storage capability. As a result, the use of reducible supports like ceria provide oxygen for the reaction and significantly increase the performance of catalytic systems.5,13,14,23,24 Besides, alumina has been studied in CWAO treatment due to it has higher surface area, low cost and thermal stability under reaction conditions.25–31
Noble metals such as Pt, Ag, Au, Ru, Pd, Rh, and Pt are highly active elements for oxidation reactions, reveal high activities and excellence stability, nevertheless, high cost and limited availability can decrease the applicability.32–34 The based catalysts are the most interesting systems and much research is being addressed to their stability improvement and low cost compared to noble metals, which are also active but less stable, suffering from carbon deposition and metal. Therefore, doping cheap transition metals such as Ni and Cu is an excellent option for CWAO instead of noble metals.35–37
The lower price of copper in comparison to noble metals makes the transition metal a promising candidate for a variety of applications. Moreover, CuO is a good O2 transfer carrier, which therefore has the potential of being used in CWAO.38,39 Ni-based systems have attracted more attention due to their lower cost and similar activity and selectivity compared to the noble metals supported catalysts for steam reforming reactions, especially if the Ni is highly dispersed over the support.40–44 Ni has been used mainly for steam reforming reactions, and poorly for oxidation reactions.45–49 However, to our knowledge using Ni/Al2O3, NiCeO2 and Ni/Al2O3–CeO2 catalysts with nano characteristics for the catalytic wet air oxidation of phenol in milder conditions has not been reported in the literature, so there was enthusiasm to investigate this nano structured system.
For the traditional impregnation, a salt precursor is dissolved in water and metal ion species is adsorbed on the support and stirring for several hours to maintain the pH. Nevertheless, the interaction between metal cation and support is weak, resulting in particle aggregation, low metal dispersion and low metal loading on the surface of the support which in turn decreases the activity and stability of the catalyst.25,50,51 Another important objective of this contribution is to improve the traditional impregnation process in order to favor the formation of ideal species for CWAO. For this reason, it is proposed to use wet impregnation method with urea taking into consideration the key influence of pH on the exact nature of the distribution of Cu and Ni species present in Cu(NO3)2·3H2O and Ni(NO3)2·6H2O solutions by controlling this parameter to avoid any further modification of this pH during the preparation procedure, in order to favor a closed intimate interaction between the metal particles and the support.
Moreover, the originality of the present paper is quantitatively to show the influence of the calcination and reduction treatment effects used to activate the catalysts on the global catalytic performance on phenol oxidation over different supports.
The present research focuses on comparing Cu and Ni species supported in three different metal oxides Al2O3, CeO2, Al2O3–CeO2. COD changes were tested to clarify the exact effect of thermal treatment (calcination and reduction treatment) over Cu and Ni on the conversion of phenol by CWAO under a milder condition (120 °C and 10 bar O2). The synthesized catalysts, calcined and reduced, were also characterized by different techniques as X-Ray Diffraction (XRD), Temperature Programmed Reduction (TPR), N2 adsorption–desorption, Scanning Electron Microscopy (SEM) with Energy Dispersive X-ray Spectroscopy (EDS) and Diffuse Reflectance Ultraviolet-Visible spectroscopy (DR-UV-Vis) to study the influence of the formulation in their textural properties and activity.
Experimental
Support and catalyst preparation
The alumina (Al2O3), ceria (CeO2) and Al2O3– CeO2 supports were prepared by the sol gel method. The Al2O3 support was prepared by using aluminum tri-sec-butoxide precursor salt solution (from Aldrich) with water at pH 3 using acetic acid (CH3COOH). A mixture of n-butanol–water was stirred and kept at room temperature. Aluminum tri-sec-butoxide was added drop by drop for 3 hours to the solution described above until a gel was formed. The mixture was constantly stirred for 24 hours at room temperature. After, the water and alcohol remaining were eliminated by the use of a rotavapor unit. Then the powder obtained was left in an oven to dry at 120 °C for 12 hours. The samples were calcined at 500 °C for 12 hours with heating ramp of 2 °C min−1. The CeO2 support was made in the same manner except that the aluminum tri-sec-butoxide precursor salt aqueous solution was replaced by cerium nitrate precursor salt solution and it was used a basic medium precursor solution (NH4OH solution) at pH 10.The Al2O3–CeO2 support was obtained by using cerium nitrate precursor salt (from Aldrich). Cerium aqueous solution were obtained by the stoichiometric addition of precursor to obtain 5 wt% CeO2. For Al2O3–CeO2 the same methodology used to obtain the Al2O3 was followed and the precursor salt was added to the n-butanol–water mixture before adding it to the solution of aluminum tri-sec-butoxide–water.
The copper and nickel were loaded on the respective support (Al2O3, CeO2 and Al2O3–CeO2) by wet impregnation of support (10 g) with aqueous solution of copper and nickel nitrate containing a required amount to obtain a nominal concentration of 5% of Cu and Ni with urea under stirring for 24 h at room temperature. It was taken as a base 10 ml of total solution per g support. The urea was used in the all catalyst's preparation. The Cu or Ni![[thin space (1/6-em)]](https://www.rsc.org/images/entities/char_2009.gif) :
:![[thin space (1/6-em)]](https://www.rsc.org/images/entities/char_2009.gif) urea molar ratio was 1
urea molar ratio was 1![[thin space (1/6-em)]](https://www.rsc.org/images/entities/char_2009.gif) :
:![[thin space (1/6-em)]](https://www.rsc.org/images/entities/char_2009.gif) 1 and the pH of the impregnation solutions was adjusted to 10 with aqueous sodium hydroxide. After impregnation, catalysts were dried at 120 °C for 12 hours and then calcined under air flow (60 ml min−1) at 500 °C for 5 h, with a heat rate of 2 °C min−1 for Cu and at 650 °C for 5 h, with a heat rate of 2 °C min−1 for Ni. Finally, the catalysts were reduced under H2 (60 ml min−1) at 400 °C for 4 h, with a heat rate of 2 °C min−1 for Cu and at 600 °C for 4 h, with a heat rate of 2 °C min−1 for Ni.
1 and the pH of the impregnation solutions was adjusted to 10 with aqueous sodium hydroxide. After impregnation, catalysts were dried at 120 °C for 12 hours and then calcined under air flow (60 ml min−1) at 500 °C for 5 h, with a heat rate of 2 °C min−1 for Cu and at 650 °C for 5 h, with a heat rate of 2 °C min−1 for Ni. Finally, the catalysts were reduced under H2 (60 ml min−1) at 400 °C for 4 h, with a heat rate of 2 °C min−1 for Cu and at 600 °C for 4 h, with a heat rate of 2 °C min−1 for Ni.
Reaction conditions
The activity testing of the catalysts synthesized in this study were carried out in a 300 ml Parr batch reactor, with the following conditions: 120 °C, 10 bar and 1000 ppm of phenol. The standard procedure for a CWAO experiment was followed, 250 ml of the phenol solution was poured and 0.25 g of the catalyst was applied in the reactor. When the selected temperature was reached, stirring started at a maximum speed of 1000 rpm and pure oxygen (O2) was added under stirring. This time was taken as the zero reaction time and the reaction duration was 180 min. These conditions were the same for all the synthesized materials. The liquid samples were periodically removed from the reactor, then filtered to remove any catalyst particles and finally analyzed by gas chromatography and chemical oxygen demand. Table 1 lists Cu and Ni catalysts tested in CWAO of phenol at milder conditions.| Catalyst abbreviation | Composition |
|---|---|
| CuCe oxi | Cu/CeO2(Calcined) |
| CuCe red | Cu/CeO2(Reduced) |
| CuAl oxi | Cu/Al2O3(Calcined) |
| CuAl red | Cu/Al2O3(Reduced) |
| CuAlCe oxi | Cu/Al2O3–CeO2(Calcined) |
| CuAlCe red | Cu/Al2O3–CeO2(Reduced) |
| NiCe oxi | Ni/CeO2(Calcined) |
| NiCe red | Ni/CeO2(Reduced) |
| NiAl oxi | Ni/Al2O3(Calcined) |
| NiAl red | Ni/Al2O3(Reduced) |
| NiAlCe oxi | Ni/Al2O3–CeO2(Calcined) |
| NiAlCe red | Ni/Al2O3–CeO2(Reduced) |
Conversion values Chemical Oxygen Demand (COD) and phenol were determined using the following equation at different times of 30 min intervals up to 180 min of reaction:52
where COD0 is COD at t = 0 (ppm), C0 is phenol concentration at = 0 (ppm), C180 is phenol concentration at t = 3 h of reaction (ppm), COD180 is COD at t = 3 h of reaction (ppm).
Initial rate (ri) was calculated from the conversion of phenol in accordance with time, using the next equation:33
 is the initial slope of the conversion curve; [pollutant]i = initial phenol concentration and mcat = catalyst mass (gcat L−1).
Gas phase chromatography (GC)
The GC analysis was carried out in a Perkin Elmer gas chromatograph with a flame ionization detector. The temperature of the injection port and detector was maintained at 200 and 275 °C respectively. The injection volume was 1 μL. The column was a VF-1ms with dimensions of 30 m × 0.25 mm × 0.25 μm. The oven temperature was maintained at 180 °C (isothermal treatment). The carrier gas used was helium of 99.999% purity.Chemical oxygen demand (COD)
The COD of the phenol solutions treated by CWAO was determined by potassium dichromate standard, with a colorimetric method (5220D). The HATCH vials contained the digestion solution (K2Cr2O7) and the sulfuric acid reagent (H2SO4) to measure COD at the range of 0–1500 mg L−1. At the beginning, it was added 2 ml of sample, blank, at least five standards from potassium hydrogen phthalate solution with COD equivalents to cover concentration range. After it was placed prepared vials in oven preheated to 150 °C during 2 h to digest the organic matter. Finally, it was measured absorption of each sample, blank and standard at selected wavelength (600 nm). The effectiveness of the catalysts was determined in terms of percentage COD removal.Characterization techniques
where D is the crystal size (nm), λ is the wavelength (nm), β is the corrected full width at half maximum (radian) and θ is the selected diffraction angle (radian).
An additional equation was also used to calculate the average oxide crystal size (dSBET) reported by Keav et al.13 dSBET is calculated from SBET, assuming that the particles are semicrystalline spherical:
The particle average diameter (dm) was calculated using the formula:
Results
BET specific surface area
The specific surface area and porosity play a crucial role in determining the diffusion and transport of molecules in the heterogeneous catalytic reaction of oxidation. Fig. 1 showed the graphs of the N2 adsorption–desorption isotherms of the calcined Cu supported catalysts. N2 physisorption analysis was performed in order to determine the SBET, the total volume and pore size. Similar adsorption–desorption isotherms were observed with evident hysteresis loops at a slightly lower relative pressure (P/Po) for CuAl and CuAlCe in comparison to the supports, being the same for CuCe as in support Ce. The graphs of N2 adsorption–desorption isotherms of the catalysts showed the hysteresis phenomenon at the relative pressure range 0.65–1 (P/Po). The hysteresis loops located in the indicated range were considered to be a consequence of a mesoporous structure existing in the synthesized materials.58 All calcined Cu catalysts had regular porous networks of isotherms type IV with narrow H1-type hysteresis loops,26,59,60 which were associated with capillary condensation, typically presented in mesoporous materials as defined by IUPAC. On the other hand, the hysteresis cycle of CuAlCe oxi had a slightly significant change towards a lower relative pressure, showing that its pore diameter was smaller than that of CuAl oxi and CuCe oxi.59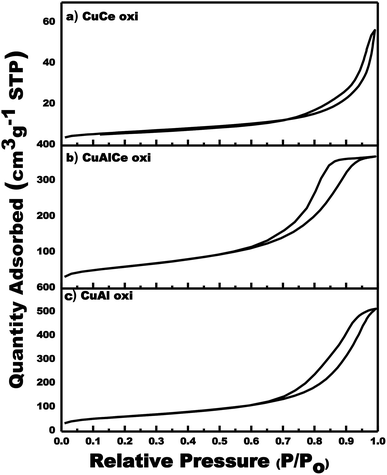 | ||
| Fig. 1 Adsorption/desorption isotherms for calcined Cu supported catalyst: CuCe oxi, CuAlCe oxi and CuAl oxi. | ||
With respect to nickel, Fig. 2 showed the graphs of N2 adsorption–desorption isotherms of the calcined and reduced Ni-supported catalysts. In Fig. 2 the adsorption–desorption isotherms were quite similar for the calcined and reduced Ni catalysts. In addition, the hysteresis loops close at a slightly lower relative pressure (P/Po) for NiAl oxi, NiAl red, NiAlCe oxi and NiAlCe red in comparison to the supports, being for NiCe oxi and NiCe red a higher value of P/Po when compared with the support Ce. The graphs of N2 adsorption–desorption isotherms of the catalysts Ni calcined and reduced showed the hysteresis phenomenon at the relative pressure range 0.65–1 (P/Po), which was considered as a consequence of a mesoporous structure present in the synthesized materials. All calcined and reduced Ni catalysts had regular porous networks of type IV isotherms with narrow H1-type hysteresis loops,26,59,60 which were associated with capillary condensation, typically presented in mesoporous materials as defined by IUPAC. On the other hand, the NiAlCe oxi hysteresis cycle had a slightly significant change towards a lower relative pressure, showing that it had a pore diameter smaller than that of NiAl oxi and NiCe oxi. The same behavior was presented for Ni red catalysts.
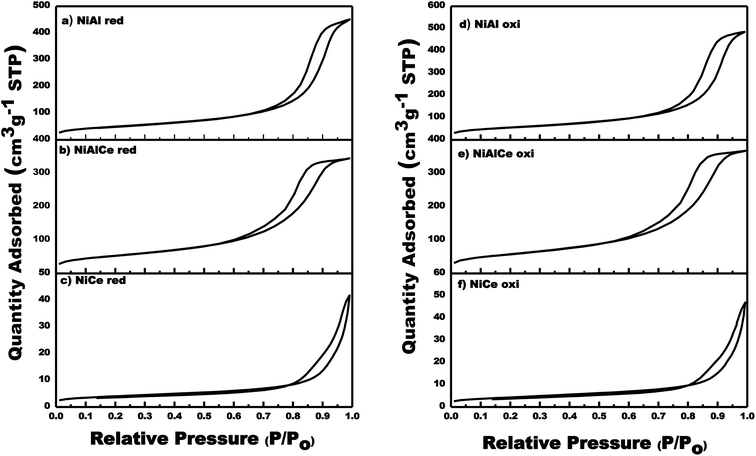 | ||
| Fig. 2 Adsorption/desorption isotherms for calcined and reduced Ni supported catalyst: NiCe oxi, NiAlCe oxi, NiAl oxi, NiCe red, NiAlCe red and NiAl red. | ||
Table 2 lists the textural properties of the calcined and reduced Cu and Ni catalysts. SBET of the calcined and reduced Cu and Ni catalysts had slightly lower values than the pure supports. Within the set of supported Cu catalysts, those of reduced Cu present a higher SBET compared to those of calcined Cu. Within the set of Ni-supported catalysts, the Ni-calcined ones presented a slightly higher SBET compared to those of reduced Ni. With respect to Cu and Ni catalysts, whether calcined and reduced, those of Cu had a greater area. The addition of the metals Cu and Ni in the supports caused a decrease in the SBET in the calcined and reduced materials which indicates that the metals are possibly deposited on the internal surface of the pore, or that they caused the collapse of porous structures of Al, Ce and AlCe. The pore sizes of these Cu and Ni catalysts are within a range of 8–17 nm, which corroborates that they were mesoporous materials.61
| Catalyst | SBETa (m2 g−1) | PVa (cm3 g−1) | PSa (nm) | dSBET a (nm) | dXRD,CeO2b (nm) | dXRD,Al2O3 b (nm) |
|---|---|---|---|---|---|---|
| a Determined by N2 adsorption–desorption isotherms.b Calculated from XRD data, with Scherrer's equation, (222) crystallographic plane of CeO2 and (440) crystallographic plane of Al2O3. | ||||||
| Ce | 27 | 0.086 | 14 | 31 | 18 | |
| Al | 310 | 2 | 18 | 5 | — | |
| AlCe | 321 | 1.880 | 16 | 2 | 2 | |
| CuCe oxi | 23 | 0.065 | 12 | 36 | 20 | — |
| CuAl oxi | 229 | 0.775 | 11 | 7 | — | 4 |
| CuAlCe oxi | 222 | 0.570 | 8 | 3 | 4 | 5 |
| CuCe red | 27 | 0.074 | 16 | 31 | 18 | — |
| CuAl red | 256 | 0.783 | 15 | 6 | — | 3 |
| CuAlCe red | 268 | 0.839 | 12 | 2 | 3 | 4 |
| NiCe red | 14 | 0.048 | 17 | 59 | 30 | — |
| NiAl red | 180 | 0.687 | 12 | 9 | — | 6 |
| NiAlCe red | 193 | 0.531 | 8 | 3 | 6 | 5 |
| NiCe oxi | 16 | 0.057 | 16 | 52 | — | — |
| NiAl oxi | 202 | 0.739 | 12 | 8 | — | — |
| NiAlCe oxi | 210 | 0.567 | 8 | 3 | — | — |
X-ray diffraction (XRD)
The X-ray diffraction patterns of the catalysts of Cu and Ni are used to identify the catalysts phases, as depicted in Fig. 3 and 4. Fig. 3 shows that Cu over Al, Ce and AlCe were synthesized with specific crystalline phases for each catalyst, after the Cu deposit and the calcination and reduction treatments through the method of wet impregnation with urea, the copper precursors were deposited, and after the thermal treatments of calcination and reduction it was observed that the CuAl oxi and CuAl red preserved the γ structures of the alumina (PDF-01-075-0921), that is, Face Centered Cubic (FCC) of O2− ions with vacancies of Al3+. Besides the catalyst CuCe oxi and CuCe red also preserved the FCC fluorite structure (PDF-03-065-7999) of Ce4+ cations with possible vacancies of O2−, and the CuAlCe presented both phases of ceria and alumina, what it indicated for CuAlCe oxi and CuAlCe red were composite material. Several not intense signals, characteristic of CuO, were observed in CuAl oxi and CuCe oxi. Due to ceria signals are located in near location of CuO signals, for CuAlCe oxi some signals could not be appreciated. The PDF-01-080-1916 and PDF-00-048-1548 file indicated the CuO peaks at 32.5°, 35.5°, 38.9°, 46.2°, 48.9°, 51.2°, 53.5°, 56.8° and 61.5°. The catalysts CuAl oxi and CuAl red presented peaks of Cu2O, but in the CuCe oxi, Cu AlCe oxi, CuCe red and Cu AlCe red there is no presence of peaks for Cu2O. The PDF-01-071-3645 file showed the Cu2O peaks at 29°, 36°, 42°, 52.3°, 61.3° and 65.4°. There was presence of metallic Cu peaks of low intensity, in CuCe red and CuAlCe red, in the case of CuAl red was almost imperceptible in the XRD pattern due to good dispersion and a very small size of the particles. Typical diffraction peaks of metallic Cu appeared at 43.5° and 50.5° according to PDF 00-003-1005 and PDF-00-001-1241. In addition, a deep comparison in the plane (1 1 1) for CeO2 suggested that the CuCe red diffraction peak moved to a smaller 2θ angle, revealing the replacement of Ce4+ (0.97 Å) with smaller ions of Cu2+ (0.073 Å) and therefore the incorporation of Cu2+ ions in the ceria network was important. Generally, it is proposed that the formation of the solid solution of Ce–Cu–O by the incorporation of Cu2+ ions within the ceria network at the same time favors the generation of oxygen vacancies, causing the reduction of Ce4+ (0.97 Å) to Ce3+ (1.07 Å) and a lattice expansion.39,62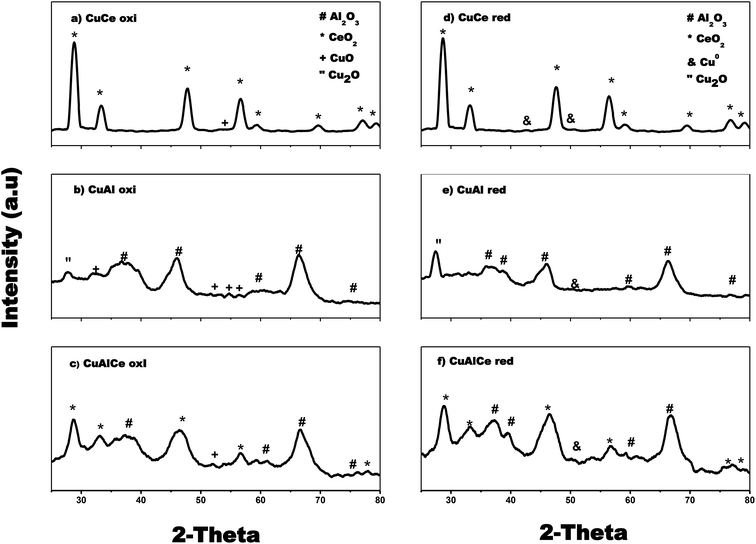 | ||
| Fig. 3 X-ray diffraction patterns for calcined: (a), (b) and (c) and reduced Cu supported catalysts: (d), (e) and (f). | ||
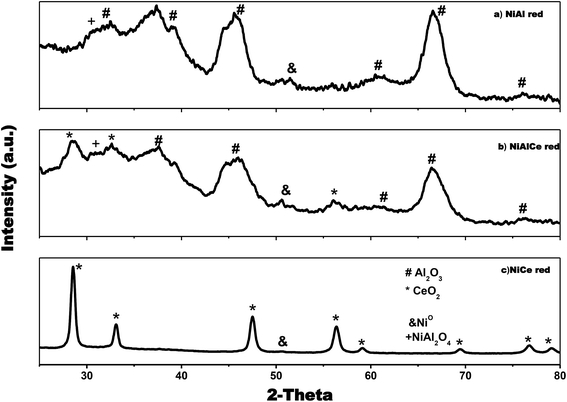
It can be seen in Fig. 4 that Ni over Al, Ce and AlCe were synthesized with specific crystalline phases for each catalyst, after the Ni deposit and the calcination and reduction treatments. After the addition of nickel, the NiAl oxi and NiAl red preserved the γ structures of alumina (PDF-01-075-0921), this means face centered cubic (FCC) of O−2 ions with vacancies of Al3+. Besides the NiCe oxi and NiCe red also preserved the FCC fluorite (PDF-03-065-7999) structure of Ce4+ cations with possible vacancies of O2−, and the mixed oxide presented both phases of ceria and alumina, which indicated for NiAlCe oxi and NiAlCe red that are composite material. The catalysts NiCe red, NiAl red and NiAlCe red showed slight intense peaks of Ni, which were observed in the XRD pattern of these materials. The peaks of Ni were identified with the files, PDF-00-001-1266, PDF-00-001-1258, PDF-00-004-0850, these indicate FCC structure with space group Fm![[3 with combining macron]](https://www.rsc.org/images/entities/char_0033_0304.gif) m. In the case of NiCe red, a distortion of the fluorite structure of the ceria was observed since in the plane (1 1 1) for CeO2 it is suggested that the diffraction peak of the NiCe red shifted to a smaller 2θ angle. This phenomenon has been attributed to the incorporation of Ni2+ ions in the ceria lattice due to the replacement of Ce4+ (0.97 Å) with smaller Ni2+ ions (0.84 Å). At the same time this phenomenon of substitution involves the formation of oxygen vacancies to compensate the load balance in the formation of the solid solution of Ce–Ni–O, causing the reduction of Ce4+ (0.97 Å) to Ce3+ (1.07 Å) and finally a lattice expansion.39,62
m. In the case of NiCe red, a distortion of the fluorite structure of the ceria was observed since in the plane (1 1 1) for CeO2 it is suggested that the diffraction peak of the NiCe red shifted to a smaller 2θ angle. This phenomenon has been attributed to the incorporation of Ni2+ ions in the ceria lattice due to the replacement of Ce4+ (0.97 Å) with smaller Ni2+ ions (0.84 Å). At the same time this phenomenon of substitution involves the formation of oxygen vacancies to compensate the load balance in the formation of the solid solution of Ce–Ni–O, causing the reduction of Ce4+ (0.97 Å) to Ce3+ (1.07 Å) and finally a lattice expansion.39,62
Ultraviolet-visible spectroscopy with diffuse reflectance (UV-Vis RD)
Fig. 5 showed the UV-Vis diffuse reflectance spectrum of CuAlCe oxi, CuAl oxi, CuCe oxi and those of CuAlCe red, CuAl red and CuCe red. Similar bands were observed in both sets of supported catalysts either calcined or reduced, with particular differences that will be discussed below. The charge transfer bands suggest what is the environment of the neighborhood of the Cu2+ ions. The spectrum of CuAl oxi and CuAlCe oxi revealed a weak and short band with a maximum around 360 nm attributed to the Metal–Ligand Charge Transfer (MLCT) Cu, from the O2− band to the 3d band of Cu2+ (Cu2+ –O2-) in highly dispersed CuO.37,39,63 Ayastuy et al.62 has reported a band for Cu/CeO2 located at 312 nm that was related to oxidized copper species over the catalyst surface. In addition, a sharp band ascribed to the presence of Cu2O64 at 530 nm, it could be seen in the spectra of the CuAl oxi. Another absorption peak at around 600 nm was observed and it was attributed to the d–d transitions from lower symmetry CuO species (named clusters of CuO).35,39 The latter band at 600 nm for CuAlCe oxi was presented as a doublet, for CuAl oxi was an intense centered band and for CuCe oxi was not presented. A large broad band with very low intensity peak from around 640 to 700 nm was observed in the spectrum of all calcined cu supported catalysts, which indicated the presence of copper species in the octahedral coordination.37,65,66 This band was originated by metal–ligand charge transfer transitions in copper oxides nanoclusters, MLCT in (Cu–O–Cu)2+ clusters.35,65 In the literature this band was located at the 600–800 nm region due to the d–d transitions of Cu2+ ions in an octahedron symmetry (named Cu2+ Oh in crystalline phase).35,67 In contrast to the reduced materials of CuAl red and CuAlCe red, the intensity of the bands presented in the calcined Cu materials decreased significantly, except with the CuCe red due to its bands increased in intensity. Finally, the surface plasmon resonance was exhibited in the three reduced materials, with a band located at a maximum in a range of 640–700 nm, which confirmed Cu species reached the zero valence state with the thermal treatment of 600 °C in H2 atmosphere.68 With regard to the surface plasmon band for the CuAlCe red, an intense broad band was observed, on the other hand those of CuAl red and CuCe red are less intense and shorter.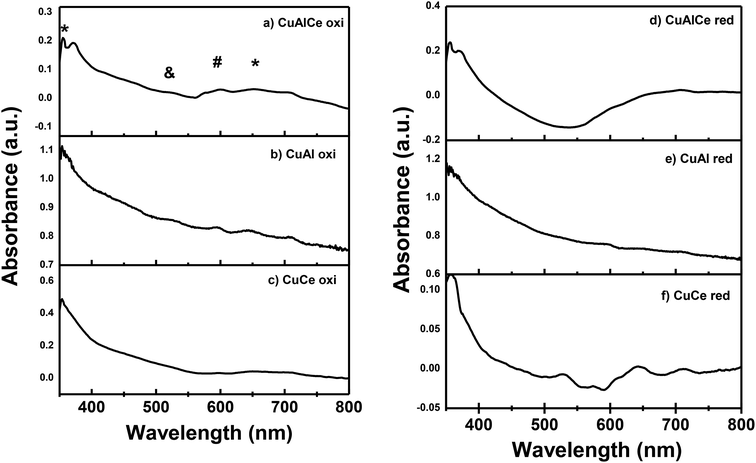 | ||
| Fig. 5 Spectra UV-Vis for the calcined Cu supported catalysts: (a), (b) and (c) and, for the reduced Cu supported catalysts: (d), (e) and (f). Legend: (&) Cu2O, (#) CuO, (*) Cu+2 (Oh). | ||
Fig. 6 illustrates the UV-Vis diffuse reflectance spectrum of NiAlCe oxi, NiAlCe red, NiAl red and NiCe red. The reduced Ni spectra had many adsorption bands in the UV (<400 nm) and visible (>400 nm) region. The near bands between 420–470 nm and the one centered at 700 nm can be assigned to Ni2+ species, octahedrally coordinated in the lattice of Al2O3 and octahedrally coordinated Ni2+ species, Ni2+ Oh, in the NiO red, respectively.69,70 The near band between 420–470 nm in the reduced Ni catalysts, was presented as a doublet of 425 and 460 nm in NiAlCe red and NiAl red, opposite to NiCe red, where it did not occur. The near adsorption bands between 480–530 nm and doublet of 575 and 600 nm were assigned to Ni2+ ions in tetrahedral symmetry in the lattice of Al2O3, Ni2+ Td, and therefore associated with the formation of the spinel phase NiAl2O4 detected by XRD.37,71 All the calcined and reduced nickel materials shown absorption in a centered and intense band at 350 nm that was associated to a charge transfer transition of O2− (2p)–Ni2+ (3d).69,72,73 The absorption observed in the NiCe red spectrum at 575–600 nm and 700 nm, is related to NiO, besides the doublet located at the 435–475 nm region almost disappears and so does the band at 525 nm, which is intense for materials NiAl red and NiAlCe red.69,72 The NiAlCe oxi spectrum has a broad and not intense adsorption band at a range of 550–700 nm, which is associated with Ni2+ species in tetrahedral symmetry in the lattice of Al2O3. In the case of the reduced samples, a short and not intense band in a maximum of 650 nm corresponded to the surface plasmon of effect related to the formation of metallic nickel.74,75
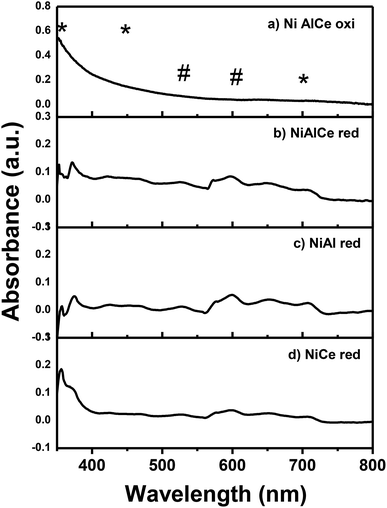 | ||
| Fig. 6 Spectra UV-Vis for the calcined Ni supported catalyst: (a) and for the reduced Ni supported catalysts: (b), (c) and (d). Legend: (#) Ni+2 (Td), (*) Ni+2 (Oh). | ||
Scanning electron microscopy (SEM)
Scanning Electron Microscopy (SEM) analysis was carried out to study the morphology of several catalysts. The pure supports Al, Ce and AlCe presented a heterogeneous morphology consisting of different sizes, shapes and orientations crystals. The micrographs obtained from all the materials analyzed (some not shown) revealed morphological characteristics of nanoporous solids. The copper-free surfaces were smooth, but they became rougher after the addition of copper, retaining the structures of the supports. As can be seen in Fig. 7 that copper particles had an average diameter close to 90 nm for CuAl oxi, they showed a “sphere-like” morphology, in the form of crystalline oxide were well dispersed on the surface of the support. The bright spots represented Cu, while the alumina surface was in dark color. CuCe oxi had the smallest copper species within oxidized copper catalysts.75Fig. 8 showed the elemental mapping by Energy-Dispersive Spectrometry (EDS) of a chosen region of CuAl oxi. The evaluation of the recorded images suggested that the copper particles were heterogeneously distributed, there were separate or isolated Cu particles, and some areas with more agglomerated particles were on the surface.76,77 Although the composition profile indicated a uniform distribution in most of the analyzed area. So the elemental mapping images confirmed that Cu NPS were successfully stabilized on the surface of the alumina.35,60,78,79
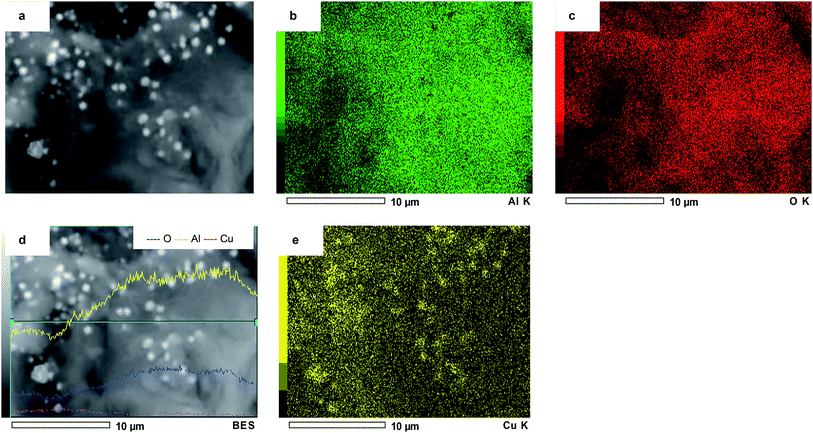 | ||
| Fig. 8 SEM-EDS images of the (a) CuAl oxi catalyst, element mapping images of the (b) Al, (c) O, (d) elemental line profiles, (e) mapping analysis of Cu. | ||
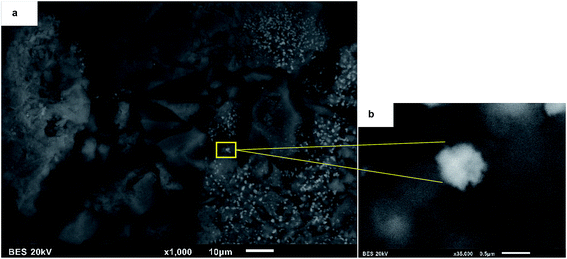
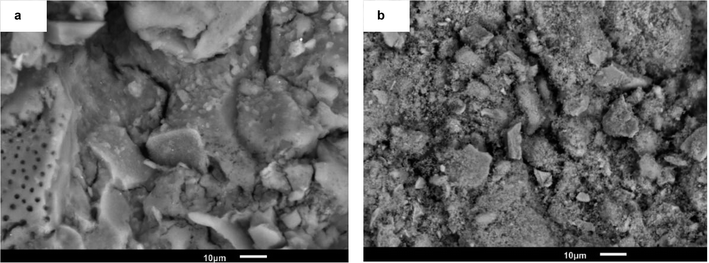
Fig. 9 showed the morphology of NiAl red and NiCe red, after the addition of the nickel precursor salt, nickel particles could hardly be observed on the surface of the supports in SEM images. As confirmed by XRD analyses, Ni species were very small. Therefore, the reduced nickel could not be observed with a such low resolution of SEM, but the morphology of nanoporous supports and rougher texture are still clearly observed.70,79
Fig. 10 showed the elemental mapping by Energy-Dispersive Spectrometry (EDS) of a selected region of NiCe red. In the case of NiCe red (Fig. 10a) the nickel species were uniformly and homogeneously distributed over the whole surface, there were only Ni species separated or isolated on the support of ceria.80,81 The analysis of nickel elemental mapping in NiAl red and NiAlCe was compared to the NiCe red, the latter had the most uniform and homogeneous distribution. Hence the elemental mapping images confirmed that Ni species were successfully stabilized over the surface of ceria.80
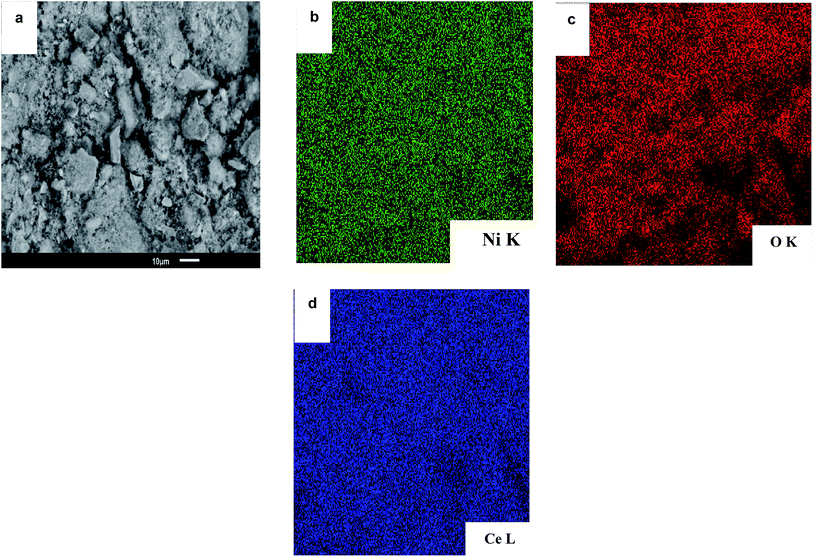 | ||
| Fig. 10 SEM-EDS images of the (a) NiCe red catalyst, (b) element mapping images of the (b) Ni, (c) O and (d) Ce. | ||
Temperature-programmed reduction of H2 (H2-TPR)
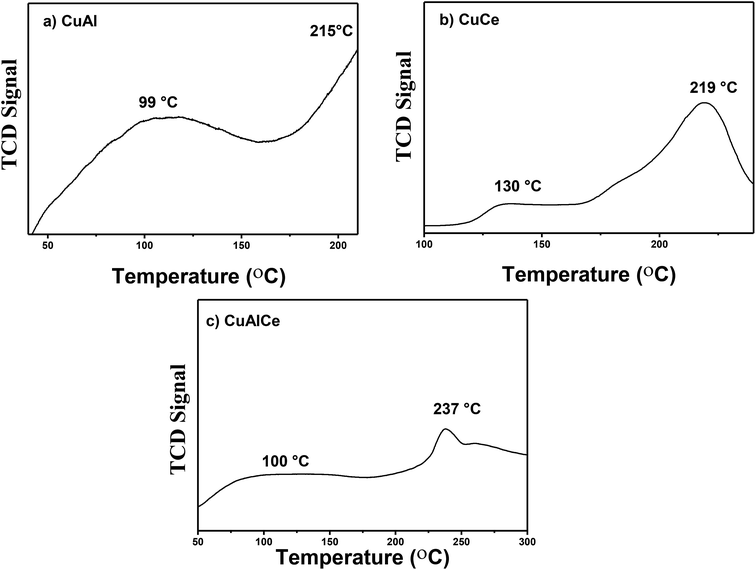
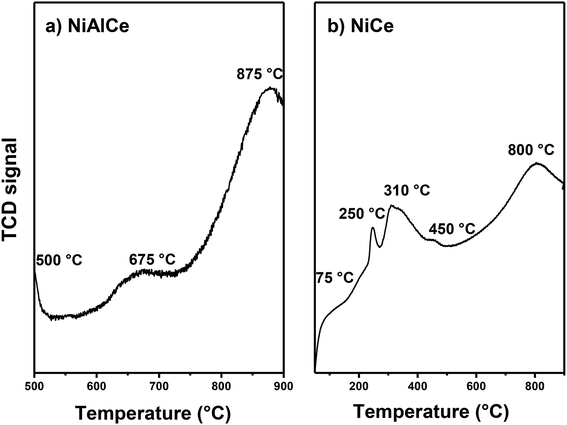
Fig. 11 showed the H2-TPR profiles of the catalysts calcined at 500 °C in air flow, CuCe oxi, CuAl oxi and CuAlCe oxi synthesized by the method of wet impregnation with urea. The reduction profiles of the Cu catalyst supported showed hydrogen consumption from about 40 °C to 250 °C as a function of the type of support used, due to the reduction of copper oxide. All the catalysts studied had characteristic peaks in their TCD signal profile, indicating that there were oxidized copper species with different redox behavior.82–84 Kundakovic et al.,85 Bouhka et al.35 found a clear influence of host oxide on copper reduction behavior, due to several peaks located with different values of reduction temperature in copper samples promoted with different supports, which is attributed to the synergistic interaction between copper and the support. Araiza et al.86 attributes the reduction that is carried out at higher temperatures than 200 °C in oxidized Cu species over ceria, to some Cu+2 ions that may be incorporated in the lattice of ceria. The TPR profiles with several peaks located in different shapes and positions indicate a variety of copper oxide species that are being reduced, whose distribution and nature in the samples described is not the same. Very similar results of this study were observed for Cu supported in alumina, ceria and alumina–ceria by Rao et al.,87 Araiza et al.86 and Nevanpera et al.,27 who found double peaks at around 160 °C to 280 °C. Ayastuy et al.62 reported reduction profiles for 7% Cu/CeO2 at a range of 85 °C to 200 °C. Fig. 11a exhibited the reduction pattern of CuAl oxi, with a peak at 99 °C and 215 °C, respectively. The H2-TPR profile of CuCe oxi revealed reduction peaks at higher temperatures, centered at 130° and 219 °C. A peak at 100 °C and another at 237 °C were also found at high temperatures for CuAlCe oxi. This clearly indicated that different and reducible copper oxide species can be observed on different used supports. Turco et al.,88 Putrakamar et al.63 and Araiza et al.86 have indicated that TPR profiles with greater intensity in the signals suggest an increase of a particular copper species, in comparison to the other. The first reduction peak of all Cu catalysts had a smaller area under the curve, and the second peak had a greater area under the curve. The first peak at a lower temperature at a range between 90 °C and 130 °C was attributed to the reduction of Cu+2 ions or small agglomerates of highly dispersed CuO species over the lattice of support, which can not be detected by XRD and which were not directly interacting with the support.35,62,88 While the TPR signal at a higher temperature at a range between 200 °C to 400 °C was related to CuO species in the form of large three-dimensional agglomerates, CuO agglomerates that have identical characteristics and properties to those of pure CuO powder strongly interacting with the support, which can be detected by XRD.62,63,84,87 Aboukaïs et al.,83 Rao et al.,87 Yu et al.89 affirmed that the process of reducing oxidized species (Cu+2) to reduced ones (Cu0) occurs more easily, when the peaks of reduction in a material are located at lower temperature values in the specific peaks, compared to reduction peaks of different materials. The ease of the reduction or reduction process is likely to be one of the important factors in determining catalyst activity.Therefore, within the set of analyzed catalysts, CuAl oxi had the highest intensity of the reduction peak assigned to highly disperse copper species and is the one that presents the more easily reducible states, so it should promote a better behavior of catalytic activity.
Fig. 12 showed the results of H2-TPR of the calcined catalysts at 650 °C in air flow of NiCe oxi and NiAlCe oxi synthesized by the wet urea impregnation method, and they were measured to check the reduction temperature, to determine the number of reducible species and to investigate the reducibility of materials. The profile of the NiAlCe catalyst (Fig. 12a) shows a wide peak area from 500 °C to 1000 °C, it exhibited three reduction peaks at 500 °C, 675 °C and 875 °C. In contrast, NiCe exhibited a higher number of peaks than NiAlCe, due to the reduction of more different species of oxidized nickel, at 75 °C, 250 °C, 310 °C, 450 °C and 800 °C. Since the unsupported nickel oxide species are reduced to metallic nickel in a single step (Ni2 + O + H2 → Nio + H2O) the appearance of multiple peaks in the reduction profiles of the catalysts NiAlCe and NiCe indicated NiO species with different characteristics (degree of agglomeration and the strength of the metal-support interaction). It has been reported that free NiO (without supporting) or NiO species with very little interaction with the support, present NiO temperature peak around 300 °C to 400 °C.73,90–92 The differences in the reduction behavior between NiAlCe (Fig. 12a) and NiCe (Fig. 12b) were attributed to the structural differences of the catalysts due to the multiplicity of the reduction peaks can be explained by the heterogeneity of the Ni species on the surface of the catalyst. The profiles were divided into three regions, according to scientific literature.73,91–94 Region A corresponded to the reduction of NiO species with no interaction and weak interaction from 100 °C to 400 °C; region B indicated metal support mean interaction from 400 °C to 500 °C and region C at the highest temperatures demonstrated the strongest interaction between nickel species and the support from 500 °C to 900 °C. In consequence, the NiAlCe catalyst in its TPR profile had two peaks of reduction in the region C and one peak in the B region, while NiCe had one reduction peak in the region C, one reduction peak in the region B and three reduction peaks in region A. It is widely accepted that reduction peaks at lower temperatures are associated with the presence of NiO species that have a weak interaction with the support, such as “free” crystalline NiO and highly dispersed phase of small particles of NiO on the surface of the support; furthermore, peaks with higher temperature correspond to NiO species with greater degree of agglomeration when intimate contact or with strong interaction with the support.73,91,94 Regarding NiCe, all peaks were displaced at lower temperatures and the relative intensities of the reduction peaks had changed. Peaks located at lower reduction temperatures (<400 °C) were observed in NiCe, on the other hand there were no peaks in region A in NiAlCe. This latter indicates that the ceria support extends the proportion of NiO species in weak and medium interactions with the support, coinciding in part with that reported by Ranga Rao et al.95 who affirmed that support CeO2 or pure oxides have a very strong promotional effect with nickel. The large change in the position of the reduction peak indicated that the interaction of NiO species with the CeO2 support was quite different from that in NiAlCe; although the strength of the interaction between NiO and CeO2 species remained, suggesting the existence of a NiO species in intimate interaction, in accordance to that reported in XRD. Such behavior has not been reported in previous works.22,44,73,95–97 The composition and preparation methods used for NiCe, NiAlCe and NiAl in this work were different from those cited above, which induce different interactions between NiO and the support.
Although there is discussion in the scientific literature about the reduction above 700 °C of pure CeO2 that was attributed to a deep reduction of oxygen in internal layers of CeO2, when going from Ce4+ to Ce3+.22,96 In addition, peaks in the region of high temperature for Ni supported in Al2O3, were attributed to NiAl2O4 with a spinel structure, and they have been assigned a maximum of 750 °C, 800 °C, 830 °C, 860 °C and 950 °C.91,92,94,98
Evidently, most of the nickel oxide species in the NiCe catalyst were reduced at lower temperatures compared to NiAlCe. These results indicate that the use of urea and the influence of a particular support through the interaction of NiO species with the support, can promote NiO dispersion and improve NiO reducibility.
Activity of the monometallic catalysts Cu and Ni, calcined and reduced, supported on Al, Ce and AlCe in the CWAO of phenol
In order to evaluate the efficacy of CWAO of phenol, measurements of phenol conversion and COD removal were taken from the respective initial and final concentrations of phenol and COD. Samples were withdrawn periodically during the reaction to determine the concentration of phenol and COD. The effect of the catalyst composition and thermal treatment in the CWAO of phenol were presented in Fig. 13–16.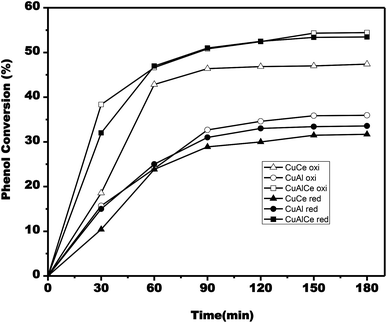 | ||
| Fig. 13 Evolution of phenol conversion during single run catalytic tests for CuCe oxi (△), CuCe red (▲), CuAl oxi (○), CuAl red (●), CuAlCe oxi (□), CuAlCe red (■). | ||
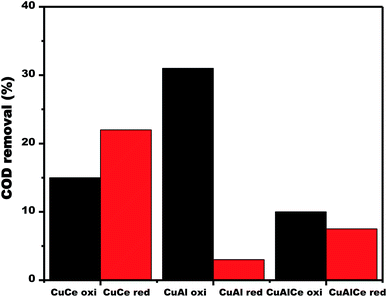 | ||
| Fig. 14 COD removal over calcined and reduced Cu supported catalysts obtained after 180 min of reaction. | ||
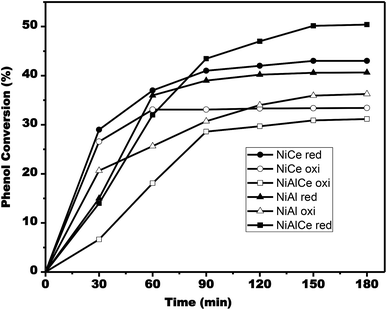 | ||
| Fig. 15 Evolution of phenol conversion during single run catalytic tests for NiAlCe oxi (□), NiAlCe red (■), NiAl oxi (△), NiAl red (▲), NiCe oxi (○), NiCe red (●). | ||
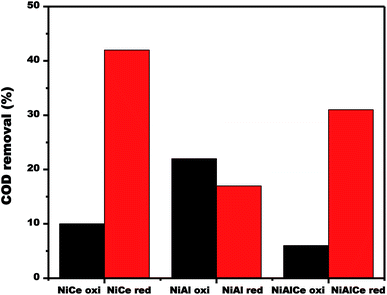 | ||
| Fig. 16 COD removal over calcined and reduced Ni supported catalysts obtained after 180 min of reaction. | ||
The CWAO experiments were carried out for the catalysts CuO/γ-Al2O3, CuO/CeO2, CuO/Al2O3–CeO2, after the catalysts were thermally treated by calcination with O2; as well as with those catalysts reduced with H2 such as Cu/γ-Al2O3, CuCeO2, Cu/γAl2O3–CeO2 under the following reaction conditions: initial phenol concentration of 1000 ppm, oxygen partial pressure of 10 bar and 120 °C.
According to Fig. 13, the phenol conversion rate increased as time progressed. The phenol conversion rate for the calcined copper materials reached 55% after 180 min over the CuAlCe oxi catalyst, while it only reached 47% and 36% on the CuCe oxi and CuAl oxi catalysts, respectively. In the case of reduced copper catalysts, the conversion rate of phenol reached 54% after 180 min on the CuAlCe red catalyst, while it was only 32% and 34% on the CuCe red and CuAl red catalysts, respectively.
Fig. 14 displayed the changes in the efficiency of COD degradation of supported copper catalysts. In the case of calcined materials, the CuAl oxi catalyst exhibited the best activity, obtaining 31% degradation of COD in the CWAO of phenol. Contrary to the case of reduced materials, where the catalyst CuCe red exhibited the best activity, obtaining a 22% of COD degradation in the CWAO of phenol. Therefore, the calcined copper catalysts showed better catalytic performance than the reduced copper catalysts.
CWAO experiments were carried out for catalysts NiO/γ-Al2O3, NiO/CeO2, and NiO/Al2O3–CeO2, under the following reaction conditions: phenol initial concentration of 1000 ppm, oxygen partial pressure of 10 bar and 120 °C. Before that, the calcination thermal treatment under O2 flow were executed; as well as catalysts reduced under H2 flow such as Ni/γ-Al2O3, Ni/CeO2, Ni/Al2O3–CeO2.
According to Fig. 15, the conversion rate of phenol increased as time progressed. The phenol conversion rate for the calcined nickel materials reached 34% after 180 min on the catalyst NiAl oxi, while it was only 31% and 32% on the catalysts NiAlCe oxi and NiCe oxi, respectively. In the case of reduced nickel catalysts, the conversion rate of phenol reached 51% after 180 min on the NiAlCe red catalyst, whereas it was only 41% and 36% on the catalysts NiCe red and NiAl red, respectively.
The changes in the efficiency of COD degradation of supported nickel catalysts were given in Fig. 16. In the case of the calcined materials, the catalyst NiAl oxi exhibited the best activity, obtaining 22% degradation of COD in the CWAO of phenol. Contrary to the case of reduced materials, catalyst NiCe red exhibited the best activity, obtaining 42% of COD degradation in the CWAO of phenol. As a result, reduced nickel catalysts showed better catalytic performance than the calcined nickel catalysts.
The synthesized catalysts CuAl oxi and NiCe red in this study acquired remarkable structural characteristics to oxidize organic matter, which was observed through the results of XRD, UV-Vis DR, H2-TPR, for the CWAO of phenol at milder conditions, since they generate more reactive sites as compared to their monometallic counterparts, and they surely promote OH˙ radical formation. The latter are the last responsible of mineralizing the present organic matter, such a trace of phenol and reaction intermediates on the treated solutions, which has already been reported by various authors.9,16,28 Table 3 reports the activity results of both metals in the CWAO of phenol. It was possible to identify reaction products in these experiments through the GC, catechol, in very low concentrations for almost all supported copper catalysts, and in the case of nickel catalysts, some were not detected at the end time.11,34 The above mentioned corroborated the most notable nickel activity results compared to copper ones.
| Catalysts | XC a (%) | XCODa (%) | A a (mmol l−1) | ria (mmol h−1 gphenol−1) |
|---|---|---|---|---|
| a Obtained after 180 min of reaction, n.d. not detected. | ||||
| CuCe oxi | 47 | 15 | 10 | 404 |
| CuAl oxi | 36 | 31 | 29 | 341 |
| CuAlCe oxi | 55 | 10 | 38 | 809 |
| CuCe red | 32 | 22 | n.d. | 213 |
| CuAl red | 34 | 3 | 32 | 319 |
| CuAlCe red | 54 | 8 | 27 | 681 |
| NiCe red | 41 | 42 | 16 | 319 |
| NiAl red | 36 | 17 | n.d. | 447 |
| NiAlCe red | 51 | 31 | 10 | 292 |
| NiAl oxi | 34 | 22 | n.d. | 575 |
| NiCe oxi | 32 | 10 | n.d. | 617 |
| NiAlCe oxi | 31 | 6 | n.d. | 149 |
Conclusion
The present work studied that the calcined materials of Cu have different types of copper species that coexist; highly dispersed CuO particles that almost do not interact with the support and CuO species with a higher degree of interaction. The reducibility was better for CuAl oxi which presented the reduction peaks at the lowest temperature values, while the intensity of the signal assigned for highly dispersed CuO species, is larger for this material. In addition, only the CuAl oxi presented a population of Cu2O species and a greater population of CuO species in octahedral coordination, in comparison to the other Cu materials. On the contrary, the use of urea together with the nickel oxide precursor for the preparation of supported Ni catalysts resulted in a much greater dispersion of the Ni-calcined materials, that is maintained in the reduced Ni catalysts, compared to the copper. The improved dispersion in Ni of the catalysts prepared with urea also can be attributed to the strong metal–support interaction with the ceria support especially, which allows to retain its small particle size after reduction. The NiCe red catalyst mainly differs in the population of octahedral and tetrahedral nickel species. In the case of nickel, the conversion of COD into CWAO of phenol was affected by the population of octahedral and tetrahedral species. So this study found that Ni catalysts with a higher population of octahedral species are more active than those that contain a higher population of tetrahedral species. The catalyst NiCe red prepared with the urea ligand showed a remarkable improvement in the catalytic activity by CWAO of phenol under milder conditions, as compared to those prepared with Cu and the urea ligand. Therefore, the addition of urea in the wet impregnation method was decisive to improve the reducibility and dispersion degree in the Ni, and in lesser extent, in Cu, and furthermore these results improved the activity of the catalysts.Conflicts of interest
All authors declare no conflicts of interest.Acknowledgements
We thank CONACYT for the finance support of the project 132648 and the PhD scholarship to Zenaida Guerra Que, who in addition thanks the Universidad Juárez Autónoma de Tabasco for financing the PFCE-DACB Project 2017–2018.References
- J. Mikulová, J. Barbier, S. Rossignol, D. Mesnard, D. Duprez and C. Kappenstein, J. Catal., 2007, 251, 172–181, DOI:10.1016/j.jcat.2007.07.008.
- J. Wang, W. Zhu, X. He and S. Yang, Catal. Commun., 2008, 9, 2163–2167, DOI:10.1016/j.catcom.2008.04.019.
- J. Vittenet, W. Aboussaoud, J. Mendret, J. S. Pic, H. Debellefontaine, N. Lesage, K. Faucher, M. H. Manero, F. Thibault-Starzyk, H. Leclerc, A. Galarneau and S. Brosillon, Appl. Catal., A, 2015, 504, 519–532, DOI:10.1016/j.apcata.2014.10.037.
- M. Luan, G. Jing, Y. Piao, D. Liu and L. Jin, Arabian J. Chem., 2017, 10, S769–S776, DOI:10.1016/j.arabjc.2012.12.003.
- J. Gaálová, J. Barbier and S. Rossignol, J. Hazard. Mater., 2010, 181, 633–639, DOI:10.1016/j.jhazmat.2010.05.059.
- M. Shahzad, S. A. Razzak and M. M. Hossain, Atmos. Environ., 2016, 140, 117–134, DOI:10.1016/j.atmosenv.2016.05.031.
- N. Perkas, D. P. Minh, P. Gallezot, A. Gedanken and M. Besson, Appl. Catal., B, 2005, 59, 121–130, DOI:10.1016/j.apcatb.2005.01.009.
- P. Kumar, P. V. K. Raghavendra and S. Chand, J. Sci. Ind. Res., 2006, 65, 838–842 CAS.
- J. Fu and G. Z. Kyzas, J. Catal., 2014, 35, 1–7, DOI:10.1016/S1872-2067(12)60724-4.
- L. Hu, X. Liu, Q. Wang and Y. Zhou, RSC Adv., 2017, 7, 21507–21517, 10.1039/C7RA00545H.
- A. Massa, S. Hernández, S. Ansaloni, M. Castellino, N. Russo and D. Fino, Electrochim. Acta, 2018, 273, 53–62, DOI:10.1016/j.electacta.2018.03.178.
- Z. Wang, C. W. Kee, S. Li, T. S. A. Hor and J. Zhao, Appl. Catal., A, 2011, 393, 269–274, DOI:10.1016/j.apcata.2010.12.003.
- S. Keav, A. E. de los Monteros, J. Barbier and D. Duprez, Appl. Catal., B, 2014, 150–151, 402–410, DOI:10.1016/j.apcatb.2013.12.028.
- R. Kouraichi, J. J. Delgado, J. D. López-Castro, M. Stitou, J. M. Rodríguez-Izquierdo and M. A. Cauqui, Catal. Today, 2010, 154, 195–201, DOI:10.1016/j.cattod.2010.04.020.
- M. Wang and Y. Chen, Chemosphere, 2018, 201, 96–109, DOI:10.1016/j.chemosphere.2018.02.124.
- F. Arena, C. Italiano, A. Raneri and C. Saja, Appl. Catal., B, 2010, 99, 321–328, DOI:10.1016/j.apcatb.2010.06.039.
- J. Herney-Ramirez, M. A. Vicente and L. M. Madeira, Appl. Catal., B, 2010, 98, 10–26, DOI:10.1016/j.apcatb.2010.05.004.
- A. Barrera, F. Tzompantzi, J. Campa-Molina, J. E. Casillas, R. Pérez-Hernández, S. Ulloa-Godínez, C. Velázquez and J. Arenas-Alatorre, RSC Adv., 2018, 8, 3108–3119, 10.1039/C7RA12665D.
- M. Haruta, Catal. Today, 1997, 36, 153–166, DOI:10.1016/S0920-5861(96)00208-8.
- B. R. Cuenya, Thin Solid Films, 2010, 518, 3127–3150, DOI:10.1016/j.tsf.2010.01.018.
- Y. Nagai, K. Dohmae, Y. Ikeda, N. Takagi, N. Hara, T. Tanabe, G. Guilera, S. Pascarelli, M. A. Newton, N. Takahashi, H. Shinjoh and S. Matsumoto, Catal. Today, 2011, 175, 133–140, DOI:10.1016/j.cattod.2011.02.046.
- G. Pantaleo, V. La Parola, F. Deganello, P. Calatozzo, R. Bal and A. M. Venezia, Appl. Catal., B, 2015, 164, 135–143, DOI:10.1016/j.apcatb.2014.09.011.
- Anushree, S. Kumar and C. Sharma, J. Environ. Chem. Eng., 2017, 5, 3914–3921, DOI:10.1016/j.jece.2017.07.061.
- Y. Wang, C. Yu, X. Meng, P. Zhao and L. Chpu, RSC Adv., 2017, 7, 39796–39802 RSC.
- P. Massa, F. Ivorra, P. Haure and R. Fenoglio, Catal. Commun., 2009, 10, 1706–1710, DOI:10.1016/j.catcom.2009.05.014.
- T. M. Neves, T. S. Frantz, E. C. C. do Schenque, M. A. Gelesky and V. B. Mortola, Environ. Technol. Innov., 2017, 8, 349–359, DOI:10.1016/j.eti.2017.08.003.
- T. K. Nevanpera, S. Ojala, N. Bion, F. Epron and R. L. Keiski, Appl. Catal., B, 2016, 182, 611–625, DOI:10.1016/j.apcatb.2015.10.012.
- L. Hua, H. Ma and L. Zhang, Chemosphere, 2013, 90, 143–149, DOI:10.1016/j.chemosphere.2012.06.018.
- C. Yu, X. Meng, G. Chen and P. Zhao, RSC Adv., 2016, 6, 22633–22638 RSC.
- F. Lu, C. Yu, X. Meng, J. Zhang, G. Chen and P. Zhao, RSC Adv., 2016, 6, 73810–73816 RSC.
- F. Lu, C. Yu, X. Meng, G. Chen and P. Zhao, New J. Chem., 2017, 41, 3280–3289 RSC.
- M. Dükkancı and G. Gündüz, Catal. Commun., 2009, 10, 913–919, DOI:10.1016/j.catcom.2008.12.022.
- A. Cervantes, G. Del Angel, G. Torres, G. Lafaye, J. Barbier Jr, J. N. Beltramini, J. G. Cabañas-Moreno and A. Espinoza de los Monteros, Catal. Today, 2013, 212, 2–9, DOI:10.1016/j.cattod.2012.11.021.
- A. E. D. L. Monteros, G. Lafaye, A. Cervantes, G. Del Angel, J. Barbier and G. Torres, Catal. Today, 2015, 258, 564–569, DOI:10.1016/j.cattod.2015.01.009.
- Z. Boukha, L. Ayastuy, A. Iglesias-González, B. Pereda-Ayo, M. A. Gutiérrez- Ortiz and J. R. González-Velasco, Int. J. Hydrogen Energy, 2015, 40, 7318–7330 CrossRef CAS.
- J. Zhao, Y. Li, Y. Zhu, Y. Wang and C. Wang, Appl. Catal., A, 2016, 510, 34–41, DOI:10.1016/j.apcata.2015.11.001.
- K. N. Papageridis, G. Siakavelas, N. D. Charisiou, D. G. Avraam, L. Tzounis, K. Kousi and M. A. Goula, Fuel Process. Technol., 2016, 152, 156–175, DOI:10.1016/j.fuproc.2016.06.024.
- D. Tsai and T. Huang, Appl. Catal., A, 2002, 223, 1–9 CrossRef CAS.
- T. R. Reina, S. Ivanova, M. A. Centeno and J. A. Odriozola, Appl. Catal., B, 2016, 197, 67–72, DOI: DOI: DOI: 10.1016/j.apcatb.2016.01.031.
- M. H. Amin, K. Mantri, J. Newnham, J. Tardio and S. K. Bhargava, Appl. Catal., B, 2012, 120, 217–226 CrossRef.
- M. Ding, J. Tu, Q. Zhang, M. Wang, N. Tsubaki, T. Wang and L. Ma, Biomass Bioenergy, 2016, 85, 12–17 CrossRef CAS.
- Y. Lu, S. Li, L. Guo and X. Zhang, Int. J. Hydrogen Energy, 2010, 35, 7161–7168, DOI:10.1016/j.ijhydene.2009.12.047.
- G. Nahar, V. Dupont, M. V. Twigg and E. Dvininov, Appl. Catal., B, 2015, 169, 228–242 CrossRef.
- M. Dan, M. Mihet, Z. Tasnadi-Asztalos, A. Imre-Lucaci, G. Katona and M. D. Lazar, Fuel, 2015, 147, 260–268, DOI:10.1016/j.fuel.2015.01.050.
- M. Parvas, M. Haghighi and S. Allahyari, Arabian J. Chem., 2014 DOI:10.1016/j.arabjc.2014.10.043.
- G. Ovejero, A. Rodríguez, A. Vallet and J. García, Chem. Eng. J., 2013, 215–216, 168–173 CrossRef CAS.
- N. A. Fathy, S. M. El-Khouly, N. A. Hassan and R. M. S. Awad, J. Water Process Eng., 2017, 16, 21–27 CrossRef.
- Q. Bkour, O. G. Marin-Flores, T. R. Graham, P. Ziaei, S. R. Saunders, M. G. Norton and S. Ha, Appl. Catal., A, 2017, 546, 126–135 CrossRef CAS.
- B. M. Güell, I. V. Babich, L. Lefferts and K. Seshan, Appl. Catal., B, 2011, 106, 280–286 CrossRef.
- E. Del Río, D. Gaona, J. C. Hernández-Garrido, J. J. Calvino, M. G. Basallote, M. J. Fernández-Trujillo, J. A. Pérez-Omil and J. M. Gatica, J. Catal., 2014, 318, 119–127 CrossRef.
- B. Zhao, Z. Chen, Y. Chen and X. Ma, Int. J. Hydrogen Energy, 2017, 42, 27073–27083, DOI:10.1016/j.ijhydene.2017.09.068.
- Z. Guerra-Que, G. Torres-Torres, H. Pérez-Vidal, I. Cuauhtémoc-López, A. Espinoza de los Monteros, J. N. Beltramini and D. M. Frías-Márquez, RSC Adv., 2017, 7, 3599–3610, 10.1039/C6RA25684H.
- Z. Abbasi, M. Haghighi, E. Fatehifar and S. Saedy, J. Hazard. Mater., 2011, 186, 1445–1454, DOI:10.1016/j.jhazmat.2010.12.034.
- L. E. Chinchilla, C. M. Olmos, A. Villa, A. Carisson, L. Prati, X. Chen, G. Blanco, J. J. Calvino and A. B. Hungría, Catal. Today, 2015, 253, 178–189, DOI:10.1016/j.cattod.2015.02.030.
- A. B. Ayusheev, O. P. Taran, I. A. Seryak, O. Y. Podyacheva, C. Descorme, M. Besson, L. S. Kibis, A. I. Boronin, A. I. Romanenko, Z. R. Ismagilov and V. Parmon, Appl. Catal., B, 2014, 146, 177–185, DOI: DOI: 10.1016/j.apcatb.2013.03.017.
- P. Kaminski, M. Ziolek, B. Campo and M. Daturi, Catal. Today, 2015, 243, 218–227, DOI:10.1016/j.cattod.2014.08.035.
- Z. Wang, L. Yang, R. Zhang, L. Li, Z. Cheng and Z. Zhou, Catal. Today, 2015, 264 DOI:10.1016/j.cattod.2015.08.018.
- C. Wang, F. Yu, M. Zhu, C. Tang, K. Zhang, D. Zhao, L. Dong and B. Dai, J. Environ. Sci., 2018 DOI:10.1016/j.jes.2018.03.011.
- X. Liao, Y. Zhang, M. Hill, X. Xia, Y. Zhao and Z. Jiang, Appl. Catal., A, 2014, 488, 256–264, DOI:10.1016/j.apcata.2014.09.042.
- K. Baranowska, J. Okal and W. Tylus, Appl. Catal., A, 2016, 511, 117–130, DOI:10.1016/j.apcata.2015.11.045.
- Y. Jiao, J. Zhang, Y. Du, D. Sun, J. Wang, Y. Chen and J. Lu J, Int. J. Hydrogen Energy, 2016, 41, 10473–10479 CrossRef CAS.
- J. L. Ayastuy, A. Gurbani, M. P. González-Marcos and M. A. Gutiérrez-Ortiz, Int. J. Hydrogen Energy, 2010, 35, 1232–1241, DOI:10.1016/j.ijhydene.2009.11.098.
- B. Putrakumar, N. Nagaraju, V. P. Kumar and K. V. R. Chary, Catal. Today, 2015, 250, 209–217, DOI:10.1016/j.cattod.2014.07.014.
- M. Hatanaka, N. Takahashi, T. Tanabe, Y. Nagai, K. Dohmae, Y. Aoki, T. Yoshida and H. Shinjoh, Appl. Catal., B, 2010, 99, 336–342, DOI:10.1016/j.apcatb.2010.07.003.
- P. Kaminski and M. Ziolek, Appl. Catal., B, 2016, 87, 328–341, DOI:10.1016/j.apcatb.2016.01.040.
- M. L. Saladino, D. F. C. Martino, E. Kraleva and E. Caponetti, Catal. Commun., 2013, 36, 10–15, DOI:10.1016/j.catcom.2013.02.023.
- S. Zhou, Z. Qian, T. Sun, J. Xu and C. Xia, Appl. Clay Sci., 2011, 53, 627–633, DOI:10.1016/j.clay.2011.05.013.
- L. Rout, A. Kumar, R. S. Dhaka, G. N. Reddy, S. Giri and P. Dash, Appl. Catal., A, 2017, 538, 107–122, DOI:10.1016/j.apcata.2017.03.017.
- S. Sepehri, M. Rezaei, G. Garbarino and G. Busca, Int. J. Hydrogen Energy, 2016, 41, 3456–3463, DOI:10.1016/j.ijhydene.2015.12.122.
- P. Priecel, D. Kubička, L. Čapek, Z. Bastl and P. Ryšánek, Appl. Catal., A, 2011, 397, 127–137, DOI:10.1016/j.apcata.2011.02.022.
- B. Li, X. Lin, Y. Luo, X. Yuan and X. Wang, Fuel Process. Technol., 2018, 176, 153–166 CrossRef CAS.
- G. Garbarino, S. Chitsazan, T. K. Phung, P. Riani and G. Busca, Appl. Catal., A, 2015, 505, 86–97, DOI:10.1016/j.apcata.2015.07.017.
- E. Moretti, L. Storaro, A. Talon, S. Chitsazan, G. Garbarino, G. Busca and E. Finocchio, Fuel, 2015, 153, 166–175, DOI:10.1016/j.fuel.2015.02.077.
- K. P. O. Mahesh and D. H. Kuo, Appl. Surf. Sci., 2015, 357, 433–438, DOI:10.1016/j.apsusc.2015.08.264.
- S. Li, Y. Lu, L. Guo and X. Zhang, Int. J. Hydrogen Energy, 2011, 36, 14391–14400, DOI:10.1016/j.ijhydene.2011.07.144.
- A. De Lucas-consuegra, A. Princivalle, A. Caravaca, F. Dorado and A. Marouf, Appl. Catal., A, 2009, 365, 274–280, DOI:10.1016/j.apcata.2009.06.026.
- A. T. Gremminger, H. W. Pereira De Carvalho, R. Popescu, J. D. Grunwaldt and O. Deutschmann, Catal. Today, 2015, 258, 470–480, DOI:10.1016/j.cattod.2015.01.034.
- J. Bian, M. Xiao, S. J. Wang, Y. X. Lu and Y. Z. Meng, Catal. Commun., 2009, 10, 1529–1533, DOI:10.1016/j.catcom.2009.04.009.
- A. Bazyari, Y. Mortazavi, A. A. Khodadadi, L. T. Thompson, R. Tafreshi, A. Zaker and O. T. Ajenifujah, Appl. Catal., B, 2016, 180, 312–323, DOI:10.1016/j.apcatb.2015.06.025.
- Z. Khan, S. A. Al-Thabaiti, A. Y. Obaid, M. A. Malik, M. N. Khan and T. A. Khan, J. Mol. Liq., 2016, 222, 272–278, DOI:10.1016/j.molliq.2016.07.043.
- M. Bai, H. Xin, Z. Guo, D. Guo, Y. Wang, P. Zhao and J. Li, Appl. Surf. Sci., 2017, 391, 617–626, DOI:10.1016/j.apsusc.2016.07.020.
- J. Han, H. J. Kim, S. Yoon and H. Lee, J. Mol. Catal. A: Chem., 2011, 335, 82–88, DOI:10.1016/j.molcata.2010.11.017.
- A. Aboukaïs, M. Skaf, S. Hany, R. Cousin, S. Aouad, M. Labaki and E. Abi-Aad, Mater. Chem. Phys., 2016, 177, 570–576, DOI:10.1016/j.matchemphys.2016.04.072.
- F. E. López-Suárez, A. Bueno-López and M. J. Illán-Gómez, Appl. Catal., B, 2008, 84, 651–658, DOI:10.1016/j.apcatb.2008.05.019.
- L. Kundakovic, Catal. Today, 1998, 221, 203–221 CrossRef.
- D. G. Araiza, A. Gómez-Cortés and G. Díaz, Catal. Today, 2017, 282, 185–194, DOI:10.1016/j.cattod.2016.06.055.
- K. N. Rao, P. Bharali, G. Thrimurthulu and B. M. Reddy, Catal. Commun., 2010, 11, 863–866, DOI:10.1016/j.catcom.2010.03.009.
- M. Turco, C. Cammarano, G. Bagnasco, E. Moretti, L. Storaro, A. Talon and M. Lenarda, Appl. Catal., B, 2009, 91, 101–107, DOI:10.1016/j.apcatb.2009.05.011.
- Y. Yu, W. Zhan, Y. Guo, G. Lu, S. Adjimi and Y. Guo, J. Mol. Catal. A: Chem., 2014, 395, 392–397, DOI:10.1016/j.molcata.2014.09.001.
- Y. Chen, W. Zhou, Z. Shao and N. Xu, Catal. Commun., 2008, 9, 1418–1425, DOI:10.1016/j.catcom.2007.12.009.
- P. Gayán, C. Dueso, A. Abad, J. Adanez, L. F. de Diego and F. García-Labiano, Fuel, 2009, 88, 1016–1023, DOI:10.1016/j.fuel.2008.12.007.
- Y. S. Jung, W. L. Yoon, T. W. Lee, Y. W. Rhee and Y. S. Seo, Int. J. Hydrogen Energy, 2010, 35, 11237–11244, DOI:10.1016/j.ijhydene.2010.07.035.
- M. E. Bertone, C. I. Meyer, S. A. Regenhardt, V. Sebastian, T. F. Garetto and A. J. Marchi, Appl. Catal., A, 2015, 503, 135–146, DOI:10.1016/j.apcata.2015.07.013.
- Y. Gao, F. Meng, K. Ji, Y. Song and Z. Li, Appl. Catal., A, 2016, 510, 74–83, DOI:10.1016/j.apcata.2015.11.006.
- G. Ranga Rao, S. K. Meher, B. G. Mishra and P. H. K. Charan, Catal. Today, 2012, 198, 140–147, DOI:10.1016/j.cattod.2012.06.027.
- S. Xu and X. Wang, Fuel, 2005, 84, 563–567, DOI:10.1016/j.fuel.2004.10.008.
- T. A. Le, M. S. Kim, S. H. Lee, T. W. Kim and E. D. Park, Catal. Today, 2017, 293–294, 89–96, DOI:10.1016/j.cattod.2016.12.036.
- S. Yang, W. Zhu, J. Wang and Z. Chen, J. Hazard. Mater., 2008, 153, 1248–1253, DOI:10.1016/j.jhazmat.2007.09.084.
| This journal is © The Royal Society of Chemistry 2019 |


