 Open Access Article
Pitch-based carbon/nano-silicon composite, an efficient anode for Li-ion batteries†
Angel Manuel Escamilla-Péreza,
Aude Rolanda,
Sophie Girauda,
Céline Guirauda,
Héloïse Virieuxb,
Kévin Demoulinb,
Yohan Oudart*b,
Nicolas Louvainac and
Laure Monconduit *ac
*ac
aInstitut Charles Gerhardt Montpellier, CNRS UMR 5253, Univ. Montpellier, 34095 Montpellier, France. E-mail: laure.monconduit@umontpellier.fr
bNanomakers, 1 rue de Clairefontaine, 78120 Rambouillet, France. E-mail: youdart@nanomakers.fr
cRéseau sur le Stockage Electrochimique de l'Energie (RS2E), CNRS FR3459, 33 Rue Saint Leu, 80039 Amiens, Cedex, France
First published on 4th April 2019
Abstract
As silicon–carbon electrodes with low silicon ratio are the negative electrode foreseen by battery manufacturers for the next generation of Li-ion batteries, a great effort has to be made to improve their efficiency and decrease their cost. Pitch-based carbon/nano-silicon composites are proposed as a high performance and realistic electrode material of Li-ion battery anodes. Composites are prepared in a simple way by the pyrolysis under argon atmosphere of silicon nanoparticles, obtained by a laser pyrolysis technique, and a low cost carbon source: petroleum pitch. The effect of the size and the carbon coating of the silicon nanoparticles on the electrochemical performance in Li-ion batteries is highlighted, proving that the carbon coating enhances cycling stability. Helped by a homogeneous dispersion of silicon nanoparticles into the amorphous carbon matrix, a high coulombic efficiency (especially in the first cycle) and a high stability over cycling is observed (over 1100 mA h g−1 after 100 cycles at relatively high current density 716 mA g−1 for Si based electrodes), which are superior to pitch-based carbon/silicon composites found in literature. This simple synthesis method may be extrapolated to other electrode active materials.
1. Introduction
The first Li-ion battery was commercialized by Sony in 1991 using LiCoO2 and graphitic carbon as electrodes (i.e. cathode and anode respectively).1 This energy storage device marked a new area for the secondary batteries benefiting for the reversible exchange of lithium ions between the two electrodes. Nowadays, Li-ion batteries are ubiquitous and dominate the portable storage market. However, their utilization for high-energy applications is limited and it presents a huge social challenge for the years to come, especially for electric and hybrid electric vehicles (EVs and HEVs respectively).2 One strategy, praised by both academics and industry, focuses on the application of high capacity electrode materials, notably silicon, as it is considered an attractive graphite substitute in Li-ion battery anodes. Silicon exhibits the highest theoretical capacity of 4200 mA h g−1 (against 372 mA h g−1 for graphite) when fully lithiated (i.e. Li22Si5, or Li4.4Si). However, the Li15Si4 phase is the highest lithiated silicon phase electrochemically achievable at ambient temperature (3579 mA h g−1).3–5 Silicon presents a lithiation potential close to graphite (i.e. 0.4 V vs. Li+/Li) and it is the second most abundant element in the Earth's crust.2,6,7 Unlike graphite, which intercalates lithium ions into its sheets, silicon forms LixSi alloys (0 < x < 3.75) generating drastic volume modifications during the lithiation/delithiation process. Indeed, this large volume expansion (up to 300% for the most lithiated form) is the main issue that limits the use of silicon as an anode material in Li-ion batteries. Besides, after different charge/discharge cycles, the electrode endures severe modifications inducing electrode disconnection with the collector, active material pulverization, SEI (Solid Electrolyte Interphase) layer instability and capacity fading; silicon also suffers from low electrical conductivity.6–8Nanostructuration is a promising solution to overcome volume expansion and strain problems of silicon. Thus different nanoparticles and nano-objects (0D, 1D, 2D and 3D) have been analyzed in the last decade.6,9 Nanoparticles exhibit smaller volume modification than their micron-sized counterparts. It has been demonstrated that silicon nanoparticles (Si-NPs) smaller than 150 nm avoid the formation of fissures upon the first lithiation,10 therefore reducing the mechanical strain and preventing deformation and cracking of the electrodes.11,12 Besides, Wang et al.13 also proved that reducing the particle size of silicon promotes higher specific capacities and improves the capacity retention. Indeed, particle size optimization is vital in order to reach the best performances.14 In addition to the particle size, the surface of the particles is of utmost importance. Silicon particles exhibit a silicon oxide layer, composed by silanol groups (SiOH), which are in close interaction with the binder. The nature of these bonds strongly affects the cycle life of the electrode.15 Unlike poly(vinylidene fluoride) (PVDF), aqueous binders such as carboxymethyl cellulose (CMC) or poly(acrylic acid) (PAA) enhance the electrochemical performances of silicon electrodes.16–19 In fact, a pH = 3 buffer promotes the formation of covalent bonds by the esterification between the SiOH groups from silicon and the R–COOH groups from the CMC. The presence of these bonds increases the mechanical strength of the electrode, thus tolerating much better the volume modifications and, consequently, improving the electrochemical performances.9,15–17,20,21
Recently, researches have trended towards the formulation of nanocomposites or hierarchical nanostructured materials in order to enhance the cycling performances of silicon-based anodes.6 The use of carbonaceous coatings or carbonaceous matrix on Si-NPs opens different possibilities of improvement. On one side, carbon can absorb the volume expansion of silicon during lithiation and, on the other side, it can also afford the electron conductivity of the electrode (i.e. conducting material).12 One carbon source that has been taking interest, as a pyrolytic carbon source, is petroleum and coal tar pitches. Pitch is an economic raw material composed essentially by a mixture of aromatic hydrocarbons.22–24 It is obtained as an industrial by-product and its application as carbon precursor will allow the synthesis of high value-added storage materials. Indeed, pitch has been successfully used as a carbonaceous matrix25–28 or as a secondary coating29–31 in silicon-based anodes enhancing their electrochemical performances and their capacity retention. Moreover, the process to obtain the Si/carbon pitch composites relies on pyrolysis, in an analogous way than graphite with the advantage of lower pyrolysis temperature (below 1000 °C) and shorter pyrolysis time.
Inspired by the possibilities of value-added of this raw material, we propose the facile preparation of silicon/carbon nanocomposites using carbon-coated silicon nanoparticles (<100 nm) and a petroleum pitch as anode materials for Li-ion batteries. The as prepared silicon/carbon composites electrodes were electrochemically evaluated, and showed a good capacity retention (around 90% of the first reversible capacity) after 100 cycles.
2. Experimental
2.1 Silicon nanoparticles and pitch
Crystalline silicon nanoparticles (Si-NPs), supplied by Nanomakers, are produced at industrial scale by laser pyrolysis technique.32 Carbon coated and uncoated Si-NPs of two sizes (40 and 75 nm) were kept in inert argon atmosphere to prevent their alteration/oxidation. TEM images of coated and uncoated Si-NPs are given in ESI (Fig. S1†) which show the size and their organization in rosary. Petroleum pitches (ZL 118 M and ZL 250M, with softening point of 118 and 250 °C respectively) were supplied by Rütgers. Materials were used as received. Nomenclature and textural data of the Si-NPs are presented in Table 1 and detailed in Fig. S2.†| Sample | Carbon coating | SBET (m2 g−1) | Particle size (nm) |
|---|---|---|---|
| Si_40 | No | 58 | 40 |
| Si_40C | Yes | 61 | 40 |
| Si_75 | No | 34 | 75 |
| Si_75C | Yes | 32 | 75 |
2.2 Silicon-carbon composites
The silicon-carbon composites were prepared as follows: 1.285 g of pitch (carbon precursor) were dissolved in 25 mL of tetrahydrofuran (THF, Sigma Aldrich, HPLC grade); meanwhile, 0.100 g of Si-NPs were dispersed in 12.5 mL of THF. The solution and the dispersion were kept under sonication for 10 min (37 kHz, 35 W). Then, the silicon dispersion was added to the pitch solution and kept 1 h under magnetic stirring for homogenization at room temperature. The resulting mixture was placed in an oil bath and heat up to 75 °C to slowly evaporate the THF. After 5 hours, a dark paste was obtained, placed in an alumina boat, and subsequently dried under vacuum in a glass oven (B-585 Drying Büchi) at 90 °C for 3 h. The dried materials were pyrolyzed in tubular oven under an argon flow of 0.1 L min−1 at 400 °C for 4 h and 900 °C for 3 hours (heating rate 10 °C min−1) to obtain the C/Si composites. The content of silicon in composites after pyrolysis was estimated by thermogravimetric analysis (Fig. S3†) to be approximately 12 wt%. Pyrolyzed pitch samples without silicon (named hereafter_118M and _250M respectively) were prepared using the same procedure, excluding the presence of silicon, for comparison.2.3 Characterization
X-ray diffraction patterns were recorded on a PANalytical X'Pert Pro MDP diffractometer, with the Kα radiation of Cu (λ = 1.5418 Å) and a step size of 0.033° (2θ scale) into the 10–70° interval. Scanning electron micrographs and energy-dispersive X-ray spectroscopy analysis were performed on a FEI Quanta FEG 200 scanning electron microscope. N2 physisorption experiments were carried out on a BELSORP-mini.Galvanostatic electrochemical characterizations were performed at room temperature on a BCS-805 battery cycling system (10 V, 150 mA) from BioLogic Science Instruments using CR2032-type coin cells. Two different electrode formulations were prepared depending on the presence or absence of pitch. Silicon-based electrodes were composed of Si-NPs (18 wt%), Super P (35 wt%, Imerys), VGCF carbon fibers (35 wt%, Showa Denko K.K.) and carboxymethyl cellulose (CMC, 12 wt%, Sigma Aldrich, Mw ≈ 250![[thin space (1/6-em)]](https://www.rsc.org/images/entities/char_2009.gif) 000 g mol−1). Composite-based electrodes were composed of C/Si composite (80 wt%), Super P (2.5 wt%), VGCF carbon fibers (2.5 wt%) and CMC (15 wt%). It is noteworthy that the amount of silicon in composite-based electrodes is 10 wt%. Slurries were stirred in ultrapure water and tape casted uniformly at 100 μm onto a copper current collector (Goodfellow Cu sheet 99.9%, with a thickness of 0.0175 mm) using a 3540 bird film applicator from Elcometer. The 12.7 mm diameter electrodes (containing 0.21 mg cm−2 and 0.12 mg cm−2 of Si for the single Si-NPS and for the C/Si composites, respectively) were cut with a disk cutter and then dried under vacuum at 90 °C overnight. Coin cell assemblage was performed in a glove box (M-Braun, O2 < 5 ppm, H2O < 5 ppm). Lithium metal (Sigma Aldrich, 99.9%) was used both as reference and as counter electrode and Whatman glass fiber filters as the separator. The electrolyte was a 1 M LiPF6 solution in propylene carbonate, ethylene carbonate, and dimethyl carbonate (PC
000 g mol−1). Composite-based electrodes were composed of C/Si composite (80 wt%), Super P (2.5 wt%), VGCF carbon fibers (2.5 wt%) and CMC (15 wt%). It is noteworthy that the amount of silicon in composite-based electrodes is 10 wt%. Slurries were stirred in ultrapure water and tape casted uniformly at 100 μm onto a copper current collector (Goodfellow Cu sheet 99.9%, with a thickness of 0.0175 mm) using a 3540 bird film applicator from Elcometer. The 12.7 mm diameter electrodes (containing 0.21 mg cm−2 and 0.12 mg cm−2 of Si for the single Si-NPS and for the C/Si composites, respectively) were cut with a disk cutter and then dried under vacuum at 90 °C overnight. Coin cell assemblage was performed in a glove box (M-Braun, O2 < 5 ppm, H2O < 5 ppm). Lithium metal (Sigma Aldrich, 99.9%) was used both as reference and as counter electrode and Whatman glass fiber filters as the separator. The electrolyte was a 1 M LiPF6 solution in propylene carbonate, ethylene carbonate, and dimethyl carbonate (PC![[thin space (1/6-em)]](https://www.rsc.org/images/entities/char_2009.gif) :
:![[thin space (1/6-em)]](https://www.rsc.org/images/entities/char_2009.gif) EC
EC![[thin space (1/6-em)]](https://www.rsc.org/images/entities/char_2009.gif) :
:![[thin space (1/6-em)]](https://www.rsc.org/images/entities/char_2009.gif) DMC, 1
DMC, 1![[thin space (1/6-em)]](https://www.rsc.org/images/entities/char_2009.gif) :
:![[thin space (1/6-em)]](https://www.rsc.org/images/entities/char_2009.gif) 1
1![[thin space (1/6-em)]](https://www.rsc.org/images/entities/char_2009.gif) :
:![[thin space (1/6-em)]](https://www.rsc.org/images/entities/char_2009.gif) 3 vol%) with 5% fluoroethylene carbonate (FEC) and 1% vinyl carbonate (VC). The electrochemical galvanostatic measurements were performed in the voltage range of 1.50–0.01 V vs. Li+/Li at a current density of C/20 (179 mA g−1) for the first cycle and then C/5 (716 mA g−1) for the further cycles. Once the lower voltage limit has been reached, the potential was held constant (10 mV) until the current dropped to C/100 (36 mA g−1) for a maximum of 50 h (or 100 h for the first cycle). The weight of carbon (carbon fibers, Super P and pitch-based carbon) and the C-coated or uncoated silicon nanoparticles was considered for the gravimetric capacity calculated per gram of Si and carbon. A graphic summary of the cycling conditions is provided in ESI (Fig. S4†).
3 vol%) with 5% fluoroethylene carbonate (FEC) and 1% vinyl carbonate (VC). The electrochemical galvanostatic measurements were performed in the voltage range of 1.50–0.01 V vs. Li+/Li at a current density of C/20 (179 mA g−1) for the first cycle and then C/5 (716 mA g−1) for the further cycles. Once the lower voltage limit has been reached, the potential was held constant (10 mV) until the current dropped to C/100 (36 mA g−1) for a maximum of 50 h (or 100 h for the first cycle). The weight of carbon (carbon fibers, Super P and pitch-based carbon) and the C-coated or uncoated silicon nanoparticles was considered for the gravimetric capacity calculated per gram of Si and carbon. A graphic summary of the cycling conditions is provided in ESI (Fig. S4†).
3. Results and discussion
3.1 Electrochemical performances of silicon nanoparticles without composite
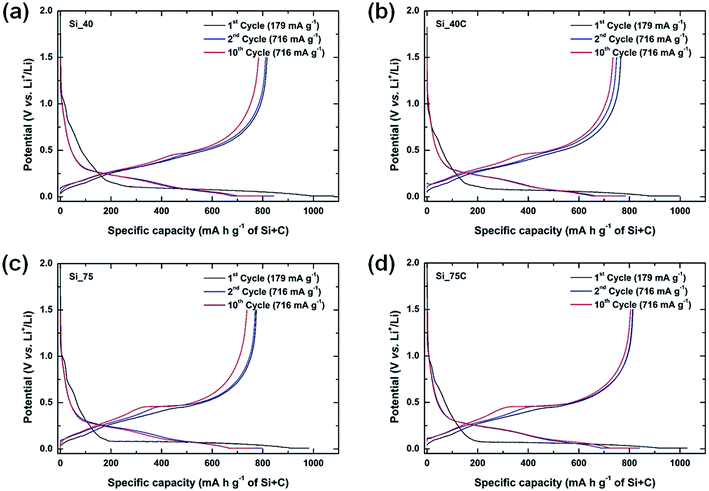
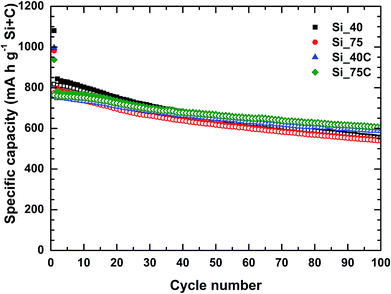
The four silicon nanoparticles were electrochemically tested by galvanostatic assays in half-cells in order to determine their performances versus Li+/Li. The charge/discharge profiles of 1st, 2nd and 10th cycles for the four Si-NPs are presented in Fig. 1, and the corresponding derivative curves in ESI (Fig. S5†). Coated and uncoated nanoparticles exhibit similar lithiation behavior. All samples exhibit a potential step at around 0.75 V vs. Li+/Li (Fig. 1) during the first discharge (black lines) which is associated with the starting of formation of the SEI layer.27 It is followed by a potential plateau at 0.1 V vs. Li+/Li corresponding successively to two-phase electrochemical reactions of the crystalline silicon nanoparticles into amorphous a-LixSi phases, and of a-LixSi phases into Li15Si4. The irreversible transformation of crystalline silicon into amorphous lithiated silicon during the first lithiation has been reported in literature,3–5 as well as the possible formation of the crystalline phase Li15Si4 at the end of discharge. Besides, the presence or absence of carbon coating does not have significant influence during the delithiation process, whereas particle size does. One may observe the presence of very broad derivative peaks for the first charge for all samples which correspond to the delithiation of a-LixSi phases into amorphous silicon. Only the larger Si-NPs (75 nm) exhibit a small peak at 0.45 V vs. Li+/Li indicating the presence of a two-phase reaction which is characteristic of crystalline Li15Si4 delithiation.3–5,8 This shape profile in charge, characteristic of the formation of Li15Si4 in discharge, has already been observed in silicon-based electrodes with a pitch-based carbon matrix.27,31,33 The following cycles evidence the lithiation of amorphous silicon with the presence of the two broad derivative peaks during the discharge steps. The huge peak at 0.45 V vs. Li+/Li during the charge is better defined after ten cycles (Fig. S5†), especially for larger Si particles.The cycling performances of carbon-coated and uncoated silicon nanoparticles at a current density of 716 mA g−1 (179 mA g−1 for the 1st cycle) are presented in Fig. 2, while their coulombic efficiencies are shown in Fig. S6.† Moreover, a summary of the reversible specific capacities in charge determined at different cycles is presented in Table 2. For both samples, i.e. Si_40 and Si_75, the first reversible delithiation capacity is improved by the carbon coating on the silicon nanoparticles, from 75.64% for uncoated to 76.82% for coated Si_40, and from 78.90% to 81.44% for Si_75. The theoretical capacity of the active material of these electrodes was calculated as 923 mA h g−1 and the initial reversible capacities obtained for the Si-NPs are above 80% of this value, e.g. 817 mA h g−1 (89%) and 766 mA h g−1 (83%) corresponding to Si_40 and Si_40C respectively, and 775 mA h g−1 (84%) and 764 mA h g−1 (83%) corresponding to Si_75 and Si_75C respectively. Besides, the carbon coating influences the initial lithiation of Si-NPs. Indeed, electrodes prepared with uncoated nanoparticles exhibit slightly higher initial specific capacities. However, the electrodes prepared with carbon coated Si-NPs exhibit a better reversibility at first cycle with systematically a lower irreversible capacity. Furthermore, they show higher specific capacities than their uncoated counterparts after 50 (7.6% higher for Si_75C) and 100 cycles (12.2% higher for Si_75C), and these samples possess better reversible capacity retention (e.g. maintain of 80% instead of 70% of the second charge capacity after 100 cycles for Si_75C compared to Si_75).
| Sample | Specific capacity 1st discharge (mA h g−1) | Specific capacity 1st charge (mA h g−1) | Coulombic efficiency 1st cycle (%) | Coulombic efficiency 2nd cycle (%) | Coulombic efficiency 100th cycle (%) | 2nd cycle/1st cycle (%) | 50th cycle/2nd cycle (%) | 100th cycle/2nd cycle (%) |
|---|---|---|---|---|---|---|---|---|
| Si_40 | 1081 | 817 | 75.64 | 96.21 | 99.34 | 99.3 | 79.9 | 68.2 |
| Si_40C | 997 | 766 | 76.82 | 95.48 | 99.27 | 97.8 | 86.4 | 78.3 |
| Si_75 | 982 | 775 | 78.90 | 96.61 | 99.45 | 99.4 | 80.1 | 70.0 |
| Si_75C | 937 | 764 | 81.44 | 97.06 | 99.56 | 99.6 | 87.5 | 79.6 |
| Si_75C_118M | 1120 | 892 | 79.63 | 95.47 | 99.50 | 99.6 | 84.8 | 75.4 |
| Si_75C_250M | 914 | 699 | 76.50 | 94.98 | 99.50 | 99.6 | 95.7 | 91.0 |
If a slightly higher capacity is measured for uncoated samples for the first cycles (filled symbols in Fig. 2), the coulombic efficiency is a bit lowered (Fig. S6†). It is possible that the presence of the carbon layer limits the initial lithiation of Si-NPs, and also allows the formation of a more stable SEI beneficial for the long-term capacity retention. For instance, it takes less than 15 cycles to the bigger carbon coated nanoparticles (Si_75C) to surpass the specific capacities obtained by its counterpart (i.e. 732 mA h g−1 against 754 mA h g−1 for Si_75 and Si_75C respectively). Even if this phenomenon occurs later (around 50 cycles) for the smaller size, the carbon coating positive effect is also observed based on average fading rates (average capacity loss between 2nd and 100th cycles of 32% against 22% for Si_40 and Si_40C respectively, which are similar to those of Si_75 and Si_75C, 30% against 21% respectively). In both cases, after 50 cycles the capacity retention of carbon-coated nanoparticles (above 86.4% and around 87.5%) is higher than their uncoated ones (79.9% and around 80.1% respectively). After 100 cycles Si_75C presents the best specific capacity retention (79.6%) among the four types of Si-NPs studied, nevertheless both coated nanoparticles exhibit quite similar capacity retentions. The better performances of Si_75C may be explained as both coated nanoparticles possess the same coating thickness and Si_40C size is also smaller, thus the SEI formed per particle is more important in the latter, slightly decreasing the accessibility of lithium ions.
It is also noteworthy that all four Si-NPs exhibit coulombic efficiencies above 95% after the second cycle. In fact, the moderate initial coulombic efficiency (around 76% for Si_40 and Si_40C and 80% for Si_75 and Si_75C) is mainly due to the SEI formation and the irreversible lithiation during the first cycle. Besides, the initial efficiency is slightly higher (around 1% better) for the coated Si-NPs. In general terms, the four Si-NPs exhibit correct coulombic efficiency (above 98% at cycle 20) for silicon based electrodes, especially Si_75C that possess the highest one at the end of the cycling (>99.5% since 70th cycle). Accordingly, Si_75C was selected to form the pitch-based carbon/nano-silicon composites in order to ensure the best electrochemical performances.
3.2 Carbon/silicon composites
The silicon nanoparticles Si_75C, which exhibited the best electrochemical performances versus Li+/Li, has been selected to prepare the pitch-based carbon/silicon composite. It has been reported that the cycling stability of silicon-based anodes may be improved using pitch as a carbon source.34 The use of this raw material is interesting in terms of cost reduction as compared to graphite. Commonly, the graphitization process for artificial graphite production is highly energy consuming, since it requires temperatures above 2000 °C. Pitch-based carbon and silicon-pitch composites are obtained at more acceptable temperatures (below 1000 °C). Pitch-based carbon cost is also advantageous, only a few euros per kilogram, against around 8–10€ per kilogram for graphite. Furthermore, the use of pitch as carbon source avoids the use of natural graphite, which is a critical raw material.28,29,34Two pitches, with different softening point, have been used (ZL 118M and ZL 250M). X-ray diffractograms of the pitches (raw material and pyrolyzed) and of the carbon/silicon composites are presented in Fig. 3. X-ray patterns of the pitches evidence their amorphous composition even after pyrolysis, and no reflection associated with graphite can be observed. For the carbon/silicon composites Si_75C_118M and Si_75C_250M, all reflections correspond to crystalline silicon (JCPDS 00-027-1402) and, as for the pyrolyzed pitches, the carbon matrix is still amorphous. No significant shift on silicon reflections can be detected, and neither the presence of silicon oxide nor silicon carbide crystal phases.
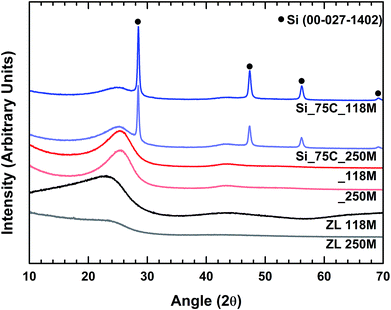 | ||
| Fig. 3 X-ray diffraction patterns of the pitches (ZL 118M and ZL 250M), the pyrolyzed pitches (_118M and _250M) and the pitch-based carbon/silicon composites (Si_75C_118M and Si_75C_250M). | ||
Typical SEM images of pitch 250M (raw and pyrolyzed) and its corresponding carbon/silicon composite are shown in Fig. 4. An analogue figure corresponding to pitch 118M is presented in ESI (Fig. S7†). Raw pitch is composed of pebbles of different sizes (a hundred of microns) with a quite flat surface. Pyrolyzed pitch is always composed by pebbles; however, different layers of carbon compose the surface. It is noteworthy to mention that pitch melts during pyrolysis and the morphology of samples, after this step, corresponds to the gradual solidification process during the cooling. A similar morphology is observed for the C/Si composites in which the Si-NPs are homogenously dispersed into the carbonaceous matrix as observed in Fig. 4c. Besides, there is no evidence of Si-NPs clusters, demonstrating a good dispersion of the nanoparticles in the solution prepared with THF and pitch.
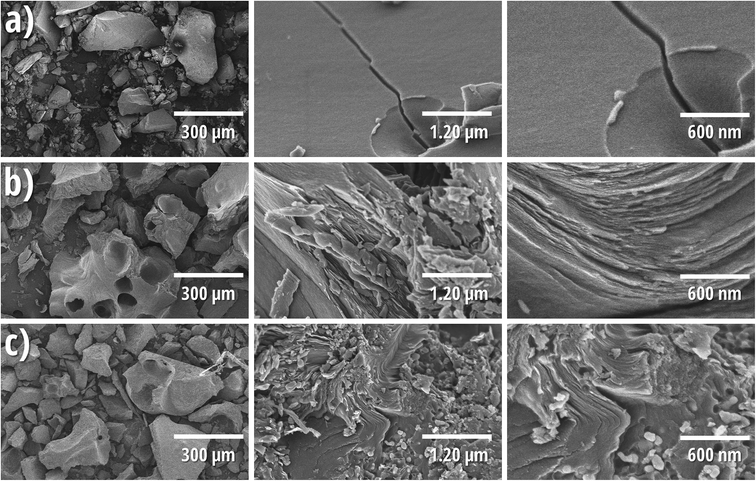 | ||
| Fig. 4 Scanning electron micrographs of ZL 250M (a), _250M (b) and Si_75C_250M (c) at different magnifications. | ||
Additionally, carbon, oxygen, and silicon EDX mapping of the Si_75C_250M based electrodes is displayed in Fig. 5 (see Fig. S8† for the mapping of Si_75C_118M based electrodes). The electrode composition is homogenous and the Si-NPs are well dispersed over all the film.
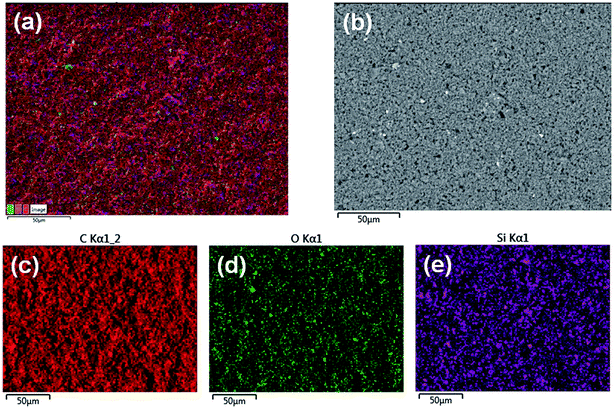 | ||
| Fig. 5 SEM-EDX mapping micrographs of the Si_75C_250M electrodes; superposed micrograph (a), secondary electron micrograph (b), carbon mapping (c), oxygen mapping (d) and silicon mapping (e). | ||
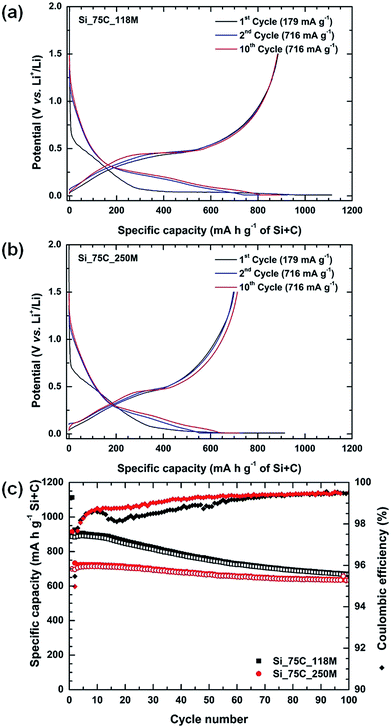
The two C/Si composites were electrochemically tested versus lithium. Their cycling performances and their charge/discharge profiles at different cycles are presented in Fig. 6 and the corresponding derivative curves in ESI (Fig. S9†). Both composite electrodes display similar galvanostatic profile for cycles 1, 2 and 10 (Fig. 6a and b). Over the first galvanostatic lithiation, the voltage drops from the open circuit value to approximately 0.7 V vs. Li+/Li, where a slope is observed until 0.06 V and a pseudo voltage plateau occurring until 0.01 V. The slope region between 0.7 and 0.06 V vs. Li+/Li may be associated with the formation of a SEI layer over both the carbon matrix and silicon particles. The pseudo-plateau might correspond to the transformation of crystalline silicon into amorphous silicon. It is important to keep in mind that both electrodes are composed of 10 wt% of silicon, amount that is below the one for the electrode formulation presented for the four Si-NPs (18 wt%). Clearly, the carbon matrix, composed of pyrolysed petroleum pitch, acetylene black, and carbon fibers, strongly influences the electrochemical lithiation of silicon particles. The subsequent discharging profiles (cycles 2 and 10) are typical of amorphous silicon and are similar to the profiles of the single Si-NPs (Fig. 1). Regarding the charging profiles, both samples present a sloping curve and a small plateau at 0.46 V vs. Li+/Li typical of delithiation of crystalline Li15Si4 (also visible as a peak in the derivative curve, Fig. S9†). At this stage, both composites from pitch ZL 118M and ZL 250M appear to behave in a comparable manner, even though Si_75C_118M shows a higher capacity during first cycles (Fig. 6).
It is noteworthy that there is still room for improvement by playing on the steps in the electrode formulation. Several parameters of the electrode formulation have been checked as the milling time of active material to try to still improve the performance. As an example when the same composites Si_75C_118M and Si_75C_250M were submitted to a longer dry ball-milling with other carbons (acetylene black, carbon fibers) prior to electrode formulation, differences begin to be noticeable for the first galvanostatic lithiation curve, and the specific capacities are quite similar, and corresponding to the expected values if one considers 10 wt% of silicon (Fig. S10 and S11†). The time duration of ball-milling for electrode formulation might be a parameter to investigate into details.
Regarding the cycling performances of composites (Fig. 6c), the Si_75C_118M composite exhibits the highest initial discharge capacity (1120 mA h g−1), higher than that of single nanoparticles (937 mA h g−1) and the theoretical expected capacity (610 mA h g−1), and the highest coulombic efficiency on the first cycle (79.63%, Table 1). However, cycling behavior of Si_75C_250M is better compared to Si_75C_118M as its specific capacity loss over a hundred of cycles is lower (9% loss for Si_75C_250M, 24.6% for Si_75C_118M). Noteworthy, it takes only 3 cycles to overcome the 95% threshold of coulombic efficiency and they also tend to 99.50% at the end of the cycling. Interestingly, both pyrolyzed pitches (_118M and _250M, Fig. S12†) exhibit initial coulombic efficiencies of 75% that are close to the one obtained for the carbon/silicon composites. The better performance of Si_75C_118M composite on first cycles can likely be attributed to a different SEI formation on the surface of pitch 118M or 250M (see below, the different softening point) which would be interesting to study.
In comparison to literature, the initial reversible capacity of composites, notably Si_75C_250M, is quite good, as it is commonly observed carbon/silicon composites with initial coulombic efficiencies lower than 70%.28,29,34
Indeed, the carbon matrix formed by the pyrolyzed pitch has an enormous impact on the electrode formulation. The presence of pitch improves the cycling stability and reversibility of the lithiation–delithiation process during galvanostatic measurements. Pitch-based carbon matrix allows improving the capacity retention and both composites. Both samples retain at least 75% of these capacities at the end of the 100th cycle (Table 1), and Si_75C_250M exhibit an improved electrochemical behavior than its 118M pitch counterpart. Furthermore, this capacity retention is superior to other pitch-based carbon/silicon composites founded in literature. For instance Yang et al.27 recently reported a capacity retention of 77% after 100 cycles for a silicon-graphite-pitch composite cycled at 100 mA g−1.
It is important to mention that the electrochemical performance of the two pitch-based carbons was also analyzed under the same conditions (see Fig. S12 in ESI†). The electrochemical behavior of both pitches is quite similar. They exhibit a specific capacity around 240 mA h g−1, which corresponds approximately to two-thirds of the theoretical capacity of graphite. Furthermore, their coulombic efficiency is superior to 98.0% after 3 cycles and it tends to 99.9% at the end of the cycling. Both pitches exhibit practically the same behavior against lithiation. Therefore, the different performances observed in the C/Si composites may be attributed to the dispersion of silicon nanoparticles into the carbon matrix. This phenomenon may be linked to the different softening points of both pitches combined to the better thermal stability of pitch 250M at higher temperatures, as evidenced by Apicella et al.23 whom exhibited the presence of two regions of volatilization around 300 °C and 700 °C in pitch 118M. The second region of volatilization may affect the homogeneity of the Silicon dispersion in the matrix.
Interestingly, the capacities obtained for the two composites are higher than capacities reported by others26 for their pitch-based carbon/silicon composite electrodes cycled at a current density of 75 mA g−1. As a reminder, the current densities used in our electrochemical tests were selected taking into account the theoretical capacity of the Li15Si4 phase, which means that the current density applied was of 716 mA g−1, thus ten times faster than the current used in26 which evidences high performances of our carbon/silicon composites.
4. Conclusions
In conclusion, we propose a simple way to obtain carbon/silicon composites, using a low cost raw material as carbon source: petroleum pitch. Composites were successfully obtained after pyrolysis of silicon nanoparticles and pitch. SEM microscopy confirms the homogeneous dispersion of the silicon nanoparticles into the carbonaceous matrix. The obtained carbon remains amorphous and there is no evidence of the formation of secondary phases after the pyrolysis step. Both carbon coating and pitch-based carbon matrix allow enhancing the electrochemical performances of laser pyrolysis silicon nanoparticles. Composites exhibit limited irreversible capacity loss in first cycle, compared to the state of the art of Si–carbon composites, good cycling stability and capacity retention even for fast current density applied. Given that these composites exhibit high electrochemical performance, it would be interesting to determine the maximum amount of silicon tolerated in the electrode in order to improve the specific capacity with such good capacity retention. We have to keep in mind that the capacity in Li-ion full cells is limited by the one of the positive electrode, and 1000–1200 mA h g−1 for the negative electrode appears to be a threshold after which improvement become negligible.35Conflicts of interest
There are no conflicts to declare.Acknowledgements
This work was supported by Nanomakers.References
- Lithium Ion Rechargeable Batteries, ed. K. Ozawa, Wiley-VCH Verlag GmbH & Co. KGaA, 2009 Search PubMed
.
- S. Goriparti, E. Miele, F. De Angelis, E. Di Fabrizio, R. Proietti Zaccaria and C. Capiglia, J. Power Sources, 2014, 257, 421–443 CrossRef CAS
.
- M. N. Obrovac and L. J. Krause, J. Electrochem. Soc., 2007, 154, A103–A108 CrossRef CAS
.
- J. Li and J. R. Dahn, J. Electrochem. Soc., 2007, 154, A156–A161 CrossRef CAS
.
- M. N. Obrovac and L. Christensen, Electrochem. Solid-State Lett., 2004, 7, A93 CrossRef CAS
.
- X. Zuo, J. Zhu, P. Müller-Buschbaum and Y. J. Cheng, Nano Energy, 2017, 31, 113–143 CrossRef CAS
.
- C. K. Chan, H. Peng, G. Liu, K. McIlwrath, X. F. Zhang, R. A. Huggins and Y. Cui, Nat. Nanotechnol., 2008, 3, 31–35 CrossRef CAS PubMed
.
- M. Ashuri, Q. He and L. L. Shaw, Nanoscale, 2016, 8, 74–103 RSC
.
- D. Mazouzi, Z. Karkar, C. R. Hernandez, P. J. Manero, D. Guyomard, L. Roué and B. Lestriez, J. Power Sources, 2015, 280, 533–549 CrossRef CAS
.
- X. H. Liu, L. Zhong, S. Huang, S. X. Mao, T. Zhu and J. Y. Huang, ACS Nano, 2012, 6, 1522–1531 CrossRef CAS PubMed
.
- J. Graetz, C. C. Ahn, R. Yazami and B. Fultz, Electrochem. Solid-State Lett., 2003, 6, A194 CrossRef CAS
.
- A. Casimir, H. Zhang, O. Ogoke, J. C. Amine, J. Lu and G. Wu, Nano Energy, 2016, 27, 359–376 CrossRef CAS
.
- D. Wang, M. Gao, H. Pan, J. Wang and Y. Liu, J. Power Sources, 2014, 256, 190–199 CrossRef CAS
.
- H. Kim, M. Seo, M. H. Park and J. Cho, Angew. Chem., Int. Ed., 2010, 49, 2146–2149 CrossRef CAS PubMed
.
- N. Delpuech, D. Mazouzi, N. Dupré, P. Moreau, M. Cerbelaud, J. S. Bridel, J. C. Badot, E. De Vito, D. Guyomard, B. Lestriez and B. Humbert, J. Phys. Chem. C, 2014, 118, 17318–17331 CrossRef CAS
.
- N. Choi, S. Ha, Y. Lee, J. Y. Jang, M. Jeong, W. C. Shin and M. Ue, J. Electrochem. Sci. Technol., 2015, 6, 35–49 CrossRef CAS
.
- N. Ding, J. Xu, Y. Yao, G. Wegner, I. Lieberwirth and C. Chen, J. Power Sources, 2009, 192, 644–651 CrossRef CAS
.
- U. Farooq, J. H. Choi, S. Atif Pervez, A. Yaqub, D. H. Kim, Y. J. Lee, M. Saleem and C. H. Doh, Mater. Lett., 2014, 136, 254–257 CrossRef CAS
.
- H. Huang, Int. J. Electrochem. Sci., 2016, 11, 8697–8708 CrossRef CAS
.
- Z. Karkar, D. Guyomard, L. Roué and B. Lestriez, Electrochim. Acta, 2017, 258, 453–466 CrossRef CAS
.
- B. Lestriez, S. Bahri, I. Sandu, L. Roué and D. Guyomard, Electrochem. Commun., 2007, 9, 2801–2806 CrossRef CAS
.
- E. Fitzer, K.-H. Kochling, H. P. Boehm and H. Marsh, Pure Appl. Chem., 1995, 67, 473–506 Search PubMed
.
- B. Apicella, A. Tregrossi, F. Stanzione, A. Ciajolo and C. Russo, Chem. Eng. Trans., 2017, 57, 775–780 Search PubMed
.
- J. W. Newman, ACS Symp. Ser., 1976, 21, 52–62 CrossRef CAS
.
- Y. X. Wang, S. L. Chou, J. H. Kim, H. K. Liu and S. X. Dou, Electrochim. Acta, 2013, 93, 213–221 CrossRef CAS
.
- E. H. Lee, B. O. Jeong, S. H. Jeong, T. J. Kim, Y. S. Kim and Y. Jung, Bull. Korean Chem. Soc., 2013, 34, 1435–1440 CrossRef CAS
.
- Y. Yang, Z. Wang, G. Yan, H. Guo, J. Wang, X. Li, Y. Zhou and R. Zhou, Ceram. Int., 2017, 43, 8590–8595 CrossRef CAS
.
- Y. Yong and L. Z. Fan, Ionics, 2013, 19, 1545–1549 CrossRef CAS
.
- F. L. Tang, J. F. Lei, Z. Y. Cui, J. Ouyang, G. Liu and L. Z. Zhao, Trans. Nonferrous Met. Soc. China, 2015, 25, 4046–4053 CrossRef CAS
.
- J. H. Lee, W. J. Kim, J. Y. Kim, S. H. Lim and S. M. Lee, J. Power Sources, 2008, 176, 353–358 CrossRef CAS
.
- L. Shao, J. Shu, K. Wu, X. Lin, P. Li, M. Shui, D. Wang, N. Long and Y. Ren, J. Electroanal. Chem., 2014, 727, 8–12 CrossRef CAS
.
- N. Herlin-Boime, M. Mayne-L'Hermite and C. Reynaud, in Encycl. Nanosci. Nanotechnol., American Scientific Publishers, 2004, vol. 10, pp. 301–326 Search PubMed
.
- Y. S. Hu, P. Adelhelm, B. M. Smarsly and J. Maier, ChemSusChem, 2010, 3, 231–235 CrossRef CAS PubMed
.
- S. Y. Noh, Y. Kim, C. W. Lee and S. Yoon, J. Electrochem. Sci. Technol., 2011, 2, 116–123 CrossRef CAS
.
- U. Kasavajjula, C. Wang and A. J. Appleby, J. Power Sources, 2007, 163, 1003–1039 CrossRef CAS
.
Footnote |
| † Electronic supplementary information (ESI) available. See DOI: 10.1039/c9ra00437h |
| This journal is © The Royal Society of Chemistry 2019 |

