DOI:
10.1039/C9RA00393B
(Paper)
RSC Adv., 2019,
9, 16136-16146
Identification of key transporters mediating uptake of aconitum alkaloids into the liver and kidneys and the potential mechanism of detoxification by active ingredients of liquorice
Received
16th January 2019
, Accepted 8th May 2019
First published on 23rd May 2019
Abstract
Aconite as a commonly used herb has been extensively applied in the treatment of rheumatoid arthritis, as pain relief, as well as for its cardiotonic actions. Aconitum alkaloids have been shown to be the most potent ingredients in aconite, in terms of efficacy against disease, but they are also highly toxic. Apart from neurological and cardiovascular toxicity exposed, the damage to hepatocytes and nephrocytes with long-term use of aconitum alkaloids should also be carefully considered. This study attempted to investigate the critical role of uptake transporters mediating the transport of aconitum alkaloids into the liver and the kidneys. The resulting data revealed that hOATP1B1, 1B3, hOCT1 and hOAT3 were mainly involved in the uptake of aconitum alkaloids. Additionally, the inhibitory effects of bioactive ingredients of liquorice on uptake transporters were screened and further confirmed by determining the IC50 values. The in vitro study suggested that liquorice might lower the toxicity of aconite by reducing its exposure in the liver and/or kidneys through inhibition of uptake transporters. Eventually, the in vivo study was indicative of detoxification of liquorice by decreasing the exposure of aconitine as representative compound in liver after co-administration, even though the exposure in kidney altered was less significant. In summary, hOATP1B1, 1B3, hOCT1 and hOCT3 were determined as the key uptake transporters mediating the transport process of aconitum alkaloids into the liver and/or kidneys, and liquorice may alleviate the toxicity caused by reduction of exposure through inhibition of those key uptake transporters.
1. Introduction
Aconite, as one of the most important herbs, has been intensively used in the treatment of rheumatoid arthritis, inflammation, pain and other conditions.1–3 The main root of Aconitum carmichaelii “Chuanwu”, the root of A. kusnezoffii “Caowu” and the lateral root of Aconitum carmichaelii “Fuzi” are, in general, the processed herb products that are used in practice. The roots of aconite are only applied after appropriate processing, due to the severe toxicity of exposure. The overall alkaloid content, the main cause of toxicity, is significantly reduced to roughly 10% on processing.4 Serious adverse reactions to aconite have been widely recognized, however, and aconite poisoning quite often occurs due to long-term use and ease of access.4,5
Toxicity studies of aconite have extensively demonstrated that diester diterpenoid alkaloids (DDAs), such as aconitine and other alkaloids, lead to cardiotoxicity and neurotoxicity.6–10 For example, the membrane integrity of interstitial cells of Cajal (ICC) cells can be damaged by exposure to aconitine, resulting in efflux of ions as well as inactivation of the sodium–potassium pump.10 This imbalance can lead to interference of cellular breathing, leading to disorder in the regular intracellular energy metabolism due to the enhanced level of anaerobic metabolism. In addition, aconitine and mesaconitine are found bound to sodium channels that are voltage sensitive and continually exhibit an activation effect. Tachyarrhythmia is observed with these compounds of high affinity, with the influx of sodium and persistent depolarization.11
Previous studies have already demonstrated that aconitum alkaloids are mainly catalyzed in the liver;12 for instance, CYP3A of cytochrome P450 is involved in the metabolism of aconitine. Meanwhile, renal excretion has been confirmed to be the predominant pathway for elimination of aconitine.13,14 Exposure in these two organs, therefore, cannot be overlooked. Efforts have already been made to clarify the impact of aconite on both organs.15,16 After an Aconitum carmichaelii root (Wutou) decoction was given to mice for 14 days, the levels of serum biochemical indicators (for instance, alanine transaminase (ALT), aspartate transaminase (AST) and lactate dehydrogenase (LDH)) increased, as well as the organ index, revealing the toxicity caused. In addition, the changes to the liver and kidneys were significant, as confirmed by histopathological examination. Metabolomic analysis further supported the toxicity of aconitum alkaloids in the kidneys through perturbation of renal tubular function, in particular with a larger weight of aconitine than that of mesaconitine and hypaconitine.17
Owing to the toxicity of aconite alkaloids to the liver and kidneys, exposure in these organs is expected. The transport mechanism for these compounds in the liver and kidneys should, therefore, be properly explained. Organic anion-transporting polypeptides (OATPs), organic anion transporters (OATs) and organic cation transporters (OCTs), which are highly expressed on the basolateral membrane of hepatocytes and renal tubular endothelial cells, play a vital role in mediating the transport of xenobiotics across the membrane and uptake into organs. Preliminary studies have shown that aconitine is able to inhibit the uptake of tetraethylammonium (TEA), which is the probe substrate of OCT2, with a half maximal inhibitory concentration (IC50) value at 60 μM, and it exhibited competitive inhibition, with a Ki value at 145 μM.18 Aconitine was also screened for its association with OAT1.19
In this study, key transporters mediating the uptake of aconitum alkaloids were screened and identified by utilizing transporter-transfected cell models. In addition, inhibition of those uptake transporters by active ingredients in liquorice has been investigated. IC50 values for specific active compounds were also determined. The effects of liquorice on uptake of aconitine into the liver and kidneys were investigated. The resulting data suggest that the uptake transporters are involved in the exposure to aconitine either in the liver or kidneys, and that liquorice may exhibit detoxification effects by inhibiting the function of those transporters.
2. Materials and methods
2.1 Chemicals and reagents
Diester diterpenoid alkaloids (DDAs) and monoester diterpenoid alkaloids (MDAs), including aconitine (AC), mesaconitine (MA), hypaconitine (HA), benzoylaconitine (BAC), benzoylmesaconitine (BMA), and benzoylhypaconitine (BHA), liquiritin, liquiritigenin, licochalcone A, isoliquiritin, isoliquiritigenin and glycyrrhetinic acid were purchased from Vientiane Hengyuan Tech Co., Ltd (China), while glycyrrhizic acid was obtained from Solarbio Science & Technology Co., Ltd (China). Rifampin and quinidine were obtained from MedChem Express Co., Ltd (China). The purity of the testing chemicals was authenticated by HPLC. HPLC grade acetonitrile and formic acid for liquid chromatography were purchased from Fisher Scientific (USA). Fetal bovine serum (FBS) was purchased from Lanzhou Minhai Bio-Engineering Co., Ltd (Lanzhou, China). Dulbecco's modified Eagle's medium (DMEM) with 4.5 g L−1 glucose and GlutaMAX™ were from Hyclone. Phosphate-buffered saline solution (PBS) and antibiotic (10![[thin space (1/6-em)]](https://www.rsc.org/images/entities/char_2009.gif) 000 U mL−1 penicillin, 10000 μg mL−1 streptomycin) were from Solarbio Science & Technology Co., Ltd (Beijing, China). The 3H-estrone sulfate (3H-ES), 3H-estradiol glucuronide (3H-EG), 14C-tetraethylammonium (14C-TEA) and 14C-para-aminohippuric acid (14C-PAH) were all obtained from American Radiolabeled Chemicals Incorporation (St. Louis, USA).
000 U mL−1 penicillin, 10000 μg mL−1 streptomycin) were from Solarbio Science & Technology Co., Ltd (Beijing, China). The 3H-estrone sulfate (3H-ES), 3H-estradiol glucuronide (3H-EG), 14C-tetraethylammonium (14C-TEA) and 14C-para-aminohippuric acid (14C-PAH) were all obtained from American Radiolabeled Chemicals Incorporation (St. Louis, USA).
2.2 Animals
Adult male Sprague-Dawley (SD) rats (weight, 180–220 g) were purchased from Beijing Vital River Laboratory Animal Technology Co., Ltd (Certificate no.: SCXK (Jing) 2016-0006, Beijing, China) for tissue distribution study. All animals were housed at the animal facility in Tianjin Institute of Pharmaceutical Research, New Drug Assessment Co. Ltd, and allowed free access to food and water. All animal treatments were approved by the Institutional Animal Ethical Committee of Tianjin Institute of Pharmaceutical Research (Certificate no.: SYXK (Jin) 2016-0009, Tianjin, China).
2.3 Cell culture
The culture medium for S2, MDCK and HEK293 cell lines, either mock or transfected, was DMEM supplemented with 10% FBS and 1% antibiotic (10000 U mL−1 penicillin, 10000 μg mL−1 streptomycin). The cell lines stored in liquid nitrogen were rapidly thawed and revived in culture dishes with a diameter of 10 cm. After continuous passage for 2–3 generations in a humidified incubator at 33 °C or 37 °C, and under 5% CO2, depending on the cell types, the adherent cells were lysed with 0.25% trypsin to a single-cell suspension and seeded in 24-well culture plates at 1.5–2 × 10⁵ cells per well.
2.4 LC-MS analysis
The concentrations of aconitum alkaloids were determined by utilizing a Waters Xevo TQD-Acquity UPLC H-Class Bio system equipped with an ESI source (Thermo Finnigan, San Jose, CA, USA). The chromatographic analysis was performed on an Acquity UPLC BEH C18 column (1.7 μm, 2.1 × 50 mm2) at room temperature. The mobile phase was water containing 0.05% formic acid (phase A) and 100% acetonitrile (phase B) with a gradient elution program at a flow rate of 0.3 mL min−1, 0–1 min, 15% phase B; 1–2.5 min, 30% phase B; 2.5–4 min, 45% B; 4–4.1 min, 90% phase B; 4.1–6 min, 15% phase B. The injection volume was 10 μL and the auto-sampler temperature was maintained at 15 °C.
The mass scan mode was the positive MRM mode. For instance, the precursor ion and product ion were m/z 646 → 586 for aconitine and m/z 330 → 181 for sinomenine as internal standard, respectively. The collision energy for aconitine and internal standard were 34 eV and 30 eV, respectively. The MS/MS conditions were optimized as follows: spray voltage, 3.5 kV; ion source temperature, 150 °C; sheath gas pressure, 50 L h−1; auxiliary gas flow, 50 L min−1; capillary temperature, 400 °C.
3. Experimental study
3.1 Uptake of aconitum alkaloids in transfected cell lines
Seven key uptake transporters were screened for their transport activities for aconitum alkaloids by utilizing the transfected cell lines. The S2, MDCK and HEK293 cells stably overexpressing specific transporters, as well as mock cells, were seeded in a 24-well culture plate at a density of 2 × 10⁵ cells per well. After the cells were cultured for 48 hours, cells were rinsed with 1 mL of DPBS (containing 137 mM NaCl, 3 mM KCl, 8 mM NaHPO4, 1 mM KH2PO4, 1 mM CaCl2, and 0.5 mM MgCl2, pH 7.4) and 1 mL of DPBS was added and the plate incubated in a water bath at 37 °C for 10 min. The cells were then incubated in a solution containing aconitum alkaloids at 10 μm, at 37 °C for 2 min for human OATPs (hOATPs) and hOATs, and 5 min for hOCTs. Uptake was terminated by aspirating solutions and rinsing with ice-cold DPBS solution three times. Cells were then lysed with 0.5 mL of methanol, the solutions were rapidly centrifuged, and the supernatants were taken and stored at −80 °C prior to analysis. Protein concentrations for each cell line were determined by using the BCA assay kit.
3.2 Inhibition of uptake transporters by active ingredients in liquorice
To evaluate the inhibitory effects of active ingredients of liquorice on the function of uptake transporters, bioactive compounds, including liquiritin, liquiritigenin, licochalcone A, isoliquiritin, isoliquiritigenin and glycyrrhetinic acid, were dissolved in dimethyl sulfoxide (DMSO) at a concentration of 20 mmol L−1 as stock and diluted with PBS to final concentrations of 100 μmol L−1. The final concentration of dimethyl sulfoxide in the working solutions was adjusted to be less than 0.2%. The transfected cell lines and mock were cultured in an identical way to that previously described. The cells were incubated in working solutions containing either 5 μmol L−1 14C-PAH for 2 min (hOAT1), 200 nmol L−1 3H-ES for 2 min (hOAT3, hOATP1B1, hOATP1B3 and hOATP2B1), or 5 μmol L−1 14C-TEA (hOCT1, hOCT2 and hOCT3) for 5 min in the presence of bioactive compounds of liquorice at 37 °C. Potent inhibitors, for instance, rifampin, probenecid and quinidine, were selected as positive controls, respectively. After incubation, the reaction was terminated by adding cold DPBS and rinsed three times. The cells were then lysed with 0.5 mL sodium hydroxide solution (0.1 mol L−1) and the cell residues were collected and mixed with 2.5 mL of ULTIMA Gold. Once mixing was completed, the total radioactivities (dpm) of each portion of the mixtures were determined using a Tri-Carb 2910 Liquid Scintillation Counter (PerkinElmer, USA). The inhibition rates were then calculated accordingly.
3.3 Determination of IC50 values of active ingredients in liquorice for uptake transporters
After screening of the inhibitory effects was completed, the potency of the inhibition of uptake transporters was investigated for those bioactive compounds exhibiting strong inhibition effects. Again, either transfected cell lines or mock were cultured as previously described. Liquiritin, liquiritigenin, licochalcone A, isoliquiritigenin and glycyrrhetinic acid were dissolved in dimethyl sulfoxide (DMSO) at a concentration of 20 mmol L−1 as stock and diluted with PBS to prepare a series of working solutions at 1, 3, 10, 30 and 100 μmol L−1, respectively. The cells were then incubated with working solutions containing either 5 μmol L−1 14C-PAH for 2 min (hOAT1), 200 nmol L−1 3H-ES for 2 min (hOAT3, hOATP1B1, hOATP1B3 and hOATP2B1), or 5 μmol L−1 14C-TEA (hOCT1, hOCT2 and hOCT3) for 5 min in the presence of bioactive compounds of liquorice at 37 °C. Similarly, the reaction was terminated by adding cold DPBS and rinsed three times. The cells were then lysed with 0.5 mL sodium hydroxide solution (0.1 mol L−1) and the cell residues were collected and mixed with 2.5 mL of ULTIMA Gold. Once the mixture was completed, the total radioactivities (dpm) of each portion of the mixtures were determined with a Tri-Carb 2910 Liquid Scintillation Counter (PerkinElmer, USA). The IC50 values for each individual compound on a specific uptake transporter were then calculated accordingly.
3.4 Effects of transporter inhibitors on uptake of aconitine in the liver and kidneys
Male SD rats (n = 120) were randomly divided into five groups (n = 24/group). Apart from the group aconitine on its own at 0.5 mg kg−1 by oral administration, other groups were given either rifampin, quinidine, glycyrrhetinic acid at 50 mg kg−1, or liquorice water extract at 0.86 g kg−1 (1.86 g kg−1 crude drug), respectively, 15 min before dosing with aconitine at 0.5 mg kg−1. Animals were then sacrificed at 0.5, 1, 1.5 and 2 h (n = 6 at each time point)following administration of aconitine. The livers and kidneys were sampled. Organ samples were homogenated in cold saline, the concentration of aconitine in either the liver or kidneys was then determined using the LC-MS method.
3.5 Data analysis
The concentrations of aconitine in tissues determined were analyzed in DAS 2.0. Areas under the curve (AUCs) were calculated using the trapezoid rule. All in vitro and in vivo data are presented as mean ± standard deviation (sd). The statistical significance of differences between mean values was calculated using Student's t-test. Values of P < 0.05 were considered to be statistically significant.
4. Results
4.1 Uptake of aconitum alkaloids in transfected cell lines
Uptake of aconitum alkaloids, including DDAs and MDAs, by HEK293, S2 and MDCK overexpressing key transporters has been investigated. The resulting data show that accumulation of aconitum alkaloids was enhanced in transfected cells compared with mock cells (see Fig. 1 and 2). For instance, concentrations of mesaconitine in hOATP1B1 and hOATP1B3 were approximately 2.7- and 3.4-fold that of HEK293 mock cells. Aconitine in hOATP1B3 was also enhanced to 344 pmol mg−1 protein, which was 1.35-fold higher than mock. MDAs such as benzoylaconitine were shown to be the substrate for the uptake transporter. The level in the transfected cells was much higher than in mock cells, ranging from 5.6- to 10.5-fold higher in HEK293–hOATP1B1 and 1B3. Additionally, hOCT1, hOCT3 and hOAT3 were also shown to be involved in transport of aconitum alkaloids. For instance, transport of all six aconitum alkaloids was mediated by hOCT1. The concentrations in HEK293–hOCT1 were roughly 1.9-fold (aconitine), 1.9-fold (mesaconitine), 3.3-fold (hypaconitine), 2.3-fold (benzoylaconitine), 3.7-fold (benzoylhypaconitine) and 2.2-fold (benzoylmesaconitine) higher than that of control, respectively. However, hOATP2B1 and hOAT1 were found to be less associated with transport of aconitum alkaloids (see Fig. 3).
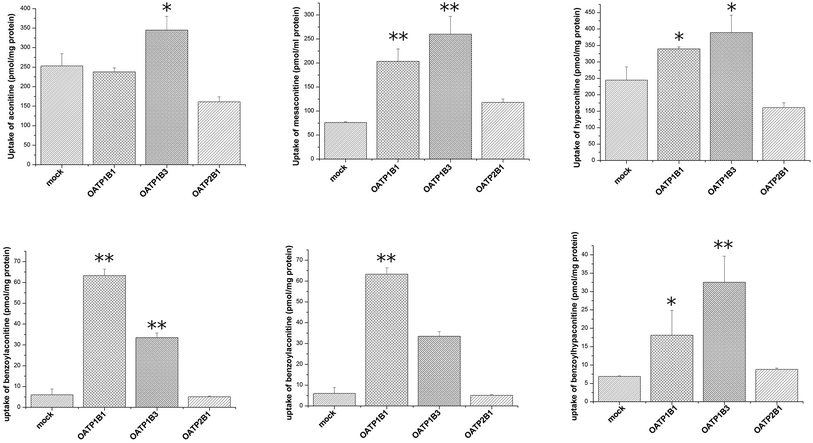 |
| | Fig. 1 Aconitum alkaloid uptake mediated by hOATP-transfected HEK293 cell lines. Transport activity is adjusted by protein concentration. Cells were incubated with testing chemicals at 10 μm for 2 min. P < 0.001 and P < 0.05 are presented as ** and* against mock cells (n = 3). Due to substrate specificity existing among hOATP2B1 and 1B1/1B3, the transport activity mediating specific compounds between the two subfamilies varied. | |
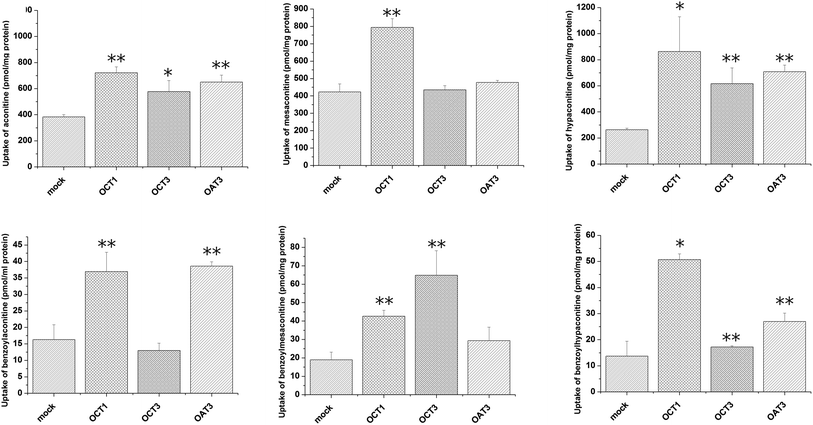 |
| | Fig. 2 Aconitum alkaloid uptake mediated by hOCT1-, hOCT3- and hOAT3-transfected S2 cell lines. Transport activity is adjusted by protein concentration. Cells were incubated with testing chemicals at 10 μm for 5 min for hOCT1 and hOCT 3, and for 2 min for hOAT3. P < 0.001 and P < 0.05 were presented as ** and* against mock cells (n = 3). hOCT1,3 and OAT3 exhibited transport function at varying levels. In particular, hOCT1 is shown to be involved in transport of all six alkaloids. | |
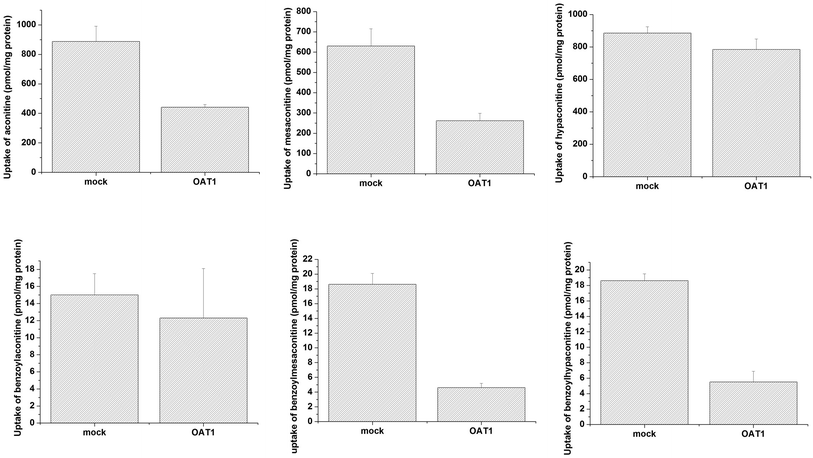 |
| | Fig. 3 Aconitum alkaloid uptake mediated by hOAT1-transfected MDCK cell lines. Transport activity is adjusted by protein concentration. Cells were incubated with testing chemicals at 10 μm for 2 min. Data are presented as mean ± sd (n = 3). The results suggest that hOAT1 is unlikely to be associated with the transport process for aconitum alkaloids. | |
4.2 Effects of active ingredients in liquorice on uptake transporters
The effects of active ingredients in liquorice on the function of uptake transporters was screened (see Fig. 4). The bioactive compounds exhibited inhibitory effects on uptake of probe substrates to various contents. For example, isoliquiritin, glycyrrhetinic acid and licochalcone A were potent inhibitors of hOCT2, with inhibitory rates of 71.9, 80.17, 91.76%, respectively, which are very close to the positive inhibitor quinidine, with 95.60%. Similarly, liquiritigenin, isoliquiritigenin, licochalcone A and glycyrrhetinic acid presented inhibition on hOAT3 with inhibitory rates of 27.9, 44.27, 30.1, 49.9%, respectively. Of all the compounds studied, the potency of liquiritigenin and licochalcone A, in terms of inhibition, were comparable with that of probenecid. For hOATPs, the results were also supportive of the active ingredient in liquorice being able to inhibit uptake of probe substrates mediated by the transporters. Glycyrrhetinic acid, licochalcone A and isoliquiritin were strong inhibitors on hOATP1B1, 1B3 and 2B1. In particular, glycyrrhetinic acid was able to inhibit hOATP1B1, 1B3 and 2B1 with inhibitory rates of 11.9, 23.0 and 25.6%, respectively.
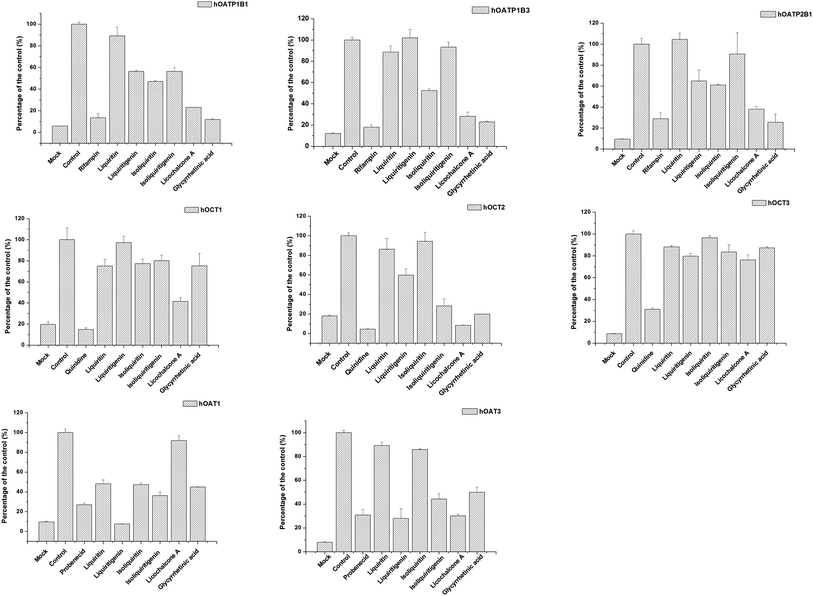 |
| | Fig. 4 Screening of the inhibitory effect on uptake transporters of the bioactive ingredient in liquorice at 100 μm. Data are presented as mean ± sd (n = 3). From left to right (upper row) inhibition on OATP1B1, 1B3 and 2B1; (middle row) OCT1, OCT2 and OCT3; and (bottom row) OAT1 and OAT3. Several bioactive compounds, for instance liquiritigenin, isoliquiritigenin, licochalcone A and glycyrrhetinic acid presented strong inhibitory effects on the uptake transporters. | |
4.3 Inhibition potency of specific active ingredients in liquorice on uptake transporters
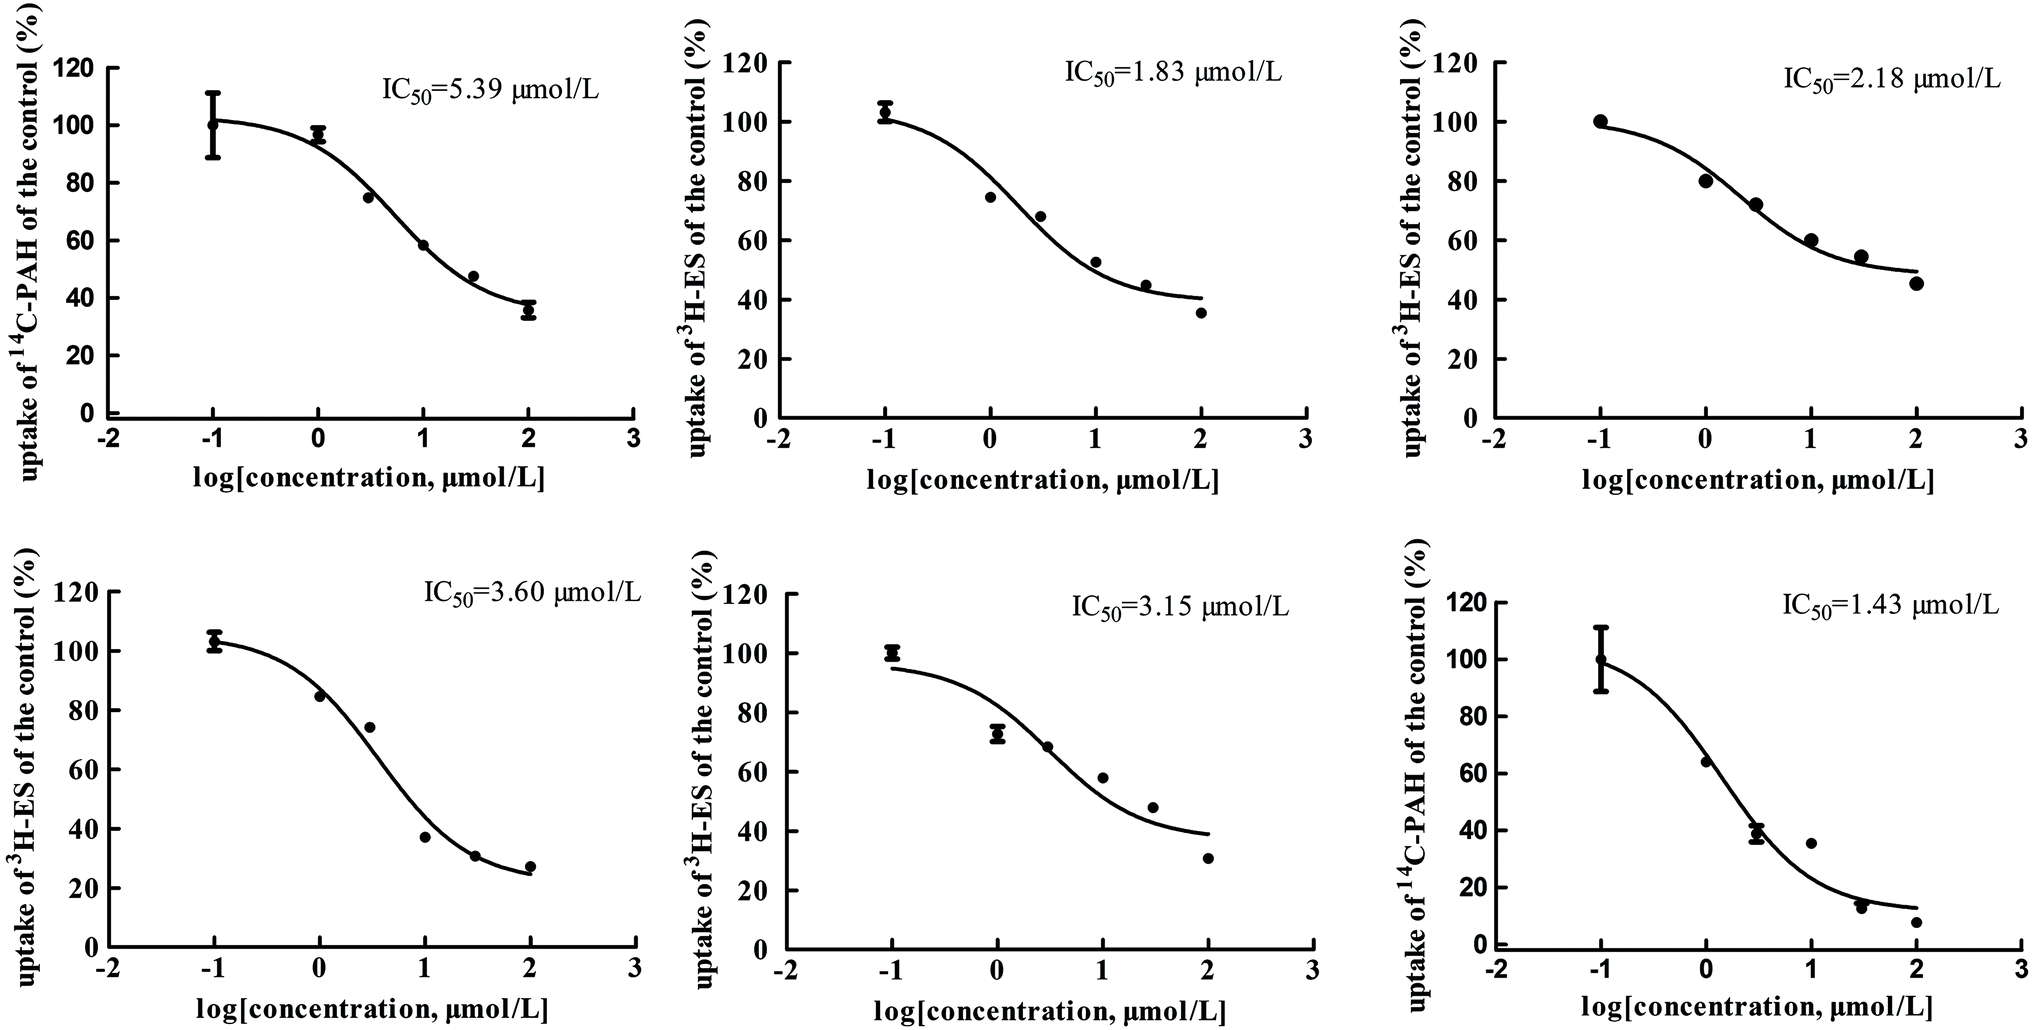
The main bioactive ingredients of liquorice were screened for their inhibitory effects on the activities of uptake transporters. The inhibition potency of each individual compound varied markedly. The IC50 values of the compounds with strong inhibition effects were further determined by using radiolabeled substrates as probe. The data shown demonstrate that inhibition by active ingredients in liquorice was potent (see Fig. 5–7). For instance, IC50 values for glycyrrhetinic acid on hOATP1B1, 1B3 and 2B1 were 1.97, 4.43 and 1.07 μmol L−1, respectively. While the IC50 values of licochalcone A on those transporters were 1.27, 1.91 and 1.09 μmol L−1, respectively. In addition, IC50 values of glycyrrhetinic acid, isoliquiritigenin and licochalcone A on hOCT2 were 7.41, 31.44 and 6.61 μmol L−1, licochalcone A also presented inhibition on hOCT1 with IC50 at 14.0 μmol L−1 hOATs as another important type of uptake transporter were also used to examine the inhibition potency. Glycyrrhetinic acid, isoliquiritigenin and licochalcone A were able to inhibit hOAT3 with IC50 values of 1.83, 2.18 and 3.60 μmol L−1, respectively. However, hOAT1 was less associated with the transport of aconitum alkaloids. The IC50 values of specific bioactive compounds were determined with strong inhibition effects.
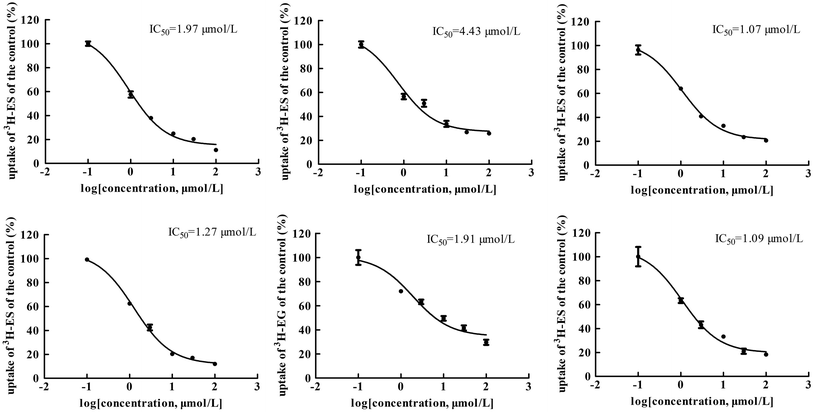 |
| | Fig. 5 IC50 values of specific bioactive ingredients in liquorice determined on hOATP uptake transporters. From left to right, (upper row) inhibition of glycyrrhetinic acid on hOATP1B1, 1B3 and 2B1 and (bottom row) licochalcone A on hOATP1B1, 1B3 and 2B1, respectively. The IC50 values of the bioactive compounds on hOATPs were approximately 2 μm, showing potent inhibition effects. | |
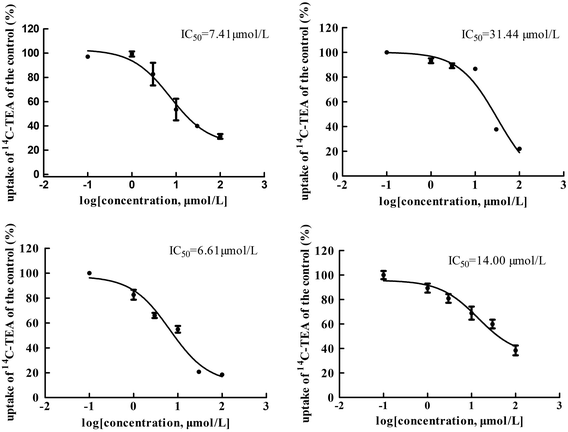 |
| | Fig. 6 IC50 values of specific bioactive ingredients in liquorice determined on hOCT uptake transporters. From left to right, (upper row) inhibition of glycyrrhetinic acid and isoliquiritigenin on hOCT2 and (bottom row) licochalcone A on hOCT2 and OCT1, respectively. As shown, inhibition of the bioactive compounds was comparable with that of positive inhibitors. | |
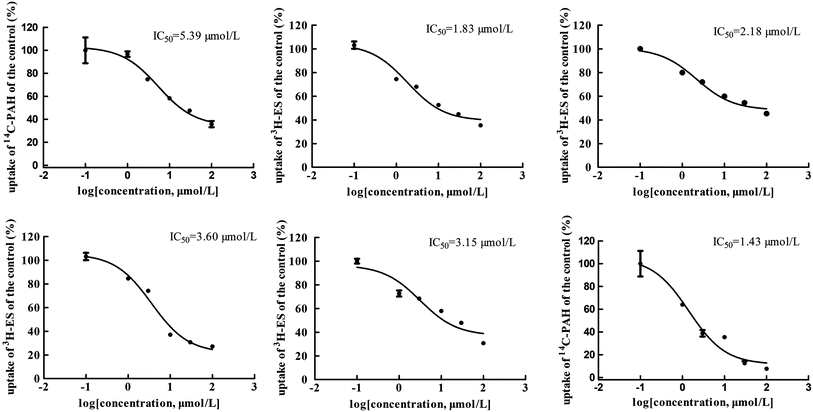 |
| | Fig. 7 IC50 values of specific bioactive ingredients in liquorice determined on hOAT uptake transporters. From left to right, (upper row) inhibition of glycyrrhetinic acid on OAT1/3, isoliquiritigenin on OAT3, and licochalcone A on OAT3 and (bottom row) liquiritigenin on OAT3 and liquiritin on hOAT1, respectively. | |
4.4 Exposure of aconitine in the liver and kidneys in combination with inhibitors
The aconitum alkaloids were demonstrated to be substrates for uptake transporters. Bioactive ingredients of liquorice were also able to exhibit inhibitory effects on those transporters, thus mediating the uptake of aconitum alkaloids. Aconitine, as a representative compound, was therefore selected to investigate the impact of liquorice on exposure in vivo by taking positive inhibitors as reference. The exposure of aconitine in the liver was markedly altered after administration to rats in combination with positive inhibitors and/or liquorice extract (see Fig. 8) with the concentrations of aconitine in the liver decreasing by varying amounts. In particular, rifampin was able to reduce the AUC of aconitine in the liver to 50% of that of control. Quinidine, as a positive inhibitor of hOCTs, also exhibited inhibition on uptake of aconitine into the liver, but the inhibitory effect was less potent, with the AUC and Cmax of aconitine declining by only 5.70 and 10.3%, respectively. Meanwhile, glycyrrhetinic acid also reduced the accumulation of aconitine in the liver by lowering the AUC and Cmax by roughly 20%. In addition, liquorice extract presented very similar effects to rifampin (see Table 1).
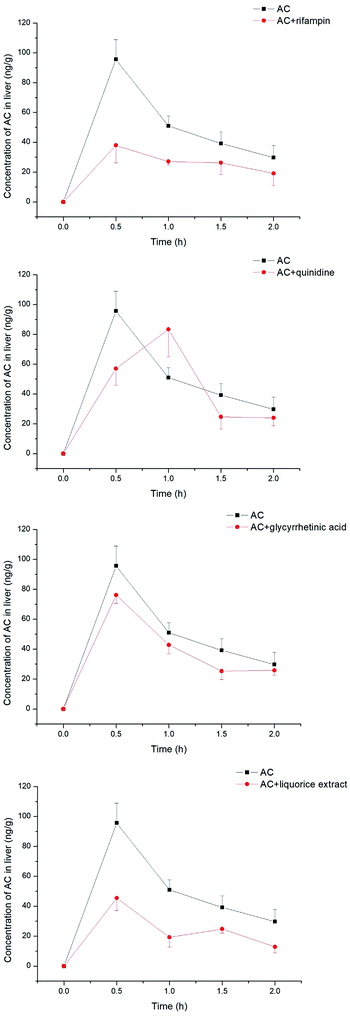 |
| | Fig. 8 Concentrations of aconitine determined in the liver at specific time points. SD rats were pretreated with uptake transporter inhibitors or liquorice water extract for 15 min, followed by oral administration of aconitine at 0.5 mg kg−1. Each data point is presented as mean ± sd (n = 6). Clearly, liquorice water extract lowered the exposure to aconitine following co-administration, while the effect of glycyrrhetinic acid was limited. | |
Table 1 Pharmacokinetic parameters of aconitine in rat liver pre-administrated with rifampin, quinidine, glycyrrhetinic acid and liquorice extract. Mean values and standard deviations are shown (n = 6)
| Parameters |
Units |
Chemicals |
| AC |
AC + rifampin |
AC + quinidine |
AC + glycyrrhetinic acid |
AC + liquorice extract |
| AUC(0–2 h) |
ng h−1 g−1 |
100.3 ± 8.9 |
50.4 ± 4.9 |
88.4 ± 11.2 |
78.5 ± 6.8 |
48.0 ± 7.3 |
| Cmax |
ng g−1 |
95.6 ± 13.2 |
37.9 ± 11.7 |
83.3 ± 18.4 |
76.1 ± 5.6 |
45.4 ± 8.4 |
The concentration of aconitine determined in the kidneys appeared to be less associated with transporter-mediated uptake (see Fig. 9), with the AUC of aconitine being unchanged after pretreatment with rifampin, quinidine, glycyrrhetinic acid and liquorice extract. In addition, the Cmax of aconitine was less affected, and was lowered to 84% of control only in combination with liquorice extract (see Table 2).
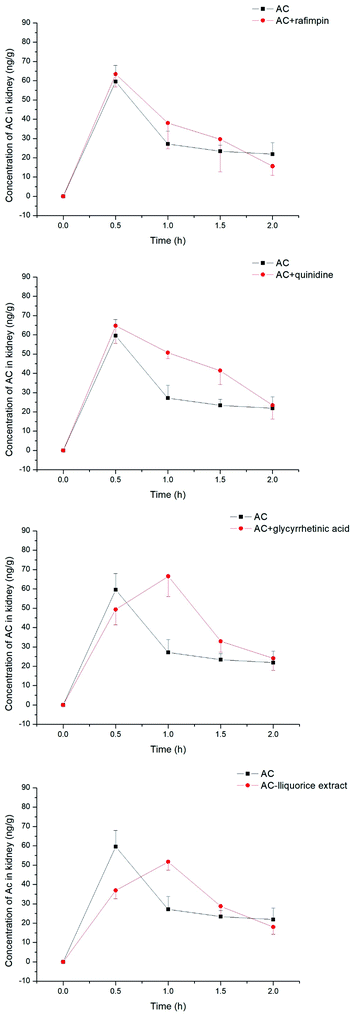 |
| | Fig. 9 Concentrations of aconitine determined in the kidneys at specific time points. SD rats were pretreated with uptake transporter inhibitors or liquorice water extract for 15 min, followed by oral administration of aconitine at 0.5 mg kg−1. Each data point is presented as mean ± sd (n = 6). | |
Table 2 Pharmacokinetic parameters of aconitine in rat kidneys pre-administrated with rifampin, quinidine, glycyrrhetinic acid and liquorice extract. Mean values and standard deviations are shown (n = 6)
| Parameters |
Units |
Chemicals |
| AC |
AC + rifampin |
AC + quinidine |
AC + glycyrrhetinic acid |
AC + liquorice extract |
| AUC(0–2 h) |
ng h−1 g−1 |
60.5 ± 6.8 |
69.4 ± 12.0 |
84.3 ± 4.4 |
80.4 ± 8.1 |
63.1 ± 4.3 |
| Cmax |
ng g−1 |
59.5 ± 8.5 |
63.4 ± 6.7 |
64.7 ± 9.1 |
66.5 ± 10.5 |
51.7 ± 4.3 |
5. Discussion
Aconitum alkaloids as the main bioactive compounds in aconite have been extensively investigated. Their pharmacological functions against disease, for instance, antinociceptive, anti-inflammatory, anti-arrhythmic and cardiotonic actions,20–23 have been illustrated. As far as we know, the toxicity of exposure is mainly related to neurological, cardiovascular and gastrointestinal systems,24–26 and sometimes embryotoxicity.27 The damage to hepatocytes and nephrocytes caused by aconitum alkaloids cannot, however, be ignored, particularly when it is combined with other herbs and/or chemical drugs.
Transporters as a superfamily of proteins, which act as barriers to xenobiotics crossing the cell membrane, are critical for the fate of chemicals in vivo, including the pharmacokinetic pattern, safety and efficacy.28 Of all the transporters, OATPs, OCTs and OATs are the main determinants in the uptake of specific compounds into cells. Since OATPs, such as OATP1B1 and 1B3, are primarily expressed in the liver, drug–drug interactions are anticipated to appear when inhibition of OATP-mediated hepatic uptake occurs; for instance, levels of statins in the liver may be greatly enhanced after administration of cyclosporine.29,30 Similarly, inhibition of OCTs and OATs may result in an increased AUC by reducing uptake of compounds into the kidneys.31
The toxicity of aconitum alkaloids in the liver and kidneys has been reported previously in the literature, as probably associated with uptake transporters mediating the transport process. An in vitro study using transfected cell lines overexpressing the individual transporter was performed for the first time to explore and identify the potential transporters involved. The results indicate that hOATP1B1 and 1B3 might be the key transporters mediating uptake of aconitum alkaloids into the liver, since the concentrations of the alkaloids increased in comparison with the control. Since substrate specificity exists between OATP2B1 and 1B1/1B3, OATP2B1 appeared to be unable to recognize aconitum alkaloids as substrates. Meanwhile, MDAs were shown to be much more sensitive to transport-mediated uptake, with an observed increase in concentration over 10-fold compared with control. Even though MDAs were less toxic than DDAs after metabolism in the liver, accumulation may still increase the risk of toxicity. In addition, hOCT1, hOCT3 and hOAT3 were confirmed to be involved in transport of aconitum alkaloids, suggesting that toxicity in the kidneys is highly likely to be associated with uptake mediated by them.
Liquorice, as a commonly used herb, is quite often applied in combination with aconite as a herb-pair, either to reduce toxicity or to enhance efficacy. Our previous study indicated that liquorice may attenuate toxicity through upregulating the efflux of transporter over a relatively long term.32 While aconitum alkaloids have been shown to be substrates of uptake transporters, inhibition on those transporters may lead to lower concentrations in the liver and/or kidneys. Our results show that bioactive ingredients of liquorice exhibited inhibitory effects on hOATPs, hOCTs and hOATs by varying amounts. Of all the compounds examined, glycyrrhetinic acid and licochalcone A as representatives of flavonoids and pentacyclic triterpene saponin exhibited potent inhibition effects, suggesting that liquorice may lower the toxicity of aconite via reducing uptake into organs. The IC50 values determined further supported that reduction of aconitum alkaloids in the liver and/or kidneys can be expected, due to the strong potency presented. This was also consistent with other observations suggesting that bioactive ingredients of liquorice might act as potent inhibitors of hOATPs.33,34
Finally, the detoxification effects of liquorice and its bioactive ingredients against aconitine toxicity were investigated in vivo through tissue distributions (liver and kidneys) in rats using transporter inhibitors as controls. The data revealed that inhibition of hOATPs by rifampin greatly contributed to reduction of aconitine in the liver, by approximately 49.7 and 60.3%, respectively, in terms of AUC and Cmax The in vitro study suggested that hOCTs might have a larger impact on mediating transport of aconitum alkaloids, for instance hOCT1, while the reduction of aconitine in the liver using quinidine was marginal. This might be associated with the inhibitory effect of quinidine on CYPs,35 which diminishes its impact on the uptake transporter through reducing the metabolism of the chemical. Thus, the concentration was maintained at a relatively higher level than expected. Meanwhile, Tmax was postponed when pretreated with quinidine, which might further support that quinidine exhibited diverse functions on both transporters and CYPs. Most importantly, the hepatic level of aconitine decreased after liquorice extract was pre-administrated to rats. The reduced exposure to aconitine was very close to that of the rifampin-pretreated group, even though the Cmax was 1.2-fold higher. On the other hand, glycyrrhetinic acid was found to be unable to change the aconitine concentration in the liver, which was different from observations from our in vitro study. This might be related to its inhibitory effect on the efflux transporter,36,37 which enhanced the accumulation of aconitine in systematic circulation in our previous investigation (data not shown) and neutralized reduction in the liver in the end. The change in aconitine in the kidneys was of particular interest, since it was not altered after concomitant administration of inhibitors and/or liquorice extract. There may be other reasons, as yet undetermined, for its exposure and changes in the kidneys.
6. Conclusion
In this study, the results showed that uptake transporters were involved in the transport of aconitum alkaloids across the membrane and entering into the liver and/or kidneys, which is strongly associated with the toxicity of exposure in these two organs. Additionally, bioactive ingredients of liquorice were investigated and screened for their inhibitory effects on uptake transporters by utilizing radiolabeled probe substrates in vitro, suggesting the potential detoxification effect of liquorice by inhibiting the function of those uptake transporters. The IC50 values of specific bioactive compounds in liquorice were determined and further confirmed that the potencies of inhibition exhibited were strong in comparison with that of positive inhibitors. The in vivo study was supportive of the fact that liquorice may help to alleviate the damage of aconitine (as a representative compound of aconitum alkaloids) through reducing its accumulation in the liver and/or kidneys after the animals were pretreated. These results provide a new insight into the detoxification effects of liquorice when combined with other toxic herbal medicines.
Conflicts of interest
There are no conflicts to declare.
Abbreviations
| HEK293 | Human embryonic kidney 293 cells |
| MDCK | Madin–Darby canine kidney cells |
| OATP | Organic anion-transporting polypeptide |
| OAT | Organic anion transporter |
| OCT | Organic cation transporter |
| TEA | Tetraethylammonium |
| PAH | para-Aminohippuric acid |
| ES | Estrone sulfate |
| EG | Estradiol-17β-glucuronide |
| CYP | Cytochrome P450 |
Acknowledgements
This work was supported by National Key Research and Development Program (Grant No. 2016YFE0121400), National Natural and Science Foundation (Grant No. 81430096), Macau Science and Technology Development Fund (006/2015/AMJ to Y. Xie), the Program of Changjiang Scholars and Innovative Research Team in University (No. IRT_14R41) and Tianjin Natural and Science Foundation (No. 17YFZCSY01170). The authors are also very grateful to Mr Chuan Li and Dr Haizhi Zhang for their technical assistance and helpful discussions.
References
- Y. V. Nesterova, T. N. Povetieva, N. I. Suslov, G. N. Zyuz’kov, S. G. Aksinenko, S. V. Pushkarskii and A. V. Krapivin, Exp. Biol. Med., 2014, 156, 665–668 CrossRef CAS PubMed.
- D. Zhao, J. Wang, Y. Cui and X. Wu, J. Tradit. Chin. Med., 2012, 32, 308–313 CrossRef PubMed.
- E. Nyirimigabo, Y. Xu, Y. Li, Y. Wang, K. Agyemang and Y. Zhang, J. Pharm. Pharmacol., 2015, 67, 1–19 CrossRef CAS PubMed.
- T. Y Chan, B. Tomlinson, L. K. Tse, J. C. Chan, W. W. Chan and J. A. Critchley, Vet. Hum. Toxicol., 1994, 36, 452–455 Search PubMed.
- T. Y. Chan, Vet. Hum. Toxicol., 1994, 36, 326–328 CAS.
- J. Nie, F. Wang, T. Ji, J. Zhao and F. Zhao, J. Pharm. Biomed. Anal., 2017, 137, 84–89 CrossRef CAS PubMed.
- P. K. Sarkar, P. K. Prajapati, V. J. Shukla and B. Ravishankar, Ethnopharmacology, 2017, 205, 138–146 CrossRef CAS.
- H. Yamanaka, A. Doi, H. Ishibashi and N. Akaike, Br. J. Pharmacol., 2010, 135, 816–822 CrossRef PubMed.
- M. Fu, R. X. Li, L. Fan, G. W. He, K. L. Thronburg and Z. Wang, Biochem. Pharmacol., 2008, 75, 2147–2156 CrossRef CAS PubMed.
- C. Peng, L. Wang, Y. H. Wang, Y. X. Li and Y. Pan, Eur. J. Drug Metab. Pharmacokinet., 2009, 34, 213–220 CrossRef.
- J. Friese, J. Gleitz, U. T. Gutser, J. F. Heubach, T. Matthiesen, B. Wilffert and N. Selve, Eur. J. Pharmacol., 1997, 337, 165–174 CrossRef CAS.
- Y. Wang, S. Wang, Y. Liu, L. Yan, G. Dou and Y. Gao, J. Chromatogr. B: Anal. Technol. Biomed. Life Sci., 2006, 844, 292–300 CrossRef CAS PubMed.
- Y. Fujita, K. Terui, M. Fujita, A. Kakizaki, N. Sato, K. Oikawa, H. Aoki, K. Takahashi and S. Endo, J. Anal. Toxicol., 2007, 31, 132–137 CrossRef CAS PubMed.
- M. Mizugaki, K. Ito, Y. Ohyama, Y. Konishi, S. Tanaka and K. Kurasawa, J. Anal. Toxicol., 1998, 22, 336–340 CrossRef CAS PubMed.
- H. Zhang and M. Jia, Chin. J. Exp. Tradit. Med. Formulae, 2012, 18, 283–285 Search PubMed.
- H. Zhao and X. L. Li, Journal of Changchun University of Traditional Chinese Medicine, 2012, 28, 17–18 Search PubMed.
- B. Sun, L. Li, S. Wu, Q. Zhang, H. Li, H. Chen, F. Li, F. Dong and X. Yan, Anal. Biochem., 2009, 395, 125–133 CrossRef CAS PubMed.
- S. Chiba, T. Ikawa, H. Takeshita, S. Kanno, T. Nagai, M. Takada, T. Mukai and M. F. Wempe, Toxicology, 2013, 310, 98–103 CrossRef CAS PubMed.
- S. Chiba, T. Ikawa, H. Takeshita, K. Ichiba, M. Sagi, T. Mukai and N. Anzai, Leg. Med., 2011, 13, 180–185 CrossRef CAS PubMed.
- Y. Suzuki, T. Oyama, A. Ishige, T. Isono, A. Asami, Y. Ikeda, M. Noguchi and Y. Omiya, Planta Med., 1994, 60, 391–394 CrossRef CAS PubMed.
- M. Murayama, T. Mori, H. Bando and T. Amiya, J. Ethnopharmacol., 1991, 35, 159–164 CrossRef CAS PubMed.
- Y. V. Nesterova, T. N. Povetieva, N. I. Suslov, G. N. Zyuz’kov, S. G. Aksinenko, S. V. Pushkarskii and A. V. Krapivin, Bull. Exp. Biol. Med., 2014, 156, 665–668 CrossRef CAS PubMed.
- D. Zhao, J. Wang, Y. Cui and X. Wu, J. Tradit. Chin. Med., 2012, 32, 308–313 CrossRef PubMed.
- T. Y. Chan, B. Tomlinson, L. K. Tse, J. C. Chan, W. W. Chan and J. A. Critchley, Vet. Hum. Toxicol., 1994, 36, 452–455 CAS.
- C. C. Lin, T. Y. Chan and J. F. Deng, Bull. Exp. Biol. Med., 2004, 43, 574–579 Search PubMed.
- Y. T. Tai, P. P. But, K. Young and C. P. Lau, Lancet, 1992, 340, 1254–1256 CrossRef CAS.
- K. Xiao, L. Wang, Y. Liu, C. Peng, G. Yan, J. Zhang, Y. Zhuo and H. Li, Birth Defects Res., Part B, 2007, 80, 208–212 CrossRef CAS PubMed.
- J. P. Keogh, Adv. Pharmacol., 2012, 63, 1–42 CAS.
- P. J. Neuvonen, M. Niemi and J. T. Backman, Clin. Pharmacol. Ther., 2006, 80, 565–581 CrossRef CAS PubMed.
- Y. Shitara, T. Itoh, H. Sato, A. P. Li and Y. Sugiyama, J. Pharmacol. Exp. Ther., 2003, 304, 610–616 CrossRef CAS PubMed.
- I. S. Song, H. J. Shin, E. J. Shim, I. S. Jung, W. Y. Kim, J. H. Shon and J. G. Shin, Clin. Pharmacol. Ther., 2008, 84, 559–562 CrossRef CAS PubMed.
- Y. F. He, X. Y. Ci, Y. Xie, X. L. Yi, Y. Zeng, Y. Z. Li and C. X. Liu, Phytomedicine, 2019, 56, 175–182 CrossRef CAS PubMed.
- Y. Dai, B. L. Ma, M. Zheng, R. Shi, Y. Y. Li, T. M. Wang and Y. M. Ma, RSC Adv., 2017, 7, 15236–15245 RSC.
- A. Zhang, C. Wang, Q. Liu, Q. Meng, J. Peng, H. Sun, X. Ma, X. Huo and K. Liu, Drug Metab. Dispos., 2013, 41, 994–1003 CrossRef CAS PubMed.
- O. K. Thu, O. G. Nilsen and B. Hellum, Pharm. Biol., 2016, 54, 3249–3256 CrossRef CAS PubMed.
- Q. Zhao, Y. Wang, H. Wang and L. Feng, Xenobiotica, 2018, 48, 1157–1163 CrossRef CAS PubMed.
- L. Chen, J. Yang, A. K. Davey, Y. X. Chen, J. P. Wang and X. Q. Liu, Xenobiotica, 2009, 39, 955–963 CrossRef CAS PubMed.
Footnote |
| † Authors have equal contributions to this paper. |
|
| This journal is © The Royal Society of Chemistry 2019 |
Click here to see how this site uses Cookies. View our privacy policy here. 
 Open Access Article
 This Open Access Article is licensed under a Creative Commons Attribution-Non Commercial 3.0 Unported Licence
 a,
Ze Wang†b,
Weidang Wuc,
Ying Xied,
Zihong Weic,
Xiulin Yic,
Yong Zengc,
Yazhuo Li
a,
Ze Wang†b,
Weidang Wuc,
Ying Xied,
Zihong Weic,
Xiulin Yic,
Yong Zengc,
Yazhuo Li