
 Open Access Article
 This Open Access Article is licensed under a Creative Commons Attribution-Non Commercial 3.0 Unported Licence
Role of Al-doping with different sites upon the structure and electrochemical performance of spherical LiNi0.5Mn1.5O4 cathode materials for lithium-ion batteries†
Anyong Chen‡
a,
Linglong Kong‡bc,
Yang Shuc,
Wenchao Yanbc,
Wei Wubc,
Yongji Xu*a,
Hongtao Gao*a and
Yongcheng Jin *bc
*bc
aState Key Laboratory Base of Eco-Chemical Engineering, College of Chemistry and Molecular Engineering, Qingdao University of Science & Technology, Qingdao 266042, China
bCenter of Materials Science and Optoelectronics Engineering, University of Chinese Academy of Sciences, Beijing 100049, China
cQingdao Institute of Bioenergy and Bioprocess Technology, Chinese Academy of Sciences, Qingdao 266101, China. E-mail: jinyc@qibebt.ac.cn
First published on 24th April 2019
Abstract
Al-doped spinel LiNi0.5Mn1.5O4 materials with different sites and contents were synthesized by rapid precipitation combined with hydrothermal treatment and calcination. The roles of Al on structural stability and electrochemical performance were studied by utilizing a series of techniques. XRD patterns indicated lower ion diffusion and no impure phased in doped samples. FT-IR and CV results reveal that Al-doped materials possess a Fd![[3 with combining macron]](https://www.rsc.org/images/entities/char_0033_0304.gif) m space group with increased disorder and increasing amounts of Mn3+. SEM and TEM equipped with EDS were used to characterize the regular morphology accompanied by a complete crystal structure and homogeneous distribution of elements. The Al content at the Ni, Mn, and Ni/Mn sites was optimized to be 5%, 3% and 5% (in total), respectively. The cycling stability was considerably enhanced at an ambient temperature (25 °C) and high temperature (55 °C). A typical Al dual-doped sample at Ni/Mn sites with 5% content delivered a reversible capacity of 113.5 mA h g−1 after 200 cycles at 0.5C. The discharge capacity at 5, 10 and 20C was 127.3, 125.5 and 123.1 mA h g−1, respectively. The discharge capacity remained at 126 mA h g−1 after 50 cycles (55 °C, 0.5C). Subsequent EIS and analytical results of the cycled electrode showed improved structural stability with a lower resistance, stable cathode/electrolyte interface, and reduced dissolution of Mn. These data further demonstrated the feasibility and reliability of preparing high-performance spinel LiNi0.5Mn1.5O4 cathode materials by doping with a suitable amount of Al.
m space group with increased disorder and increasing amounts of Mn3+. SEM and TEM equipped with EDS were used to characterize the regular morphology accompanied by a complete crystal structure and homogeneous distribution of elements. The Al content at the Ni, Mn, and Ni/Mn sites was optimized to be 5%, 3% and 5% (in total), respectively. The cycling stability was considerably enhanced at an ambient temperature (25 °C) and high temperature (55 °C). A typical Al dual-doped sample at Ni/Mn sites with 5% content delivered a reversible capacity of 113.5 mA h g−1 after 200 cycles at 0.5C. The discharge capacity at 5, 10 and 20C was 127.3, 125.5 and 123.1 mA h g−1, respectively. The discharge capacity remained at 126 mA h g−1 after 50 cycles (55 °C, 0.5C). Subsequent EIS and analytical results of the cycled electrode showed improved structural stability with a lower resistance, stable cathode/electrolyte interface, and reduced dissolution of Mn. These data further demonstrated the feasibility and reliability of preparing high-performance spinel LiNi0.5Mn1.5O4 cathode materials by doping with a suitable amount of Al.
Introduction
Huge transformations in lifestyle and energy structures have led to the development of high-performance chemical-power sources, especially secondary batteries. Popularization of portable devices, electric vehicles and “clean” (e.g. wind, solar, tidal) energy have led to advances in secondary batteries. Lithium-ion batteries (LIBs) have become promising candidates by virtue of their outstanding energy density and cycling properties.1,2 However, improvements in the energy density and power density of LIBs are needed to meet increasing challenges.3,4 According to calculations, increasing the working voltage of cathode materials is considered to be an effective route to enhancing the energy density and power density of LIBs.5 Fortunately, spinel LiNi0.5Mn1.5O4 (LNMO) operating at 4.7 V (vs. Li/Li+) possesses a higher energy density of 650 W h kg−1 compared with commercial LiFePO4 and LiCoO2. Moreover, the spinel lattices provide three-dimensional pathways for Li+,6 which promote Li+ diffusion and the power density of LNMO cathode materials. However, the popularization of LNMO is impeded by the inevitable decomposition of the electrolyte and the unstable cathode/electrolyte interphase combined with continual side-reactions at high working potentials.7 The decay in the structures and electrochemical properties is readily occurs, especially at increasing temperatures.Aimed at current issues in the area of LNMO materials, efforts have been made to alleviate the irreversible degradation in structures and performance. The applied electrolyte, including salts, solvents and additives, has been optimized to enhance tolerance and stability in harsh electrochemical environments.8–15 More attention has been paid to solving the undesirable features of LNMO materials. Several methods have been adopted to regulate the microstructure and aggregation morphology of precursor and LNMO materials: ball milling,16 solid-state reaction,17 sol–gels,18 solvothermal synthesis,19 template synthesis20 and co-precipitation.21 The precursor and LNMO can be controlled into irregular particles, nano-rods, polyhedrons and microspheres.22–24 Meanwhile, coating modification has been shown to decrease direct contact between materials and electrolyte. As a result, electrolyte decomposition and Mn3+ dissolution are inhibited. The coating materials used have been oxides, ferrite compounds, phosphate, fluoride and fast-ion conductors.25–33 Moreover, doping has been employed to adjust the compositions of LNMO, which can regulate Mn3+ content in the matrix, and enhance the interface stability under working conditions. Nonmetallic elements, such as F and S, have been adopted to partially substitute O, strengthen the structural stability, and improve the electrochemical properties of LNMO.34,35 Exchanges can be made at Li sites with Na+ to ameliorate the rate performance accompanied by satisfactory cycle stability.36 The replacement of Mn by Ni in LiMn2O4 can eliminate the phase transition and lower electrical conductivity. However, electrochemical and structural stability are needed, and can be improved by doping with other elements at different transition metal ion sites.37 Metal elements with a similar ionic radius have been utilized to occupy some transition metal ion sites in the form of single or dual doping: Cr, Fe, Co, Ga, Cu, Zn, Mg, and Ti.38–41 Some elements with a larger ionic radius, such as Zr, Ru, Y, Ce, Nd and Sm,42–46 have been introduced into LNMO to reinforce the stability of the structure and performance. Zhang et al.47 studied Cr-doped LNMO cathode materials from low to high temperature prepared by a sol–gel method and calcination at 900 °C. Al, with its smaller ionic radius, can diffuse readily into the crystal structures of LNMO, and flexibly affects the states of Ni and Mn when doped at different sites. Xie et al.48 analyzed the role of Al at Mn sites in LNMO obtained by co-precipitation and calcination (900 °C, 20 h). Chen et al.49,50 explored the effect of Al in LNMO synthesized by thermopolymerization. However, few studies have focused in detail on the specific effect of Al-doping at different sites on structural stability and electrochemical performance for LNMO materials with regular morphology and polycrystalline phase.
We have shown that rapid precipitation combined with hydrothermal treatment has been shown to be a feasible method to prepare the precursor materials for LIBs with controlled morphology.19,51 Herein, spherical LNMO materials composed of primary particles were obtained by rapid precipitation and hydrothermal treatment as well as calcination. Al was introduced at different sites (Ni, Mn and simultaneous Ni/Mn sites) with various contents. We found that optimal doping Al at different sites promoted the structural and electrochemical stability of LNMO materials.
Experimental
Synthesis of precursors and cathode materials
All the reagents were purchased from Sinopharm Chemical Reagents and used without further purification. Normal spherical precursors Ni0.25Mn0.75CO3 were synthesized by rapid precipitation and hydrothermal treatment according to the literature.51 The molar ratio of (NH4)2CO4 and Na2CO3 as mixed precipitants was set at 1![[thin space (1/6-em)]](https://www.rsc.org/images/entities/char_2009.gif) :2. To prepare Al-doped samples at different sites, the relevant amounts of NiSO4·6H2O or MnSO4·H2O were decreased to prepare the corresponding precursors. The mass of NiSO4·6H2O was reduced based on the stoichiometry to produce Ni0.25−αMn0.75CO3 (α = 0.005, 0.015, 0.025 and 0.035) precursors. The Ni0.25Mn0.75−βO4 (β = 0.005, 0.015, 0.025 and 0.035) precursors matched the decrease in MnSO4·H2O. Moreover, the syntheses of Ni0.25−γMn0.75−γCO3 (γ = 0.0025, 0.0075, 0.0125, 0.0175) corresponded with the simultaneous reduction of NiSO4·6H2O and MnSO4·H2O.
:2. To prepare Al-doped samples at different sites, the relevant amounts of NiSO4·6H2O or MnSO4·H2O were decreased to prepare the corresponding precursors. The mass of NiSO4·6H2O was reduced based on the stoichiometry to produce Ni0.25−αMn0.75CO3 (α = 0.005, 0.015, 0.025 and 0.035) precursors. The Ni0.25Mn0.75−βO4 (β = 0.005, 0.015, 0.025 and 0.035) precursors matched the decrease in MnSO4·H2O. Moreover, the syntheses of Ni0.25−γMn0.75−γCO3 (γ = 0.0025, 0.0075, 0.0125, 0.0175) corresponded with the simultaneous reduction of NiSO4·6H2O and MnSO4·H2O.
The obtained precursors were fully ground with lithium sources (Li2CO3, 5% excess). To synthesize the Al-doped samples, stoichiometric amounts of Al2O3 nanopowder (∼20 nm) were added. Then, the mixed powders were calcined at two-stage temperature intervals in a muffle furnace filled with air. Detailed procedures are shown in ref. 19. Subsequently, the cooled powders were manually ground to obtain cathode materials. The Ni0.25−αMn0.75CO3 (α = 0.005, 0.015, 0.025 and 0.035) precursors corresponded to Li1−xNi0.5−xAlxMn1.5O4 (x = 0.01, 0.03, 0.05 and 0.07) cathode materials with Al-doping at the Ni sites. Li1+xNi0.5Mn1.5−xAlxO4 (x = 0.01, 0.03, 0.05 and 0.07) with partial substitution of Mn was related to the precursors Ni0.25Mn0.75−βO4 (β = 0.005, 0.015, 0.025 and 0.035). The precursors Ni0.25−γMn0.75−γCO3 (γ = 0.0025, 0.0075, 0.0125 and 0.0175) were homologous with LiNi0.5−x/2AlxMn1.5−x/2O4 (x = 0.01, 0.03, 0.05 and 0.07) by simultaneous replacement of Ni and Mn.
Materials characterization
The elemental content in the prepared LNMO materials was confirmed by inductively coupled plasma-atomic emission spectroscopy (ICP-AES) using an iCAP7000 system (Thermo Fisher Scientific). Analyses of the phase structures of LNMO materials and electrodes were conducted by X-ray diffraction (XRD) with a micro-diffractometer (AXS D8 Advance; Bruker) and the corresponding lattice parameters were obtained by using the supporting software. The order of crystal structures was confirmed by applying Fourier-transformation infrared (FTIR) spectroscopy (V80; Bruker) and KBr pellets with a controlled range (400–700 cm−1). The morphologies and microstructures of the prepared samples and cycled lithium anode were characterized by field emission scanning electron microscopy (FESEM) on a S-4800 system (Hitachi) and transmission electron microscopy (TEM) on a Tecnai G2 F20 system (FEI) combined with energy-dispersive X-ray spectroscopy.Electrochemical measurements
Cathode electrodes were fabricated by grinding active materials, conductive carbon (Super P) and binder (polyvinylidene fluoride, PVdF) at a mass ratio of 80:10:10 with an adequate amount of N-methyl-2-pyrrolidone (NMP) for 0.5 h. The slurries obtained were spread on Al foil at a controlled thickness. The solvent was removed by drying at 120 °C for 12 h under a vacuum. The dried laminates were punched into rounds (φ = 14 mm), followed by pressing at 0.4 MPa for 120 s. Half cells (CR2032-type) were assembled by employing Li foil (φ = 16 mm) as the anode, polypropylene (PP) film (Celgard 2400; φ = 17 mm; 25 μm) as a separator, and 1 M LiPF6 dissolved in ethylene carbonate/dimethyl carbonate (1:1 in mass ratio) as the electrolyte in a glove box.
The redox process of the cathode materials in the half cells was presented through cyclic voltammetry (CV) on an electrochemical workstation (CHI 400; CH Instruments) in the potential range 3.0–4.9 V (vs. Li/Li+). The scan rate was fixed at 0.1 mV s−1. The capacity and cycling stability of the as-prepared materials were measured in a galvanostatic model on a testing system (Land 2010) from 3.0 to 4.9 V at ambient temperature (25 °C) and high temperature (55 °C), respectively. Moreover, the interface properties of the cathodes before and after cycling were analyzed by electrochemical impedance spectroscopy (EIS) obtained using an electrochemical workstation with a limited frequency range (100 kHz to 100 mHz) and amplitude (5 mV).
Results and discussion
ICP-AES results of the selected LNMO samples demonstrated the comparatively accurate proportion of each element (Table S1, ESI†). The detailed XRD patterns corresponding to Li1−xNi0.5−xAlxMn1.5O4, Li1+xNi0.5Mn1.5−xAlxO4 and LiNi0.5−x/2AlxMn1.5−x/2O4 (x = 0.01, 0.03, 0.05 and 0.07) are listed in Fig. 1. The typical diffraction peaks of pristine LNMO and Al-doped LNMO at different sites were in accordance with the standard pattern of spinel LiNi0.5Mn1.5O4 (PDF#80-2162), which belongs to the Fdm space group. Meanwhile, all LNMO materials displayed fine crystallinity with sharp and narrow peaks (Fig. 1a–c). No obvious peaks related to LiyNi1−yO2 impurities were detected at around 37°, 43° or 63° in undoped and doped LNMO.47 Peaks around 20–30° related to LiAlO2 with increasing amounts of Al were not observed, thereby showing a relatively reasonable amount of doping. Introduction of Al led to few adverse effects on the LNMO crystallization. Moreover, the characteristic reflections of (110), (320), (510) and (522) in LNMO with the P4332 space group were not observed in the prepared LNMO materials, indicating that the Al-free and Al-doped LNMO structures are in the Fdm space group.52 The lattice-parameter values of different LNMO materials with various Al contents were calculated based on XRD patterns to assess the relevant rules in structural change (Fig. 1d and Table S2, ESI†). The value of the lattice parameter related to Al-free LNMO was 8.1715 Å. After addition of Al, the lattice parameter decreased with increasing doping levels when Al solely occupied Ni sites and occupied the sites of Ni and Mn simultaneously. This phenomenon may have been caused by the difference in the radii of Ni2+ (0.69 Å), Mn4+ (0.53 Å) and Al3+ (0.50 Å). The higher doping level in LNMO, especially at Ni sites, enlarged the difference in ionic radii and resulted in sustained reduction of lattice parameters. Interestingly, the change in the lattice parameters at Al-doped LNMO at Mn sites was different, with an initial decrease and subsequent slight increase. The radius of Mn3+ (0.66 Å) is larger than that of Mn4+. Partial replacement of Mn by Al, with its smaller ionic radius, may have promoted moderate generation of Mn3+ and increased the lattice parameters to some extent. The evident variation in the lattice parameters demonstrated the substitutions of Ni2+ and Mn4+ by Al3+ in 16d octahedral positions, which was shown by the results of Rietveld refinements (Table S3, ESI†). More importantly, the intensity ratio between the strongest (111) diffraction peak for the spinel structure to the representative (311) diffraction peak for the anti-spinel structure mirrored the diffusion of Li+ and transition metal ions (Ni2+ and Mn4+) in the LNMO matrix.53 In general, the increased diffusion along with a low intensity ratio hampered Li+ diffusion and, thus, impaired the electrochemical performance of LNMO. The desirable value in the standard curve was 2.66, whereas the ratio of the prepared Al-free LNMO was 2.04. After Al addition, the value of I111/I311 usually increased and then decreased, accompanied by an increased content of Al. Ideal values could be acquired for different samples. Li0.95Ni0.45Al0.05Mn1.5O4, Li1.03Ni0.5Al0.03Mn1.47O4 and LiNi0.475Al0.05Mn1.475O4 revealed comparatively small ion diffusion. In addition, doping Al can affect the primary particle size, which can be calculated from the test patterns. The mean crystal size was determined by applying the Scherrer equation (k = 0.89, λ = 0.154056 nm) to the full width at half maximum (FWHM) of the (111) peaks at 2θ of 18.8°. The crystalline grain of undoped LNMO was ∼54.5 nm, which was close to the size of 3% Al-doped LNMO at Mn sites. The crystal particle of 5% Al-doped LNMO at Ni sites and Ni/Mn sites was 50.5 nm and 51.5 nm, respectively.
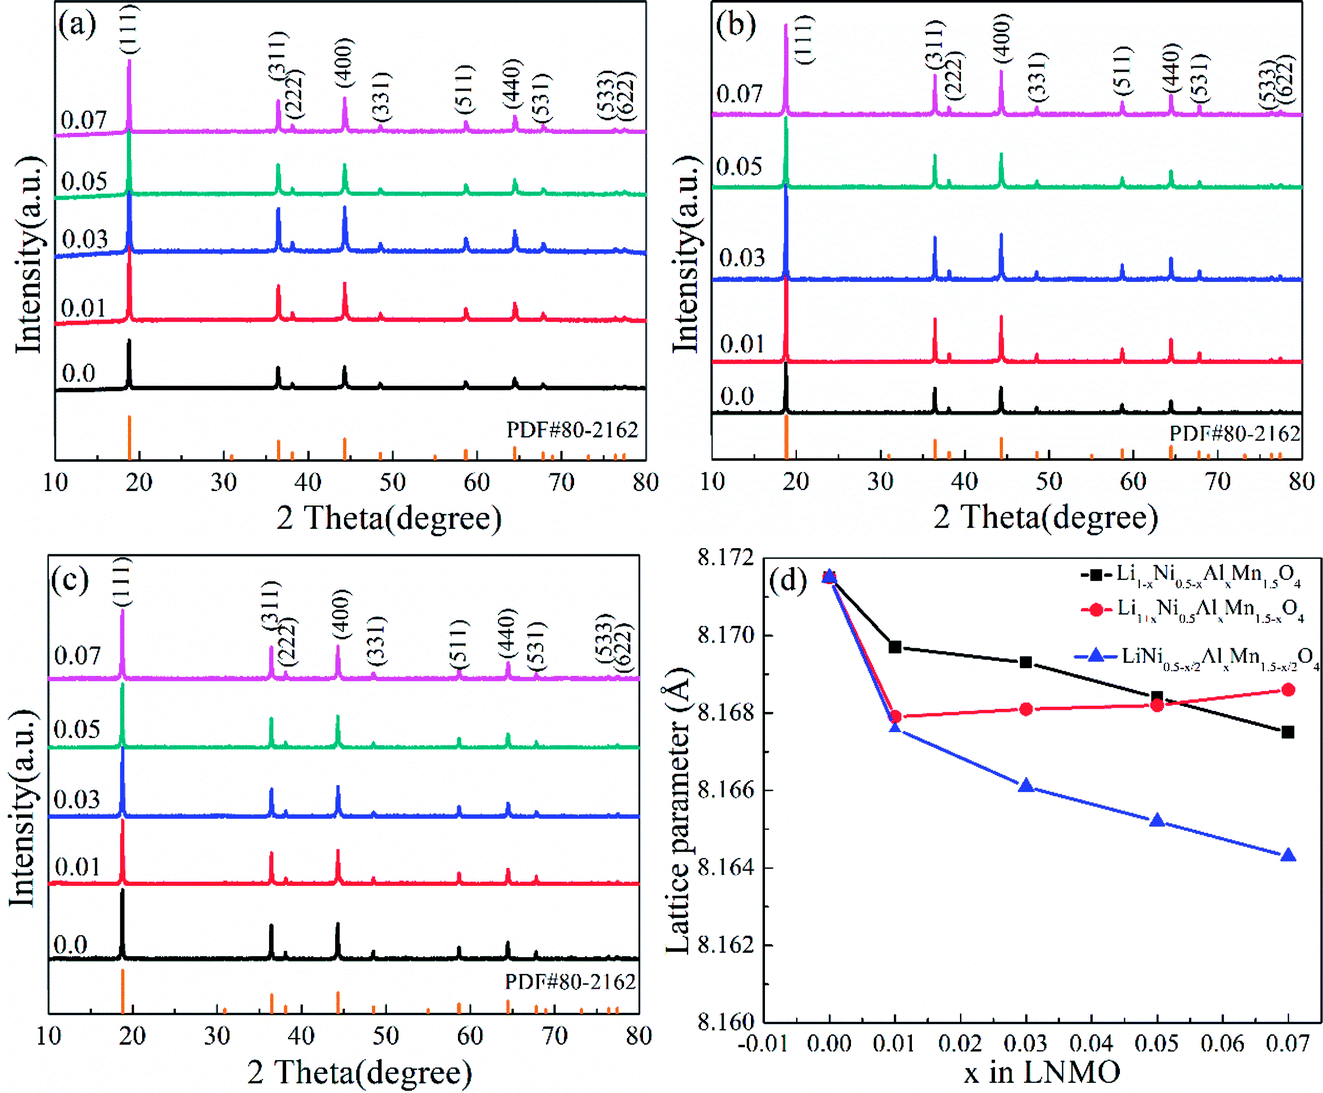 | ||
| Fig. 1 XRD patterns of (a) Li1−xNi0.5−xAlxMn1.5O4, (b) Li1+xNi0.5AlxMn1.5−xO4 and (c) LiNi0.5−x/2AlxMn1.5−x/2O4 combined with lattice-parameter values (d). | ||
FT-IR spectroscopy was applied to provide more evidence for the Fdm space group. The five characteristic adsorption peaks of the FT-IR spectra in Fig. 2 corresponded to LiNi0.5Mn1.5O4, Li0.95Ni0.45Al0.05Mn1.5O4, Li1.03Ni0.5Al0.03Mn1.47O4 and LiNi0.475Al0.05Mn1.475O4. This result showed that the prepared LNMO samples possessed a disordered structure in the Fdm space group. The integral intensity ratio of the Mn–O band at 622 cm−1 to the Ni–O band at 584 cm−1 reflected the degree of disorder between Ni and Mn. The two integral intervals are marked in Fig. 2 with dotted lines, and relevant results are listed in the inserted table. We concluded that doping Al in the LNMO matrix augmented the degree of disorder. That is, it increased the content of Mn3+ due to the charge balance when substituting Ni2+ by Al3+, or the charge difference between Al and Mn when replacing Mn4+.54 Thus, the electrochemical performance of LNMO could be enhanced with the superior electronic conductivity and Li+ diffusion coefficient in a more disordered spinel structure.48,55 Sun et al. found that LNMO materials with Fdm and P4332 space groups experienced reversible phase transition in electrochemical reactions.52 However, migration of transition metal ions during lithium intercalation/deintercalation may induce some undesirable structural degradation, and hamper the electrochemical performance of LNMO electrodes. Cao et al. stated that a surface-doping strategy with Al in the interstitial sites (16c) of LNMO could control the migration of transition-metal ions effectively by decreasing the number of possible routes to guarantee the stability of LNMO.56 Therefore, Al introduced at 16d sites may help to maintain the stability of LNMO in a similar way.
 | ||
| Fig. 2 FT-IR spectra of (a) LiNi0.5Mn1.5O4, (b) Li0.95Ni0.45Al0.05Mn1.5O4, (c) Li1.03Ni0.5Al0.03Mn1.47O4 and (d) LiNi0.475Al0.05Mn1.475O4. | ||
Morphology information for the prepared LNMO was investigated using SEM. Fig. S1a (ESI†) reveals that Al-free LNMO materials possess regular spherical secondary particles stacked by nano primary grains with some pores on the surface, and that the size of the centers of these particles was 2–7 μm. The existing pores on the LNMO materials can promote electrolyte infiltration and thus improve the electrochemical performance during redox reactions. For Al-doped LNMO samples at Ni sites, the relevant morphologies, surface characteristics and particle sizes were almost unchanged at low doping (Fig. S1b–d, ESI†). However, as the doping content increased to 7% at Ni sites, the obtained LNMO sample had structural cracks with incomplete spherical particles and scattered irregular granules (Fig. S1e, ESI†). These features reflected excessive substitutions of Ni by Al, which led to structural instability and could subsequently induce some undesirable results. The same phenomena were observed in LNMO materials with Al-doping at Mn sites (Fig. S1f–i, ESI†). A doping level of <3% was beneficial to synthesize spherical LNMO materials, whereas Al content of 5% and 7% led to the formation of ellipsoidal or broken spinel particles. Just like the dual-doped samples at Ni/Mn sites, the morphology of LNMO secondary particles showed change combined with breakage when the total content of Al in LNMO was >5% (Fig. 3a–d and S2, ESI†). The SEM data stated above showed that appropriate addition of Al had a vital role in maintaining a fine morphology and good structure. Accordingly, the amount of Al should be controlled to ≤5% at Ni sites, 3% at Mn sites, and 5% at Ni/Mn sites. EDS data for LiNi0.5Mn1.5O4 and LiNi0.475Al0.05Mn1.475O4 are shown in Fig. 4. Elemental Ni, Mn and O were distributed uniformly in the spherical particles of Al-free LNMO (Fig. 4a). The distribution of Ni and Mn in Al-doped LNMO was homogeneous. More importantly, elemental Al was dispersed homogeneously in secondary particles of the LNMO matrix within the red circle in Fig. 4b and S2, ESI,† which demonstrated that Al-doping into the lattice of LNMO was achieved.
 | ||
| Fig. 3 SEM images of (a–d) LiNi0.5−x/2AlxMn1.5−x/2O4 (x = 0.01, 0.03, 0.05 and 0.07). | ||
 | ||
| Fig. 4 Elemental distribution of (a) LiNi0.5Mn1.5O4 and (b) LiNi0.475Al0.05Mn1.475O4 (x = 0.05). | ||
Furthermore, TEM was employed to assess the microscopic fine structure of the LNMO materials. The chosen LNMO with 5% Al-doping at Ni/Mn sites was characterized by TEM (Fig. 5). In the low-magnification model (Fig. 5a), LNMO materials (LiNi0.475Al0.05Mn1.475O4) accumulated some nano-grains. The size of the nano-crystals was nearly 50 nm, which was close to the calculated value from XRD patterns. In addition, some interparticle pores were formed due to the gathering of primary particles, which could enhance the soaking of the electrolyte in the battery system. The framed area is magnified in the high-resolution model and displayed in Fig. 5b. The measured value of interplanar spacing was 0.47 nm, which was related to {111} crystal planes. High-resolution TEM demonstrated the presence of a {111} surface in dual-doped LNMO materials, which agreed well with XRD patterns. Meanwhile, the uniform distribution of elements in Fig. S4 (ESI†) was consistent with the data shown in Fig. 4, and showed that Al-doped LNMO materials at Ni/Mn sites had been prepared.
 | ||
| Fig. 5 TEM and HRTEM images of LiNi0.475Al0.05Mn1.475O4. | ||
The role of Al-doping on the electrochemical performance of spherical spinel LiNi0.5Mn1.5O4 cathode materials was assessed. First, the redox process was studied by applying CV in 2032-type coin cells with a located potential range of 3.0–4.9 V (vs. Li/Li+). The CV curves of Li1−xNi0.5−xAlxMn1.5O4, Li1+xNi0.5AlxMn1.5−xO4 and LiNi0.5−x/2AlxMn1.5−x/2O4 (x = 0, 0.01, 0.03, 0.05 and 0.07) shown in Fig. S5 (ESI†) and 6 illustrate that the prepared samples possessed a Fdm space group with three pairs of oxidation/reduction peaks. The pair of redox peaks located at 4 V (Fig. S5b, S5d, ESI† and 6b) corresponded to the reaction of Mn3+/Mn4+, and further demonstrated the presence of Mn3+ in the LNMO matrix. Along with the increasing Al in the LNMO material, the peak currents and areas exhibited an ascending trend, showing that more Mn3+ could be formed, which was in accordance with the results of XRD and FT-IR spectroscopy. Moreover, the peaks ascribed to Ni2+/Ni3+ and Ni3+/Ni4+ for Al-free LNMO were not well divided in the potential range 4.6–4.8 V (vs. Li/Li+). Instead, Al addition into the LNMO structure can result in well-separated redox peaks, implying a typical two-step reversible Li+ extraction/insertion process. Undoubtedly, the relevant redox peak currents and areas related to Ni2+/Ni3+ and Ni3+/Ni4+ were affected by a slight decrease or shift. The relatively strong redox peaks of Al-doping samples compared with Al-free LNMO revealed a desirable reversibility. CV curves were consistent with the above analysis on XRD and FT-IR spectroscopy.
 | ||
| Fig. 6 Cyclic voltammetry curves of LiNi0.5−x/2AlxMn1.5−x/2O4 (x = 0, 0.01, 0.03, 0.05 and 0.07) (a) and the enlarged area (b) within the potential range of 3.7–4.3 V (vs. Li/Li+). | ||
Fig. 7 displays the initial charge/discharge curves for LNMO electrodes with various Al contents and doped sites at 0.5C. The redox plateaus of Ni2+/Ni3+ and Ni3+/Ni4+ were observed near 4.75 V (vs. Li/Li+) (Fig. 7a–c). Al-doping could partly shorten the corresponding potential plateaus with an increasing amount of Al. Meanwhile, the plateaus around 4.1 V (vs. Li/Li+) referred to the electrochemical reaction of Mn3+/Mn4+, thereby denoting the existence of Mn3+ in LNMO materials. Also, the slightly extended plateaus indicated increased Mn3+ in LNMO structures, which matched well with the results stated above. In addition, the discharge capacities shown in Fig. 7d reflected the difference in electrochemical activity. Al-free LNMO materials delivered a capacity of 126.8 mA h g−1, and Al-doped samples at Ni sites possessed similar capacities except for the sample with x = 0.07. For Al-doped materials at Mn sites, the initial capacities were decreased. While Al simultaneously substituted Ni and Mn, the obtained materials had relatively high and stable capacities.
 | ||
| Fig. 7 Initial charge/discharge curves of (a) Li1−xNi0.5−xAlxMn1.5O4, (b) Li1+xNi0.5AlxMn1.5−xO4 and (c) LiNi0.5−x/2AlxMn1.5−x/2O4 (x = 0, 0.01, 0.03, 0.05 and 0.07) along with the distribution of discharge capacities (d). | ||
The cycling properties of LNMO materials were explored at a current density of 0.5C at 25 °C (Fig. 8). Doped LNMO materials delivered relatively smaller capacities than those of undoped LNMO in the first few cycles owing to the introduction of Al. However, LNMO without Al had distinct capacity decay with an increasing number of cycles. After 200 cycles, the discharge capacity was only 90.54 mA h g−1. On the contrary, Al-doped LNMO samples displayed improved electrochemical performance with large capacity retention ratios (Fig. 8a–c). The optimum content of Al at Ni sites was 5% (Fig. 8a). Similarly, the ideal amount of Al at Mn or Ni/Mn sites was 3% and 5% (Fig. 8b and c), respectively. Furthermore, LNMO materials doped solely by Al at Ni or Mn sites exhibited enhanced electrochemical properties in the content range 1–7%, whereas more Al (7%) in the dual-doped LNMO give rise to deteriorating cycling stability. Meanwhile, the specific capacity retention ratios in Fig. 8d further reflected the stabilizing effects of Al in the LNMO matrix during cycling. The pristine LNMO sample revealed an unappealing capacity retention ratio (71%), whereas the ratio for Li0.95Ni0.45Al0.05Mn1.5O4, Li1.03Ni0.5Al0.03Mn1.47O4 and LiNi0.475Al0.05Mn1.475O4 was 87%, 86% and 85.6%, respectively. We concluded that appropriate adoption of Al benefited the maintenance of cycling performance because excess Al in the lattice could increase the activation energy of Li+ movement, and further restrict intercalation/deintercalation behaviour.
 | ||
| Fig. 8 Cycling performance of (a) Li1−xNi0.5−xAlxMn1.5O4, (b) Li1+xNi0.5AlxMn1.5−xO4 and (c) LiNi0.5−x/2AlxMn1.5−x/2O4 (x = 0, 0.01, 0.03, 0.05 and 0.07) along with the capacity retention ratios (d) at 0.5C for 200 cycles (25 °C). | ||
The rate performance corresponding to doped and undoped LNMO cathodes was investigated further with gradually increasing current densities (0.5, 1, 2, 5, 10 and 20C) (Fig. 9). Fig. 9a shows that Al-doped LNMO at Ni sites had enhanced discharge capacity when the current density was >5C, which could facilitate the high power-density LIBs. Pristine LNMO materials delivered discharge capacities of 110.3 mA h g−1 at 10C and 90.7 mA h g−1 at 20C. In particular, the capacity of the 5% Al-doped sample at Ni sites reached 113.7 mA h g−1 at 10C, and 103.4 mA h g−1 at 20C. Similar patterns were discovered in Al-doped LNMO at Mn sites and Ni/Mn sites (Fig. 9b and c). The better doping levels of Al were 3% at Mn sites and 5% at Ni/Mn sites, respectively. Dual-doped LNMO materials had a higher discharge capacity compared with single-doped samples, especially at 5C, 10C and 20C. This discharge capacity could reach 127.3, 125.5 and 123.1 mA h g−1 accordingly. The normalized capacity ratios denoted the different discharge capacities at various current densities in relation to the initial capacity (0.5C), and provided evidence of an enhanced rate property. Fig. S6 (ESI†) and 9d show the specific variation of the ratios. Adoption of Al in the LNMO boosted the ratios (i.e., improved the relevant electrochemical performance at different current densities). By contrast, direct substitution of Mn or simultaneous replacement of Ni and Mn by Al was beneficial for electrochemical stability. Based on the consideration of capacity and normalized ratio, the optimal use of Al was 5%, 3% and 5%, respectively, which were consistent with the above-mentioned analysis. Undeniably, adding Al in the LNMO matrix will lower certain capacities at low current. However, the rate properties of the spherical LNMO materials could be improved because of the increased content of Mn3+ and degree of disorder in the LNMO materials.
 | ||
| Fig. 9 Rate performance of (a) Li1−xNi0.5−xAlxMn1.5O4, (b) Li1+xNi0.5AlxMn1.5−xO4 and (c) LiNi0.5−x/2AlxMn1.5−x/2O4 (x = 0, 0.01, 0.03, 0.05 and 0.07) along with the capacity ratios of LiNi0.5−x/2AlxMn1.5−x/2O4 (x = 0, 0.01, 0.03, 0.05 and 0.07) (d) at various current densities (0.5, 1, 2, 5, 10 and 20C). | ||
In addition, spherical LNMO materials were tested at 55 °C with a current density of 0.5C (Fig. 10). A higher working temperature can boost ionic mobility and capacity. However, decreased stability of the electrolyte and electrolyte/cathode interface can induce undesired capacity decay and even battery failure. Moreover, the increased reactivity of Mn3+ at increased temperatures can affect the structure of cathode materials. The prepared Al-free LNMO had a fairly obvious capacity decrease, and the reversible capacity decreased from 131 mA h g−1 at the first cycle to 57.7 mA h g−1 at the 50th cycle. After adding Al at Ni sites (Fig. 10a), the capacity and cycling stability improved. Among the different doping levels tested, the 5% Al-doped sample delivered a good performance with a capacity of 127.8 mA h g−1 (1st cycle) and 115.2 mA h g−1 for the 50th cycle. The same pattern was found in Al-doped LNMO at Mn sites and dual-doped LNMO at Ni/Mn sites (Fig. 10b and c). The optimal content of Al for doped materials at Mn sites was 3%. The capacities were 126.8 mA h g−1 (1st cycle) and 112.6 mA h g−1 (50th cycle). Meanwhile, the amount of Al for dual-doped LNMO was chosen to be 5%, and the discharge capacity could maintain 126 mA h g−1 after 50th cycles from the initial 111.7 mA h g−1. The detailed cycling data are listed in Table S4 (ESI†). An insufficient amount of Al in the LNMO matrix had a limited role in retaining electrochemical stability, possibly due to the unsteady material structure. An excess of Al in the doping also negatively influenced the performance at a higher temperature (55 °C) owing to the increase of Mn3+ and subsequent irreversible dissolution. The normalized capacity ratios for dual-doped LNMO at the 10th, 25th and 50th cycles (Fig. 10d) and detailed data (Table S4, ESI†) showed the practical effect of various Al-doping amounts. The relevant ratios for LNMO materials without Al were 74.12% (10th cycle), 59.08% (25th cycle) and 44.00% (50th cycle). An extremely severe capacity fade emerged, which could be attributed to the poor stability of cathode materials in this harsh electrochemical environment, and which blocked the availability of LNMO-based materials. The capacity ratios could be enhanced to some extent by introducing Al at Ni and Mn sites. By contrast, the total Al content of 5% was the optimal value. The corresponding ratios were 98.25% (10th cycle), 93.65% (25th cycle) and 88.00% (50th cycle), respectively. The Al–O bonds formed by doping possessed higher bond energies than those of Mn–O bonds and Ni–O bonds, so the structure for doped LNMO could be stabilized. Meanwhile, an excess of Al in LNMO materials led to an increase in Mn3+, and then aggravated its dissolution, resulting in a deteriorated cycle performance. Based on the systematic analysis of electrochemical performance on various LNMO materials, we concluded that Al-doping at Ni sites, Mn sites, or both Ni and Mn sites increased the capacity and stability of LNMO at high temperature, and the effect of Al-doping at Ni sites was better. Besides, the doped LNMO delivered relatively low capacity before 60 cycles at 0.5C, but showed enhanced capacity maintenance. Also, 3% Al-doped LNMO at Mn sites exhibited superior cycling stability. At high rates, dual-doping at Ni and Mn sites benefited the large capacity.
 | ||
| Fig. 10 Cycling performance of (a) Li1−xNi0.5−xAlxMn1.5O4, (b) Li1+xNi0.5AlxMn1.5−xO4 and (c) LiNi0.5−x/2AlxMn1.5−x/2O4 (x = 0, 0.01, 0.03, 0.05 and 0.07) at 55 °C (0.5C) along with the capacity retention ratios of LiNi0.5−x/2AlxMn1.5−x/2O4 (x = 0, 0.01, 0.03, 0.05 and 0.07) (d) after 10th, 25th and 50th cycles. | ||
To better comprehend the positive role of doping Al in LNMO materials, a series of techniques was employed. EIS was applied to assess the impedance and interfacial behaviour during cycling. The EIS spectra in Fig. S7 (ESI†) and 11 comprise a semicircle (which refers to the charge-transfer resistance (R) in the high-frequency region) and a declining line related to the semi-infinite Warburg diffusion impedance (W) in the low-frequency range. The applied equivalent circuit is shown in Fig. S7e (ESI†) to fit the tested spectra, and the obtained results are listed in Table S5 (ESI†). Pristine LNMO materials possessed a higher impedance (232.6 Ω) before cycling, whereas the doped samples had decreased values. The reduction in resistance could be ascribed to the increased disorder and Mn3+ content in the matrix, along with the enhanced conductivity due to introduction of Al. For Al-doped LNMO samples at Ni sites, the initial values of R declined gradually with the continuously raising Al content (Fig. S5a†). Through 200 cycles at 0.5C, the R value of the raw LNMO increased to 400 Ω, whereas the R values corresponding to the doped materials had various degree of diminution, especially 7% Al-doped LNMO at Ni sites (Fig. S7b, ESI†). Hence, Al-doping could stabilize the cathode structure and cathode/electrolyte interface and thus improve cycling performance. More Al in LNMO could hamper the structural stabilization accompanying excessive loss of Mn3+. With regard to Al-doped LNMO materials at Mn sites, a higher content of Al in the LNMO matrix led to increased R values before cycling (Fig. S7c, ESI†). The R value after 200 cycles diminished rapidly, except for the doped sample with 1% Al (Fig. S7d, ESI†). Moreover, the dual-doped LNMO at Ni/Mn sites exhibited similar patterns to that of Al-doped LNMO at Ni sites (Fig. 11). The higher content of Al in LNMO materials corresponded to smaller R values before increases in cycling (Fig. 11a). The R values decreased apart from the sample with 7% Al in total (Fig. 11b) after 200 cycles at 0.5C. Considering the resistance and its variation, the best content of Al in single-doped samples at Ni, Mn, and dual-doped Ni/Mn sites was 5%, 3% and 5%, respectively, in accordance with the results mentioned above. EIS data demonstrated that adopting Al to substitute Ni or Mn could strengthen structural and interfacial stability during working with more robust solid-electrolyte interfacial (SEI) layers.
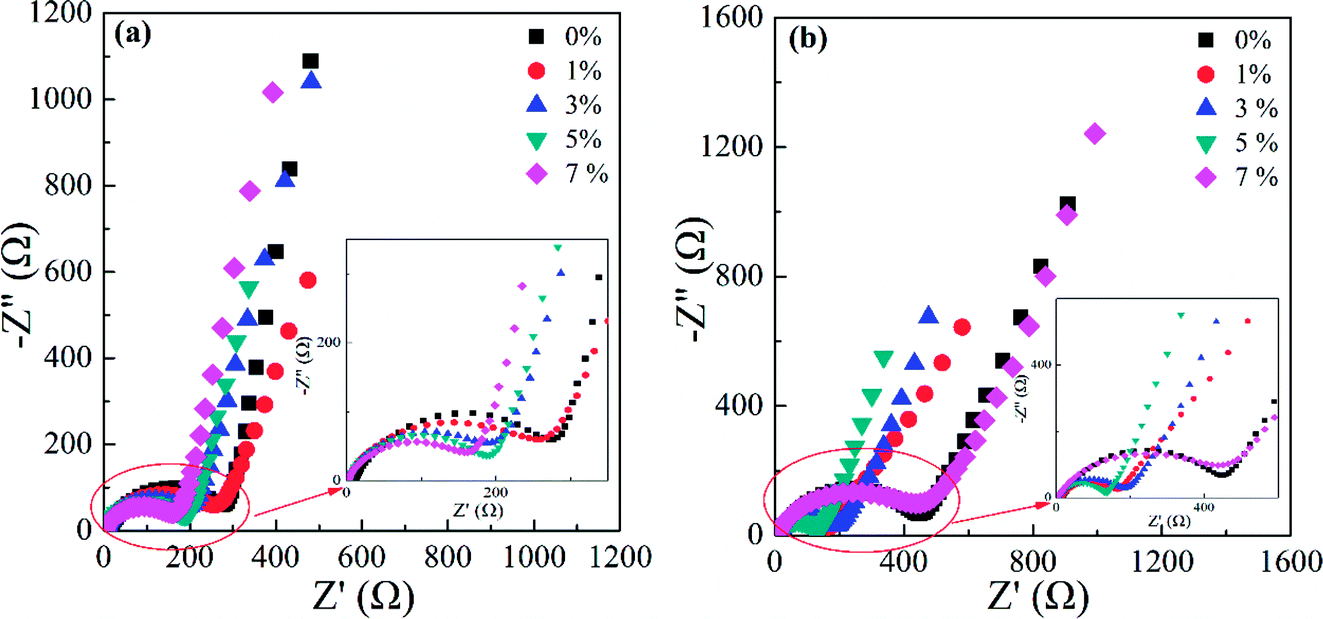 | ||
| Fig. 11 EIS spectra of LiNi0.5−x/2AlxMn1.5−x/2O4 (x = 0, 0.01, 0.03, 0.05 and 0.07) before (a) and after 200 cycles (b) at 0.5C. | ||
The cycled LNMO materials and electrodes were examined further to verify the positive effect of Al-doping. First, the electrodes before and after cycling were selected for comparison by employing XRD (Fig. 12). The pristine LiNi0.5Mn1.5O4 electrode and LiNi0.475Al0.05Mn1.475O4 electrode had a typical LNMO diffraction pattern (PDF#80-2162) with weaker diffraction peaks of the current collector (Al foil). However, after undergoing 200 cycles at 0.5C, the intensities related to the diffraction peaks of the LiNi0.5Mn1.5O4 electrode decreased obviously with distinct peaks of Al as the current collector. Meanwhile, the lattice parameter changed from 8.1715 Å to 8.1570 Å, indicating structural instability during cycling. On the contrary, the lattice parameter for cycled LiNi0.475Al0.05Mn1.475O4 remained almost unchanged from 8.1652 Å to 8.1637 Å. Adoption of Al in the LNMO matrix helped to stabilize the structure during the electrochemical procedure, thereby enhancing the electrochemical performance.
 | ||
| Fig. 12 XRD patterns of the (a) LiNi0.5Mn1.5O4 electrode and (b) LiNi0.475Al0.05Mn1.475O4 electrode in original and cycled states. | ||
Second, the morphology referring to the cycled LiNi0.5Mn1.5O4 electrode and LiNi0.475Al0.05Mn1.475O4 electrode was characterized by SEM (Fig. 13). The pristine LiNi0.5Mn1.5O4 (Fig. 13a and b) and LiNi0.475Al0.05Mn1.475O4 (Fig. 13e and f) materials had a fine and intact spherical shape. However, the particles for LiNi0.5Mn1.5O4 on the cycled electrode (Fig. 13c and d) were broken into irregular spheres with increasing amounts of tiny particles. Few breakages were observed on the cycled particles of the LiNi0.475Al0.05Mn1.475O4 electrode (Fig. 13g and h). These observations offered further proof of the stabilized structure and subsequent improved electrochemical properties by introducing Al in LNMO materials.
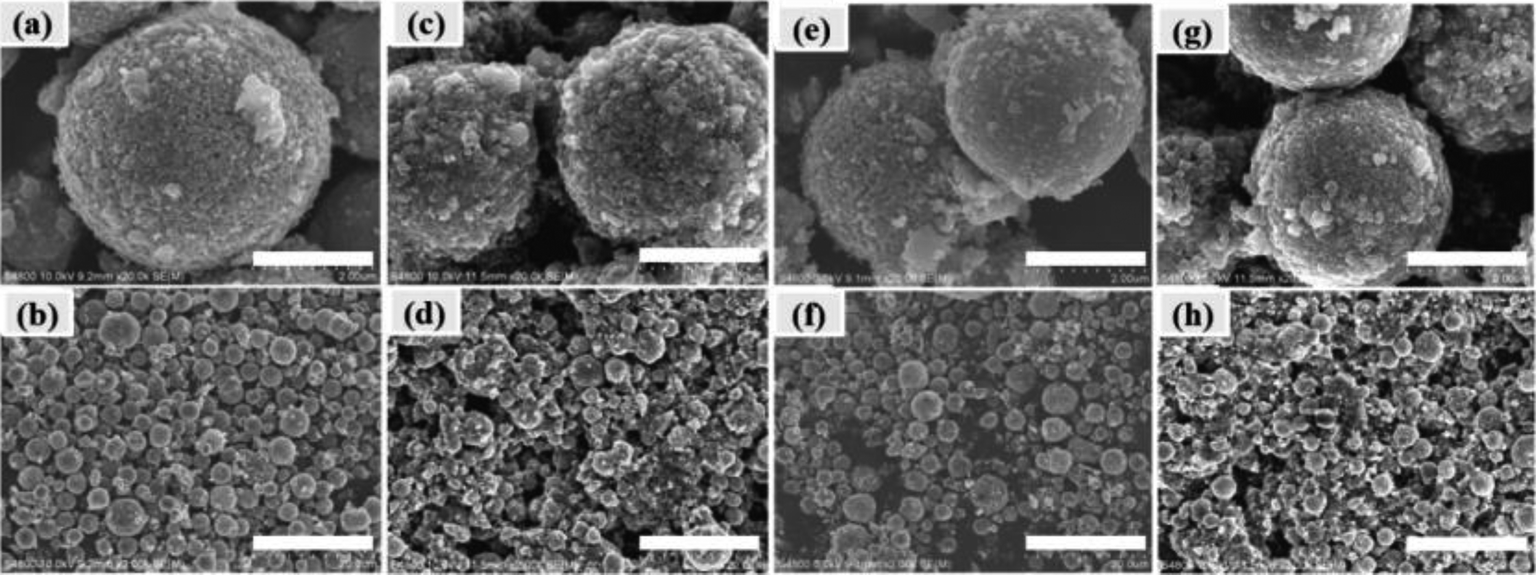 | ||
| Fig. 13 SEM images of pristine LiNi0.5Mn1.5O4 (a and b) and (e and f) LiNi0.475Al0.05Mn1.475O4 materials along with the cycled LiNi0.5Mn1.5O4 electrode (c and d) and (g and h) LiNi0.475Al0.05Mn1.475O4 electrode after 200 cycles at 0.5C. The scale bar for (a), (c), (e) and (g) is 2 μm, and the scale bar for (b), (d), (f) and (h) is 20 μm. | ||
Third, the cycled lithium anodes in LiNi0.5Mn1.5O4 and LiNi0.475Al0.05Mn1.475O4 battery systems were detected by applying SEM and EDS (Fig. S8 and Table S6, ESI†). Some cracks were distributed on the cycled Li anode for LiNi0.5Mn1.5O4, and more Mn was aggregated on the surface (Fig. S8a and b†). The specific content of Mn on the Li metal was 0.52%. Few defects and a small amount of Mn was observed on the Li anode for the battery using the LiNi0.475Al0.05Mn1.475O4 electrode. Also, the Mn content was only 0.35%. The relatively integrated Li morphology implied fewer side-reactions and improved stability. Moreover, less Mn deposited on the Li surface demonstrated limited dissolution of Mn in the electrolyte, and revealed the strengthened structure upon adoption of Al in LNMO materials. Introduction of Al in the pristine spherical LNMO could affect the electron distribution between Mn and O, thereby promoting the binding interaction of O-2p orbitals and Mn-3d orbitals.53 This effect enhanced the structural and electrochemical stability of doped LNMO materials combined with integrated morphology, decreased Mn dissolution, and stable SEI layers.
Conclusions
Spherical LNMO and Al-doped LNMO materials were prepared by rapid precipitation and hydrothermal treatment followed by high-temperature calcination. The practical roles of Al-doping at different sites were studied systematically. The Al content in the LNMO matrix was optimized. Al-doping at Ni sites, Mn sites, and Ni/Mn sites enhanced the cycling and rate performance of LNMO-based cathode materials. The optimal amount of Al at Ni sites, Mn sites, and Ni/Mn sites was 5%, 3% and 5%, respectively. The cycling stability at a high temperature (55 °C) could be improved significantly with a higher capacity and capacity retention ratio. The enhanced electrochemical performance of Al-doped LNMO could be ascribed to the increasing degree of disorder of materials and the content of Mn3+, which increased ion and electron conductivity. The higher bond energy of Al–O also facilitated the structural stabilization of LNMO-based materials, and then reduced the irreversible dissolution of Mn. Therefore, Al-doped LNMO materials with an appropriate Al content at Ni or Mn sites exhibited outstanding performance. We demonstrated a simple and effective method to synthesize LNMO-based cathode materials for high-energy density and power-density LIBs.Conflicts of interest
There are no conflicts to declare.Acknowledgements
This work was supported by the Key Research and Development Program of Shandong Province of China (2018GGX104005) and the Instrument Developing Project of the Chinese Academy of Sciences (YZ201641).Notes and references
- M. Armand and J. M. Tarascon, Nature, 2008, 451, 652–657 CrossRef CAS PubMed
.
- M. S. Whittingham, Chem. Rev., 2004, 104, 4271–4302 CrossRef CAS PubMed
- V. Etacheri, R. Marom, R. Elazari, G. Salitra and D. Aurbach, Energy Environ. Sci., 2011, 4, 3243–3262 RSC
- J. B. Goodenough and K. S. Park, J. Am. Chem. Soc., 2013, 135, 1167–1176 CrossRef CAS PubMed
- X. P. Gao and H. X. Yang, Energy Environ. Sci., 2010, 3, 174–189 RSC
- Y. Luo, Y. X. Zhang, L. Q. Yan, J. Y. Xie and T. L. Lv, ACS Appl. Mater. Interfaces, 2018, 10, 31795–31803 CrossRef CAS PubMed
- B. Aktekin, M. J. Lacey, T. Nordh, R. Younesi, C. Tengstedt, W. Zipprich, D. Brandell and K. Edström, J. Phys. Chem. C, 2018, 122, 11234–11248 CrossRef CAS
- J. T. Fan, T. Dong, D. L. Fang, X. F. Li, X. E. Mo, K. H. Wen, S. M. Chen and S. J. Zhang, Ionics, 2018, 24, 2965–2972 CrossRef CAS
- L. M. Suo, W. J. Xue, M. Gobet, S. G. Greenbaum, C. Wang, Y. M. Chen, W. L. Yang, Y. X. Li and J. Li, Proc. Natl. Acad. Sci. U. S. A., 2018, 115, 1156–1161 CrossRef CAS PubMed
- H. M. Zhou, D. M. Xiao, C. J. Yin, Z. H. Yang, K. W. Xiao and J. Li, J. Electroanal. Chem., 2018, 808, 293–302 CrossRef CAS
- G. J. Xu, C. G. Pang, B. B. Chen, J. Ma, X. Wang, J. C. Chai, Q. F. Wang, W. Z. An, X. H. Zhou, G. L. Cui and L. Q. Chen, Adv. Energy Mater., 2018, 8, 1701398 CrossRef
- H. Y. Yue, Z. L. Han, L. L. Tao, Y. F. Zhang, L. Wang, X. N. Li, Y. H. Yin, W. G. Yang and S. T. Yang, ChemElectroChem, 2018, 5, 1509–1515 CrossRef CAS
- J. W. Liu, X. Song, L. Zhou, S. Q. Wang, W. Liu, H. L. Long, L. X. Zhou, H. M. Wu, C. Q. Feng and Z. P. Guo, Nano Energy, 2018, 46, 404–414 CrossRef CAS
- W. Q. Tu, C. C. Ye, X. R. Yang, L. D. Xing, Y. H. Liao, X. Liu and W. S. Li, J. Power Sources, 2017, 364, 23–32 CrossRef CAS
- X. J. Luo, J. Alloys Compd., 2018, 730, 23–30 CrossRef CAS
- C. Liu, M. M. Wu, Y. Liu, Z. P. Lu, Y. Yang, S. J. Shi and G. Yang, Mater. Res. Bull., 2018, 99, 436–443 CrossRef CAS
- Y. Cai, S. Z. Huang, F. S. She, J. Liu, R. L. Zhang, Z. H. Huang, F. Y. Wang and H. E. Wang, RSC Adv., 2016, 6, 2785–2792 RSC
- Y. Lee, J. Mun, D. W. Kim, J. K. Lee and W. Choi, Electrochim. Acta, 2014, 115, 326–331 CrossRef CAS
- E. Q. Zhao, W. Liu, Y. D. Guo, Y. J. Xu, W. C. Yan, D. Y. Sun and Y. C. Jin, J. Alloys Compd., 2017, 695, 3393–3401 CrossRef CAS
- G. Y. Liu, X. Kong, H. Y. Sun, B. S. Wang, Z. Z. Yi and Q. B. Wang, Electrochim. Acta, 2014, 141, 141–148 CrossRef CAS
- D. S. Lu, L. B. Yuan, Z. X. Chen, R. H. Zeng and Y. P. Cai, J. Alloys Compd., 2018, 730, 509–515 CrossRef CAS
- X. L. Su, J. Y. Liu, C. C. Zhang, T. Huang, Y. G. Wang and A. S. Yu, RSC Adv., 2016, 6, 107355–107363 RSC
- J. F. Wang, X. Qin, J. L. Guo, M. S. Zhou, B. Zong, L. Wang and G. C. Liang, Dalton Trans., 2018, 47, 7333–7343 RSC
- S. X. Deng, D. L. Mao, H. Wang, B. Wang, J. B. Liu, Y. L. Ma and H. Yan, RSC Adv., 2016, 6, 45369–45375 RSC
- W. K. Pang, H. F. Lin, V. K. Peterson, C. Z. Lu, C. E. Liu, S. C. Liao and J. M. Chen, J. Phys. Chem. C, 2017, 121, 3680–3689 CrossRef CAS
- F. Ma, F. S. Geng, A. B. Yuan and J. Q. Xu, Phys. Chem. Chem. Phys., 2017, 19, 9983–9991 RSC
- C. C. Zhang, X. Y. Liu, Q. L. Su, J. H. Wu, T. Huang and A. S. Yu, ACS Sustainable Chem. Eng., 2017, 5, 640–647 CrossRef CAS
- R. L. Patel, S. A. Palaparty and X. H. Liang, J. Electrochem. Soc., 2017, 164, A6236–A6243 CrossRef CAS
- J. R. Mou, Y. L. Deng, L. H. He, Q. J. Zheng, N. Jiang and D. M. Lin, Electrochim. Acta, 2018, 260, 101–111 CrossRef CAS
- J. Chong, J. P. Zhang, H. M. Xie, X. Y. Song, G. Liu, V. Battaglia, S. D. Xun and R. S. Wang, RSC Adv., 2016, 6, 19245–19251 RSC
- Y. P. Li, Q. Zhang, T. H. Xu, D. D. Wang, D. Pan, H. L. Zhao and Y. Bai, Ceram. Int., 2018, 44, 4058–4066 CrossRef CAS
- Y. L. Deng, L. H. He, J. Ren, Q. J. Zheng, C. G. Xu and D. M. Lin, Mater. Res. Bull., 2018, 100, 333–344 CrossRef CAS
- J. Wang, P. Nie, J. M. Jiang, Y. T. Wu, R. R. Fu, G. Y. Xu, Y. D. Zhang, H. Dou and X. G. Zhang, ChemElectroChem, 2018, 5, 1212–1218 CrossRef CAS
- N. Pereira, M. C. Ruotolo, M. Y. Lu, F. Badway and G. G. Amatucci, J. Power Sources, 2017, 338, 145–154 CrossRef CAS
- Y. K. Sun, S. W. Oh, C. S. Yoon, H. J. Bang and J. Prakash, J. Power Sources, 2006, 161, 19–26 CrossRef CAS
- J. Wang, W. Q. Lin, B. H. Wu and J. B. Zhao, Electrochim. Acta, 2014, 145, 245–253 CrossRef CAS
- J. Molenda, J. Marzec, K. Świerczek, D. Pałubiak, W. Ojczyk and M. Ziemnicki, Solid State Ionics, 2004, 175, 297–304 CrossRef CAS
- E. S. Lee and A. Manthiram, J. Mater. Chem. A, 2013, 1, 3118–3126 RSC
- K. R. Chemelewski and A. Manthiram, J. Phys. Chem. C, 2013, 117, 12465–12471 CrossRef CAS
- U. Lafont, C. Locati, W. J. H. Borghols, A. Łasińska, J. Dygas, A. V. Chadwick and E. M. Kelder, J. Power Sources, 2009, 189, 179–184 CrossRef CAS
- F. U. Okudur, J. D'Haen, T. Vranken, D. D. Sloovere, M. Verheijen, O. M. Karakulina, A. M. Abakumov, J. Hadermann, M. K. V. Bael and A. Hardy, RSC Adv., 2018, 8, 7287–7300 RSC
- J. Yoon, M. Jeong, I. T. Bae, K. W. Nam and W. S. Yoon, J. Power Sources, 2017, 368, 1–10 CrossRef CAS
- J. S. Chae, M. R. Jo, Y. I. Kim, D. W. Han, S. M. Park, Y. M. Kang and K. C. Roh, J. Ind. Eng. Chem., 2015, 21, 731–735 CrossRef CAS
- W. Wu, X. Qin, J. L. Guo, J. F. Wang, H. Y. Yang and L. Wang, J. Rare Earths, 2017, 35, 887–895 CrossRef CAS
- S. Vijayan, B. Kirubasankar, P. Pazhamalai, A. K. Solarajan and S. Angaiah, ChemElectroChem, 2017, 4, 2059–2067 CrossRef CAS
- M. Y. Mo, K. S. Hui, X. T. Hong, J. S. Guo, C. C. Ye, A. J. Li, N. Q. Hu, Z. Z. Huang, J. H. Jiang, J. Z. Liang and H. Y. Chen, Appl. Surf. Sci., 2014, 290, 412–418 CrossRef CAS
- J. Wang, P. Nie, G. Y. Xu, J. M. Jiang, Y. T. Wu, R. R. Fu, H. Dou and X. G. Zhang, Adv. Funct. Mater., 2018, 28, 1704808 CrossRef
- Y. Luo, T. L. Lu, Y. X. Zhao, L. Q. Yan, S. S. Mao and J. Y. Xie, J. Alloys Compd., 2017, 703, 289–297 CrossRef CAS
- G. B. Zhong, Y. Y. Wang, Z. C. Zhang and C. H. Chen, Electrochim. Acta, 2011, 56, 6554–6561 CrossRef CAS
- G. B. Zhong, Y. Y. Wang, X. J. Zhao, Q. S. Wang, Y. Yu and C. H. Chen, J. Power Sources, 2012, 216, 368–375 CrossRef CAS
- Y. Shu, W. C. Yan, H. S. Wang, J. C. Jiang, D. Y. Sun, X. D. Ma and Y. C. Jin, Crystals, 2017, 7, 275 CrossRef
- J. H. Kim, C. S. Yoon, S. T. Myung, J. Prakash and Y. K. Sun, Electrochem. Solid-State Lett., 2004, 7, A216–A220 CrossRef CAS
- J. J. Feng, Z. P. Huang, C. Guo, N. A. Chernova, S. Upreti and M. S. Whittingham, ACS Appl. Mater. Interfaces, 2013, 5, 10227–10232 CrossRef CAS PubMed
- P. Strobel, A. I. Palos, M. Anne, C. Poinsignon and A. Crisci, Solid State Sci., 2003, 5, 1009–1018 CrossRef CAS
- L. Wang, H. Li, X. Huang and E. Baudrin, Solid State Ionics, 2011, 193, 32–38 CrossRef CAS
- J. Y. Piao, Y. G. Sun, S. Y. Duan, A. M. Cao, X. L. Wang, R. J. Xiao, X. Q. Yu, Y. Gong, L. Gu, Y. T. Li, Z. J. Liu, Z. Q. Peng, R. M. Qiao, W. L. Yang, X. Q. Yang, J. B. Goodenough and L. J. Wan, Chem, 2018, 4, 1685–1695 CAS
Footnotes |
| † Electronic supplementary information (ESI) available. See DOI: 10.1039/c9ra00374f |
| ‡ These authors contributed equally to this work. |
| This journal is © The Royal Society of Chemistry 2019 |