 Open Access Article
Highly fluorescent carbon dots as an efficient nanoprobe for detection of clomifene citrate†
Yi Zhangab,
Zhiyong Gao *a,
Xue Yangb,
Genqing Yangc,
Jiuli Changa and
Kai Jiang*ad
aSchool of Chemistry and Chemical Engineering, Henan Normal University, Henan, Xinxiang 453007, P. R. China. E-mail: zygao512@163.com; kjiang512@163.com; Fax: +86 373 3326335; Fax: +86 373 3328629; Tel: +86 373 3326335 Tel: +86 373 3328629
bSchool of Laboratory Medicine, Xinxiang Medical University, Henan, Xinxiang 453003, P. R. China
cThe Third Affiliated Hospital of Xinxiang Medical University, Henan, Xinxiang 453000, P. R. China
dSchool of Environment, Henan Normal University, Henan, Xinxiang 453007, P. R. China
First published on 19th February 2019
Abstract
Highly fluorescent carbon dots (CDs) were synthesized through facile hydrothermal carbonization and ethylenediamine passivation of an easily available prawn shell precursor. The as-prepared CDs exhibit high water solubility, wavelength-tunable fluorescence with quantum yield up to 68.9%, high photostability and resistance against biomolecules, thus enabling the application as viable fluorescent nanoprobes for detection of guest quenchers. The fluorescence of the CDs can be effectively quenched by clomifene citrate (CC, a common drug for infertility) through static quenching, and therefore can serve as a simple and efficient fluorescent nanoprobe for determination of CC with wide linear range (0.25–10 μg mL−1) and low detection limit (0.2 μg mL−1). The CDs also showed low cytotoxicity, which enables the safe and accurate fluorescent detection of spiked CC in human serum, demonstrating their potential as a credible fluorescent CC nanoprobe in clinical examination.
Introduction
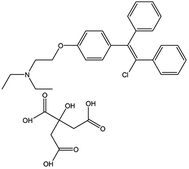
Infertility and sterility are currently acknowledged as the third most serious disease in the clinic next to cancer and cardiovascular diseases, which directly disturb the happiness of many families and sustainable population development. Clomifene citrate (2-[4-(2-chloro-1,2-diphenylethenyl)phenoxy]-N,N-diethyl-ethanamine, 2-hydroxy-1,2,3-propanetricarboxylate (1![[thin space (1/6-em)]](https://www.rsc.org/images/entities/char_2009.gif) :
:![[thin space (1/6-em)]](https://www.rsc.org/images/entities/char_2009.gif) 1), CC, Fig. 1) is the first and the most widely used pharmaceutical capable of promoting ovulation in female patients with polycystic ovary syndrome and therefore treating infertility.1,2 However, a lot of clinical reports have shown that an excessive dosage of CC in the human body also causes ovarian hyperstimulation syndrome and luteinized unruptured follicle syndrome. Hence, the sensitive and reliable monitoring of CC is crucial in the clinic. However, as far as we know, only few techniques, including fluorescent determination,3 resonance Rayleigh scattering4 and UV-spectrophotometry5 were recorded for determination of CC. In this scenario, the further seeking of cost-effective and reliable analysis methods for quantitative detection of CC is meaningful for definite diagnosis and further the therapy of adverse effects caused by inappropriate doses.
1), CC, Fig. 1) is the first and the most widely used pharmaceutical capable of promoting ovulation in female patients with polycystic ovary syndrome and therefore treating infertility.1,2 However, a lot of clinical reports have shown that an excessive dosage of CC in the human body also causes ovarian hyperstimulation syndrome and luteinized unruptured follicle syndrome. Hence, the sensitive and reliable monitoring of CC is crucial in the clinic. However, as far as we know, only few techniques, including fluorescent determination,3 resonance Rayleigh scattering4 and UV-spectrophotometry5 were recorded for determination of CC. In this scenario, the further seeking of cost-effective and reliable analysis methods for quantitative detection of CC is meaningful for definite diagnosis and further the therapy of adverse effects caused by inappropriate doses.
Fluorescence probe technique owns high sensitivity and superior spatiotemporal resolutions, therefore can be widely adopted in ion detection,6,7 food chemistry,8 environment analyses9 and targeted antibacterial research10 through the fluorescence quenching interactions between fluorophores and guest quenchers. However, the fluorescent probe for quantitative analysis of CC is rarely reported,3 so the construction of efficient fluorescent probe for CC detection is meaningful in practice. The water soluble fluorescent materials are significant basis for fluorescent nanoprobes, conventional semiconductor quantum dots and fluorescent dyes commonly have to confront with the difficulty in synthesis, chemical-instability, photobleaching and physiological toxicity.11 Consequently, it is essential to seek for easily available, safe and reliable fluorescent materials for CC detection.
Carbon dots (CDs) represent a new category of 0 dimensional fluorescent nanomaterials enriched with surface functionalities and structural defects. Since the first discovery in 2004,12 the last decade have witnessed the flourish of CDs in drug delivery,13,14 bioimaging,14–16 photocatalysis,17 sensing,18–22 photochemical energy storage23 and light-emitting devices.24 Compared with conventional fluorescent organics and semiconductor quantum dots, CDs hold a series of merits including excellent photostability, tunable emission wavelength, good water-solubility, easy surface functionalization and low cytotoxicity. Especially, CDs have been widely employed as alternative fluorescent nanoprobes for quantitative determination of analytes by virtue of their superior optical properties and the enriched surface functional groups.
Generally, the CDs can be prepared through “top-down” and “bottom-up” pathways. The former approach includes the physical, chemical and electrochemical ablation of carbon motif.25–27 But this approach involves complicated equipments and harsh reaction conditions. In contrast, the “bottom-up” avenue can more easily generate CDs through carbonization of organics.28–30 Hydrothermal synthesis is the most facile “bottom-up” method for production of CDs. A wide range of easily available natural biomass, such as fish scales,31 vegetables,32,33 milk34 and even wastes35–37 were widely employed as precursor for cost-effective preparation of fluorescent CDs by hydrothermal treatments. The further doping of heteroatoms into the carbonaceous framework and the surface passivation can substantially enhance the fluorescence activity of CDs,38,39 if the heteroelement doping and passivation can be proceeded simultaneously, highly fluorescent CDs can be prepared more facilely. Prawn shell is a commonly discarded food waste containing rich proteins, dyes and chitin ingredients, which can serve as C and N sources toward CDs, the surface passivation by amino terminated alkane chains can further stabilize the emissive energy traps and improve the defects associated fluorescence property, hence, high fluorescence activity can be harvested, which enables the application as efficient fluorescent CC nanoprobe.
Herein, prawn shell was attempted as precursor for preparation of CDs assisted by ethylenediamine passivation. Fortunately, water-soluble fluorescent CDs with distinct quantum yield, low cytotoxicity, robust resistance against photobleaching and ion strength were yielded by a facile hydrothermal treatment. The fluorescence of CDs can be efficiently quenched by CC via static quenching rationale, which enables the fluorescent sensing of CC with good anti-interference ability against common biomolecules. The CDs based fluorescent CC probe exhibited a linear range of 0.25–10 μg mL−1, low detection limit of 0.20 μg mL−1, and high recoveries in spiked human serum samples, showing the potential for CC determination in clinical CC assay.
Experimental
Reagents
CC was commercially obtained from Sigma-Aldrich. Aqueous CC stock solution (50 μg mL−1) was prepared and then kept at 4 °C in the dark. 3-(4,5-Dimethyl-2-thiazoyl)-2,5-diphenyltetrazolium bromide (MTT, 98%) was purchased from Alfa Aesar. Common inorganic ions and biological molecules solutions were prepared using deionized water as solvent. All the other reagents were of analytical grade and were directly used as received. A series of buffer solutions with pH range of 3–11 were prepared to evaluate the effect of acidity on the fluorescent activity.Preparation of CDs
Fresh prawn was purchased from the local supermarket (Xinxiang, China), the prawn shell was peeled off, washed, dried and smashed into powder and used as precursor for CDs. Thereafter, 0.5 g of prawn shell powder and 0.1 mL ethylenediamine were ultrasonically dispersed in 50 mL of deionized water and then transferred into a 100 mL Teflon-lined stainless-steel autoclave for hydrothermal reaction at 220 °C for 4 h. The afforded brown dispersion was centrifuged at 3000 rpm for 15 min to obtain clear supernatant, which was then transferred into a dialysis bags (molecular weight cutoff of 3500 Da) and dialyzed against deionized water for two days to eliminate the possible mineral ions. The purified CDs solution was filtered by a 0.22 μm millipore cellulose membrane and then lyophilized. The afforded dark grown solid CDs sample is highly hydrophilic and can easily adsorb moisture to form sticky slurry. An aqueous CDs suspension with concentration of 10 mg mL−1 was prepared for dilution treatment in the subsequent spectroscopic characterizations and fluorescence tests.Characterizations
The size and microstructure of the CDs were characterized by high resolution transmission electronic microscopy (HRTEM, JEOL JEM 2100). The phase and chemical status were characterized by X-ray powder diffraction (XRD, Bruker D8 diffractometer with Cu Kα radiation), Fourier transform infrared spectroscopy (FTIR, Thermo Nicolet FTS NEXUS, the sample was pressed in KBr pellet) and X-ray photoelectron spectroscopy (XPS, ESCALAB250, Thermo, UK).UV-Vis absorption spectra and fluorescence spectra of the aqueous CDs solutions were recorded on TU-1810 spectrophotometer (Beijing Purkinje General Instrument Co. Ltd) and fluorescence spectrometer (Varian, CARY Eclipse). The relative fluorescence quantum yield (QY) of CDs was calculated using quinine sulfate dissolved in 0.1 M H2SO4 as a standard (QY = 54%).40 Fluorescence lifetime of CDs solution was measured using a FlS-980 fluorescence spectrometer (Edinburgh Instrument, UK).
Procedure for CC detection
Unless specified otherwise, the basic test conditions for determination of CC were shown as follows: CDs stock dispersion (10 mg mL−1) and a given volume of CC standard stock solution were rapidly mixed in a 10 mL vial, followed by the addition of 0.5 mL of KH2PO4–NaOH buffer solution to maintain a given pH of 7.4. Then, the mixture was diluted to 10 mL to afford CDs–CC system with final CDs concentration of 125 μg mL−1 and CC concentration of 0.25–10 μg mL−1. After being shaken for 5 min, fluorescence emission spectra were recorded at excitation wavelength (λex) of 320 nm with slit width of 10 nm. The interferences of inorganic ions and biomolecules were monitored by the variations in fluorescence emission intensities of CDs in presence of interferents.Cell toxicity
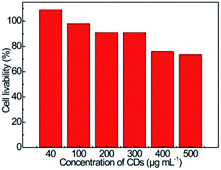
PC-12 cell (pheochromocytoma of the rat adrenal medulla) was employed to evaluate the cytotoxicity of CDs. In brief, PC-12 cells were cultured in Dulbecco's modified Eagle's medium (DMEM) (Gibco, USA) containing 5% fetal bovine serum (FBS) (Gibco, USA) under 5% CO2 atmosphere at 37 °C. The concentration of the harvested PC-12 cells was adjusted to 5 × 10⁵ cells per well, which were placed in 96 well microtiter plates and incubated with addition of CDs suspensions (100 μL per well) at various concentrations (40, 100, 200, 300, 400 and 500 μg mL−1). After incubation in humidified CO2 atmosphere at 37 °C for 24 h, the viable cells concentration was determined by MTT (3-(4,5-dimethyl-2-thiazoyl)-2,5-diphenyltetrazolium bromide) assay.Results and discussion
Characterization of CDs
Prawn shell contains rich proteins, fatty acid, chitin, organic dyes and other nutritional ingredients, hence it can serve as C, N sources for preparation of carbonaceous materials.41,42 Given the fact that a wide range of biomass can be converted into CDs by controlled thermal reaction, prawn shell was attempted as precursor for preparation of CDs, the synthesis procedure was summarized in Fig. 2a. Undergoes hydrothermal treatment, the partial hydrolytic cleavage, dehydrogenation and dehydroxylation of the polymer chains of proteins, fatty acids and chitins generate reactive radical intermediates, which experience condensation/polymerization and rearrangements to form delocalized aromatic carbon rings, namely the carbonization process, as evidenced by the brownish color of CDs solution. During this carbonization process, the N atoms in the reactive intermediate chains are doped into the carbonaceous framework. Simultaneously, some residual dangling bonds and defects sites with high reactivities are passivated by the terminal amino groups of the introduced ethylenediamine, which can serve as radiative electrons–holes recombination sites sustaining the fluorescence emission. Additionally, some survived polar functionalities endow the as-formed CDs with high hydrophilicity, therefore allows the long term preservation free of precipitation and fluorescence decrement. Some single or double bond containing functionalities can even serve as auxochromes/chromophores assisting the fluorescent emission. Hence, high hydrophilicity and fluorescent activity are possible in this prawn shell derived CDs. To preliminarily attest the fluorescence property, the aqueous CDs solution was exposed to ultraviolet lamp (irradiation wavelength centered at 365 nm), the brilliant bluish fluorescence (Fig. 2a) intuitively manifests the outstanding fluorescence feature.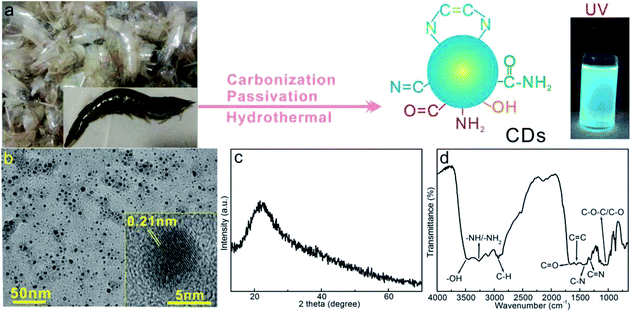 | ||
| Fig. 2 (a) Schematic illustration on the preparation of prawn shell derived CDs, (b) TEM and HRTEM (inset), (c) XRD and (d) FTIR of CDs. | ||
Fig. 2b presents the TEM image of the afforded CDs, which demonstrates well separated nanodots with size ranges from 3 to 9 nm, indicating the successful formation of nano-sized dots by hydrothermal carbonization of prawn shell. Enlarged image (inset) shows discernable fringes with spacing of 0.21 nm indexable to (100) planes of graphic carbon, verifying the formation of aromatic carbon rings by hydrothermal carbonization. The diffraction pattern (Fig. 2b) of solid CDs sample displays a weak and wide brand centered at 21°, which suggest the largely amorphous phase of the prawn shell derived CDs. The less ordered carbonaceous motif leaves plenty of structural defects within the aromatic framework, which facilitates the defects associated fluorescence manner.
Fig. 2d shows the FTIR spectrum of CDs. The characteristic vibration bands around 3510–3390, 3267, 3100 and 2925 cm−1 indicate the coexistence of –OH, –NH2, and ![[double bond, length as m-dash]](https://www.rsc.org/images/entities/char_e001.gif) C–H/–CH functionalities in the CDs,32,43 the absorption peaks at 1667, 1552, 1315 and 1299 cm−1 could be assigned to the C
C–H/–CH functionalities in the CDs,32,43 the absorption peaks at 1667, 1552, 1315 and 1299 cm−1 could be assigned to the C![[double bond, length as m-dash]](https://www.rsc.org/images/entities/char_e001.gif) O/CONH2, C
O/CONH2, C![[double bond, length as m-dash]](https://www.rsc.org/images/entities/char_e001.gif) C, C–N stretching and tertiary C
C, C–N stretching and tertiary C![[double bond, length as m-dash]](https://www.rsc.org/images/entities/char_e001.gif) N stretching vibrations.32,44,45 Additionally, the wide absorption band at 1028 cm−1 is attributable to the stretching vibration of C–O–C/C–O groups around CDs.46 All of these vibrations indicate the presence of multiple N, O functionalities onto the carbonaceous framework, which endow the CDs with high hydrophilicity and enable stable aqueous dispersion, thus facilitates the construction of stable fluorescent nanoprobe for guest analytes.
N stretching vibrations.32,44,45 Additionally, the wide absorption band at 1028 cm−1 is attributable to the stretching vibration of C–O–C/C–O groups around CDs.46 All of these vibrations indicate the presence of multiple N, O functionalities onto the carbonaceous framework, which endow the CDs with high hydrophilicity and enable stable aqueous dispersion, thus facilitates the construction of stable fluorescent nanoprobe for guest analytes.
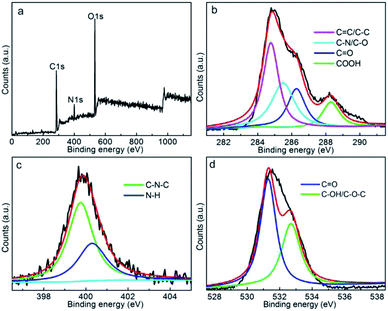
XPS was further employed to identify the chemical status of CDs, the survey spectrum (Fig. 3a) reveals the presence of C, N and O elements within CDs free of other impurities, confirming the carbonaceous motif with doping or decoration of N and O groups. The atomic C![[thin space (1/6-em)]](https://www.rsc.org/images/entities/char_2009.gif) :
:![[thin space (1/6-em)]](https://www.rsc.org/images/entities/char_2009.gif) N
N![[thin space (1/6-em)]](https://www.rsc.org/images/entities/char_2009.gif) :
:![[thin space (1/6-em)]](https://www.rsc.org/images/entities/char_2009.gif) O ratio of 56.7
O ratio of 56.7![[thin space (1/6-em)]](https://www.rsc.org/images/entities/char_2009.gif) :
:![[thin space (1/6-em)]](https://www.rsc.org/images/entities/char_2009.gif) 7.3
7.3![[thin space (1/6-em)]](https://www.rsc.org/images/entities/char_2009.gif) :
:![[thin space (1/6-em)]](https://www.rsc.org/images/entities/char_2009.gif) 36.0 of CDs more concretely evidences the enriched N, O functionalities within/onto carbon motif, which is beneficial for high hydrophilicity. To further identify the chemical bonds information, C1s, N1s and O1s spectra were deconvoluted and fitted. As shown in Fig. 3b, C1s spectrum of CDs mainly includes C
36.0 of CDs more concretely evidences the enriched N, O functionalities within/onto carbon motif, which is beneficial for high hydrophilicity. To further identify the chemical bonds information, C1s, N1s and O1s spectra were deconvoluted and fitted. As shown in Fig. 3b, C1s spectrum of CDs mainly includes C![[double bond, length as m-dash]](https://www.rsc.org/images/entities/char_e001.gif) C/C–C (284.7 eV), C–O/C–N (285.5 eV), C
C/C–C (284.7 eV), C–O/C–N (285.5 eV), C![[double bond, length as m-dash]](https://www.rsc.org/images/entities/char_e001.gif) O (286.3 eV) and COOH (288.3 eV) groups.47 In addition, the N1s spectrum can be fitted into C–N–C (399.7 eV) and N–H bonds (400.3 eV),47 showing the successful incorporation of N element into/onto the carbonaceous framework of CDs. The detailed O1s spectra (Fig. 3d) reveals the decoration of C
O (286.3 eV) and COOH (288.3 eV) groups.47 In addition, the N1s spectrum can be fitted into C–N–C (399.7 eV) and N–H bonds (400.3 eV),47 showing the successful incorporation of N element into/onto the carbonaceous framework of CDs. The detailed O1s spectra (Fig. 3d) reveals the decoration of C![[double bond, length as m-dash]](https://www.rsc.org/images/entities/char_e001.gif) O (531.3 eV) and C–OH/C–O–C (532.6 eV) groups onto carbonaceous framework.48 All these results further suggest the incorporation of abundant N and O groups onto CDs, which not only increase the hydrophilicity, but serve as chromophores/auxochromes reinforcing the fluorescence emission, therefore reinforces the fluorescent activity to some extent.49
O (531.3 eV) and C–OH/C–O–C (532.6 eV) groups onto carbonaceous framework.48 All these results further suggest the incorporation of abundant N and O groups onto CDs, which not only increase the hydrophilicity, but serve as chromophores/auxochromes reinforcing the fluorescence emission, therefore reinforces the fluorescent activity to some extent.49
Optical properties of CDs
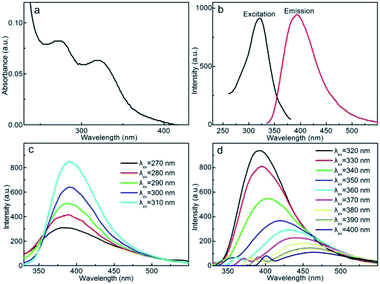
UV-Vis absorption spectrum of CDs solution (125 μg mL−1) includes two characteristic absorption peaks at 270 and 320 nm (Fig. 4a), which are indexed respectively to the π–π* transition of skeletal aromatic carbon rings and the n–π* transition of the double bonds containing C![[double bond, length as m-dash]](https://www.rsc.org/images/entities/char_e001.gif) O and C
O and C![[double bond, length as m-dash]](https://www.rsc.org/images/entities/char_e001.gif) N groups.50,51 The fluorescence property is illustrated in Fig. 4b, the CDs demonstrate an excitation peak at 320 nm and a strong fluorescence emission peaks at 405 nm, showing the distinct fluorescence feature. Fig. 4c and d show the excitation wavelengths (λexs) dependent fluorescence emission behavior of CDs, within the λex range of 270–310 nm (Fig. 4c), the fluorescence emission intensity increases accordingly, but the emission wavelength maintains almost unvaried at 390 nm, this section of λex independent fluorescence emission feature is presumably originated from the double bond containing chromophores such as carbonyl, amide and imine groups,52 the quasi-constant highest occupied molecular orbital-lowest unoccupied molecular orbital energy gap results in the invariable emission wavelength. With further red-shift in λex from 320 to 400 nm (Fig. 4d), the emission intensity decreases gradually with the maximized emission intensity achieves at λex = 320 nm, and the emission wavelength continues red shifting with λex. This portion of λex dependent fluorescence behavior is presumably stemmed from the optical selection of CDs with different surface defect states and particle sizes.53 The dual emission rationales with similar emission wavelength merged together to afford the light blue emission behavior. Using quinine sulfate as a standard, the QY of CDs is estimated to be 68.9% (λex = 320 nm), which is substantially higher over the CDs prepared free of ethylenediamine passivation (QY = 8% at λex = 340 nm), this result highlights the crucial role of passivation treatment, which not only promotes the hydrolysis of prawn shell precursor, but stabilizes the defects sites and facilitates the radiative recombination of excitation state electron–hole pairs, therefore the fluorescence emission is substantially reinforced. The average fluorescence lifetime of the CDs solution is calculated to be 6.74 ns through double-exponential simulation (Fig. S1†), showing the strong fluorescence property as a consequence of the rapid and efficient radiative transition of the surface defect states, band gap and chromophorous groups associated electrons from excitation state to ground state.
N groups.50,51 The fluorescence property is illustrated in Fig. 4b, the CDs demonstrate an excitation peak at 320 nm and a strong fluorescence emission peaks at 405 nm, showing the distinct fluorescence feature. Fig. 4c and d show the excitation wavelengths (λexs) dependent fluorescence emission behavior of CDs, within the λex range of 270–310 nm (Fig. 4c), the fluorescence emission intensity increases accordingly, but the emission wavelength maintains almost unvaried at 390 nm, this section of λex independent fluorescence emission feature is presumably originated from the double bond containing chromophores such as carbonyl, amide and imine groups,52 the quasi-constant highest occupied molecular orbital-lowest unoccupied molecular orbital energy gap results in the invariable emission wavelength. With further red-shift in λex from 320 to 400 nm (Fig. 4d), the emission intensity decreases gradually with the maximized emission intensity achieves at λex = 320 nm, and the emission wavelength continues red shifting with λex. This portion of λex dependent fluorescence behavior is presumably stemmed from the optical selection of CDs with different surface defect states and particle sizes.53 The dual emission rationales with similar emission wavelength merged together to afford the light blue emission behavior. Using quinine sulfate as a standard, the QY of CDs is estimated to be 68.9% (λex = 320 nm), which is substantially higher over the CDs prepared free of ethylenediamine passivation (QY = 8% at λex = 340 nm), this result highlights the crucial role of passivation treatment, which not only promotes the hydrolysis of prawn shell precursor, but stabilizes the defects sites and facilitates the radiative recombination of excitation state electron–hole pairs, therefore the fluorescence emission is substantially reinforced. The average fluorescence lifetime of the CDs solution is calculated to be 6.74 ns through double-exponential simulation (Fig. S1†), showing the strong fluorescence property as a consequence of the rapid and efficient radiative transition of the surface defect states, band gap and chromophorous groups associated electrons from excitation state to ground state.
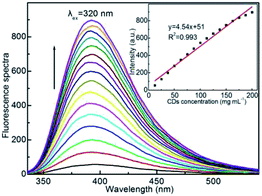
Fig. 5 presents the fluorescence emission spectra of aqueous CDs solutions at different concentrations, under excitation at λex = 320 nm, the fluorescence emission intensity increases accordingly with CDs concentration, and the emission intensity displays fine linearity with concentration of CDs up to 200 μg mL−1 without discernable self-quenching phenomenon (inset). The strong fluorescence behavior enables the application of CDs as fluorescent probe in quantitatively analysis of certain quencher with high sensitivity.
Given the elemental inertness of carbonaceous motif, the resistance against photobleaching is the innate advantage of CDs. To confirm this, the CDs solution was excited at λex = 320 nm for 180 min (Fig. S2†), the almost unvaried emission intensity suggests the good resistance against photobleaching, which allows the yielding of stable emission intensity without worrying about the attenuation caused by irradiation, thus ensures good reliability in fluorescence analysis of guest quenchers. Moreover, the fluorescence stability was also measured in different ions strengths (NaCl solutions with concentration ranges between 0 and 10 mg mL−1) (Fig. S3†), the fluorescence emission intensity of CDs solution is rather stable at different ion strengths, suggesting the high stability against ionic strength. The robust ionic resistance is essential for accurately sensing of analytes in real body fluids or water samples commonly containing electrolyte or mineral components.
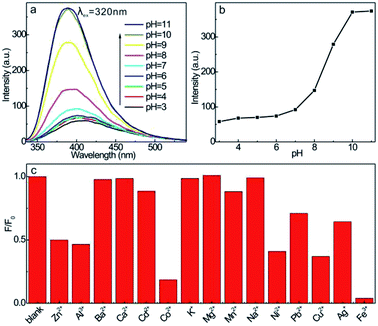
The effect of pH on the fluorescence emission of CDs was investigated over a pH range of 3–11 (Fig. 6a and b). As observed, the fluorescence intensity increases steadily in the of pH range of 4–8, whereas increases substantially in alkali media with slight blue shift in emission wavelength, showing the high fluorescence sensitivity to the alkalinity of medium. The high fluorescence intensity in alkali medium is hypothesized to be originated from the deprotonation of certain chromophorous groups, the higher electron density in the chromophoric functionalities facilitates the more sufficient transition of electrons to excitation state and therefore the more robust fluorescence emission, or the stronger alkali can further passivate the defects associated energy traps, therefore increases the probability of charge separation upon irradiation and therefore reinforces the fluorescence activity. Because the overall emission spectrum is the superimposition of fluorescence emissions with different rationales, the slight variation in emission wavelength is also reasonable. Despite the high fluorescence emission at alkali medium, the corrosive feature of alkali medium will cause the denaturation of biomolecules in body fluids, which is not suitable for noninvasive test in living systems. Given the fact that pH = 7.4 is the physiological medium in human body, this pH medium is the preferable condition for construction of fluorescent nanoprobe for pharmaceutical analysis, so pH = 7.4 is employed as the backing-up medium for the following fluorescence measurements.
In addition, different inorganic ions were introduced into the aqueous CDs solution, the emission intensity maintains unvaried when the main group metal ions such as Na+, K+, Mg2+, Ca2+ (1 μmol mL−1 in concentration) are introduced, these ions can not quench the fluorescence of CDs (Fig. 6c). However, some ions with high ion potentials (e.g. Zn2+, Al3+, Co2+, Ni2+, Cu2+, Fe3+) obviously quench the fluorescence of CDs, which is presumably due to the strong coordination or chelation interactions with the surface functionalities of CDs, the electrons transfer from interfacial coordination groups to metal ions restricts the transition and radiative recombination under excitation. This tendency reminds us that the CDs is not suitable for probing of these inorganic ions for the mutual interferences.
Optimization of assay conditions
Given the acceptable fluorescence emission feature in neutral medium, the strong resistance against photo-bleaching and the ions strength, the aqueous CDs solution is attempted as fluorescent nanoprobe for detection of CC. Fig. 7 illustrates the effect of CDs concentration on fluorescence intensity of CDs–CC system with fixed CC concentration of 7.5 μg mL−1 at λex = 320 nm. The introduction of CC obviously quenches the fluorescence intensity of CDs, showing the robust quenching interaction between CDs and CC. With the increment of CDs concentration in presence of CC, the more apparent decrement in emission intensity indicates that CC dramatically quenches the fluorescence of CDs, which indicates that the fluorescence quenching efficiency is dependent on the CDs concentration. At higher CDs concentration, the quenching extent (ΔF = F0 − F) increases, the more sensitive to CC is mainly due to the more sufficient interaction and energy transfer between CC and CDs. When the CDs concentration increases to 125 μg mL−1, ΔF is the largest. To reach a balance between the sensitivity and the measuring range of the fluorescence spectrophotometer, 125 μg mL−1 was selected as the optimal CDs concentration for CC detection.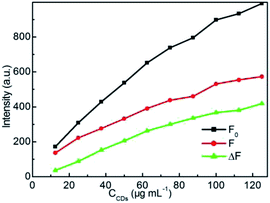 | ||
| Fig. 7 Effect of CDs concentration on fluorescence intensity of CDs–CC system in KH2PO4–NaOH buffer solution at pH = 7.4. CCC: 7.5 μg mL−1. | ||
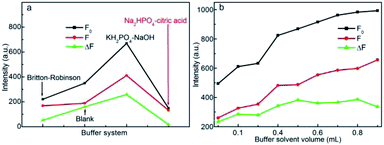
Buffer solution is essential in maintaining a fixed pH value in neutral medium, to check the effect of buffer solution type on the detection of CC, the relative fluorescence intensity of CDs–CC system in 0.5 mL of Britton–Robinson buffer solution, KH2PO4–NaOH buffer solution and Na2HPO4–citric acid buffer solution with the same pH value of 7.4 were compared. From Fig. 8a, the KH2PO4–NaOH buffer solution system displays the highest fluorescence intensities, and the largest ΔF also indicates that the KH2PO4–NaOH is the optimal buffer medium for fluorescent CC detection. The effect of KH2PO4–NaOH buffer solution concentration on the ΔF of CDs–CC system was also investigated, as shown in Fig. 8b, the fluorescence intensities of CDs and CDs–CC system change gently in the range of 0.1–1.0 mL, whereas the ΔF is the largest in 0.5 mL buffer system, so 0.5 mL of KH2PO4–NaOH buffer solution was selected as optimal dosage for CC detection. Based on the abovementioned optimization trials, the CDs concentration of 125 μg mL−1 in 0.5 mL of KH2PO4–NaOH buffer solution at pH = 7.4 was used as optional medium for detection of CC. The fluorescence spectra of CDs–CC system were recorded by eleven parallel trials. The almost unvaried emission intensities and the 0.3% relative standard deviation (RSD) in emission intensity evidence the good reproducibility of CDs based fluorescence nanoprobe for practical CC analysis (Fig. S4†).
Calibration curve and detection limit
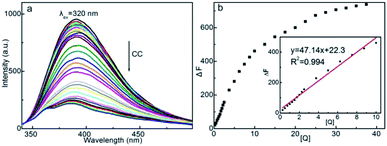
The fluorescence emission spectra of CDs solution (125 μg mL−1) at different CC concentrations were determined at λex = 320 nm (Fig. 9a). CC dramatically quenches the intrinsic fluorescence of CDs without altering the emission wavelength. The efficient quenching effect suggests the high affinity between CC and the chromophorous site of CDs, the change in chemical microenvironment of CDs inhibits the fluorescent emission. The emission intensity reduces accordingly with CC concentration, showing the feasibility of CDs as credible fluorescent nanoprobe for quantitative detection of CC. From Fig. 9b, the fluorescence intensity of CDs–CC system varies linearly with the concentration of CC within 0.25–10 μg mL−1. The regression equation can be fitted as: ΔF = 47.14[Q] + 22.3 (μg mL−1) with correlation coefficient of 0.994 (n = 16) and a detection limit of 0.20 μg mL−1 (n = 11). To be noted, the linear range is comparable to the traditional method, such as lanthanide complex based fluorescent probe (linear range of 1–18 μg mL−1 and detection limit of 0.3 μg mL−1),3 whereas slightly inferior to the nuclear fast red and SDBS associated resonance Rayleigh scattering spectrometry (0.25–20 μg mL−1 and detection limit of 0.03 μg mL−1),4 showing the applicability of the CDs based fluorescence nanoprobe for determination of CC.Tolerance to interference substances
The effects of amino acids and common saccharides on the fluorescent intensity of CDs–CC system were also evaluated. As shown in Table 1, the fluorescence intensity of CDs–CC system changes slightly upon introduction of foreign biomolecules and common inorganic ions. From the pharmacokinetics perspective, the reduction of the fluorescence intensity in the presence of foreign substances will shorten the storage time of CDs–CC in actual blood sample. Hence, the negligible interferences from these interferents imply that the fluorescent nanoprobe can be potentially used for CC detection in practical body fluid samples with high stability.| Foreign substances | Concentration (mmol L−1) | Relative error (%) | Foreign substances | Concentration (mmol L−1) | Relative error (%) |
|---|---|---|---|---|---|
| a Conditions: CCDs: 125 μg mL−1, CCC: 8.75 μg mL−1, pH = 7.4. | |||||
| Starch | 1 | −1.4 | DL-Methionine | 1 | −2.8 |
| Fructose | 1 | −3.1 | DL-Proline | 1 | −3.4 |
| DL-Aspartic | 1 | −1.6 | DL-Lysine | 1 | −2.1 |
| L-Lysine | 1 | −2.3 | Phenylalanine | 1 | −2.5 |
| Tryptophan | 1 | −1.6 | Arginine | 1 | −2.0 |
| DL-Leucine | 1 | −2.7 | L-Leucine | 1 | −1.4 |
| L-Arginine | 1 | −3.1 | Tyrosine | 1 | −3.1 |
| L-Methionine | 1 | −1.2 | Ca2+, Cl− | 1 | −4.1 |
| DL-Threonine | 1 | −2.3 | Mg2+, SO42− | 1 | −4.1 |
| Glycine | 1 | −1.2 | K+, Cl− | 1 | −2.6 |
Fluorescence quenching mechanism
Generally, the fluorescence quenching mechanisms by colorless quenchers can be basically classified into static quenching and dynamic quenching. In the case of static quenching, the fluorophores and quencher form ground state complex or adduct, the interaction between them does not change the chemical structure and activity of fluorophore. Whereas for dynamic quenching, the resonance energy transfer through collision or aromatic stacking interaction restricts the fluorescence of fluorophore. To get insight into the fluorescence quenching mechanism by CC, time resolved fluorescence spectra of CDs solution and the CDs–CC system were compared, from Fig. S1,† the fluorescence decay profiles of the two solutions are almost fully overlapped, both of which follow double-exponential decay kinetics, the average fluorescence lifetimes of CDs (6.74 ns) and CDs–CC system (6.89 ns) are similar, which preliminarily indicates the static quenching interaction between CDs and CC.54 The fluorescence emission intensities of the CDs–CC system at different CC concentrations were further analyzed according to Stern–Volmer equation (eqn (1)) at 298 K.55
 | (1) |
![[thin space (1/6-em)]](https://www.rsc.org/images/entities/char_2009.gif) :
:![[thin space (1/6-em)]](https://www.rsc.org/images/entities/char_2009.gif) τ0 ratio. This value is 4 order of magnitude higher over the limiting diffusion constant Kdif of the biomolecule (Kdif = 2.0 × 10¹⁰ L mol−1 s−1),56 which suggests that the fluorescence quenching was caused by specific interaction with CC quencher. It is envisioned that the hydrogen bonds between the enriched –OH, –NH2, C
τ0 ratio. This value is 4 order of magnitude higher over the limiting diffusion constant Kdif of the biomolecule (Kdif = 2.0 × 10¹⁰ L mol−1 s−1),56 which suggests that the fluorescence quenching was caused by specific interaction with CC quencher. It is envisioned that the hydrogen bonds between the enriched –OH, –NH2, C![[double bond, length as m-dash]](https://www.rsc.org/images/entities/char_e001.gif) O/CONH2 groups in CDs and the carboxyl/hydroxyl groups in CC, as well as the polar interactions between them form stable electrons donor–acceptor adducts, the efficient energy transfer statically quenches the fluorescence of CDs.
O/CONH2 groups in CDs and the carboxyl/hydroxyl groups in CC, as well as the polar interactions between them form stable electrons donor–acceptor adducts, the efficient energy transfer statically quenches the fluorescence of CDs.
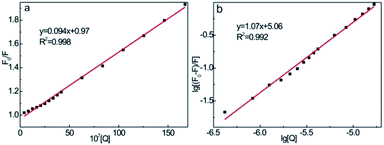 | ||
| Fig. 10 Stern–Volmer curves (a) and logarithmic plots (b) of CDs–CC system with CC concentration range of 0.25–10 μg mL−1. CCDs: 125 μg mL−1, pH = 7.4. | ||
In the case of static quenching process, the number of binding site (n) and the binding constant (K) can be obtained according to eqn (2) (Fig. 10b):57
 | (2) |
The binding constant K was estimated to be 1.2 × 10⁵ L mol−1 from the intercept, and the number of binding site was obtained to be 1.07 (R2 = 0.996) according to the slope. The high binding affinity of CDs to CC suggests the formation of stable CDs–CC adducts, which enables the efficient energy transfer and quenching interaction.
Cell viability
The cytotoxicity of CDs was assessed by the MTT assay using PC-12 cells as representative model, as shown in Fig. 11, over 90% of the PC-12 cells remain alive after being incubated at CDs concentration of 200 μg mL−1 for 24 h, even at CDs concentration up to 500 μg mL−1, over 70% of the cells can still survive, the low cytotoxicity of CDs basically conform to the security requirement as fluorescent nanoprobe for detection of CC in practical body fluid samples.Detection of LH in serum samples
In order to verify the applicability and reliability of the proposed fluorescent CDs nanoprobe for detection of CC pharmaceutical in practical medium, different concentrations of CC tablets (dissolved in deionized water) and reagent were spiked into different media, as shown in Table 2, the spiked CC tablet sample in deionized water with different concentrations can be detected by the CDs based fluorescent nanoprobe with recoveries of 96–104% and relative standard deviations (RSDs) less than 5% over 6 parallel trials, which imply that the additive components in tablet do not hamper the detection of CC by our CDs nanoprobe. Moreover, different concentrations of CC reagent were also spiked into different human serum samples (provided by the local hospital), and 96–106% of them can be found by the CDs fluorescent nanoprobe with RSD lower than 5% (n = 6), which attest the applicability of the proposed fluorescent probe for accurate determination of CC pharmaceutical in practical body fluids. The fluorescent CDs sensing platform can also be applied for detection of spiked CC reagent in different aquatic media (lake water, tap water, and well water in Xinxiang city, filtrated through a 0.22 μm millipore membrane) with the similar recoveries (93–108% recoveries), further manifest the applicability of the CDs based fluorescence nanoprobe for CC analyses in real water samples. Given the facile and cost-effective CDs preparation method, the low detection limit for CC determination, as well as the excellent recoveries in human serum, the CDs based fluorescent nanoprobe is a feasible method for selective detection of CC in pharmaceutical industry and diagnostics.| Analyte | Medium | CC concentration (μg mL−1) | Recovery (%) | RSD (%, n = 6) | |
|---|---|---|---|---|---|
| Added | Found | ||||
| a The number in CC tablet represents the drugs with different batch numbers produced by CODAL SYNTO LTD. Cyprus.b The number in human serum indicates the serum is taken from different individuals. | |||||
| aCC tablet 1 | Deionized water | 2.5 | 2.60 | 104 | 4.8 |
| 5.0 | 5.17 | 104 | 4.1 | ||
| 7.5 | 7.18 | 96 | 2.9 | ||
| CC tablet 2 | Deionized water | 2.5 | 2.58 | 103 | 3.4 |
| 5.0 | 4.95 | 99 | 4.5 | ||
| 7.5 | 7.26 | 97 | 3.5 | ||
| CC reagent | bHuman serum 1 | 2.5 | 2.64 | 106 | 2.9 |
| 5.0 | 5.09 | 102 | 2.1 | ||
| 7.5 | 7.2 | 96 | 1.5 | ||
| Human serum 2 | 2.5 | 2.63 | 105 | 4.0 | |
| 5.0 | 5.05 | 101 | 4.7 | ||
| 7.5 | 7.17 | 96 | 3.2 | ||
| Human serum 3 | 2.5 | 2.58 | 103 | 1.9 | |
| 5.0 | 5.23 | 105 | 1.4 | ||
| 7.5 | 7.43 | 99 | 1.0 | ||
| CC reagent | Lake water | 2.5 | 2.69 | 108 | 5.1 |
| 5.0 | 4.85 | 97 | 2.6 | ||
| 7.5 | 6.96 | 93 | 1.7 | ||
| Tap water | 2.5 | 2.65 | 106 | 4.2 | |
| 5.0 | 5.16 | 103 | 1.2 | ||
| 7.5 | 7.43 | 99 | 1.8 | ||
| Well water | 2.5 | 2.59 | 104 | 4.7 | |
| 5.0 | 4.95 | 99 | 2.8 | ||
| 7.5 | 7.07 | 94 | 3.0 | ||
Conclusions
In summary, CDs with robust fluorescence feature were prepared by ethylenediamine assisted hydrothermal treatment of prawn shells, the afforded CDs demonstrated strong fluorescence emission with QY of 68.9%, robust resistance against photobleaching and ion strength, interferential biomolecules, which enable the application as fluorescence nanoprobe for quantitative detection of CC pharmaceutical with a wide linear range, low detection limit and strong anti-interference ability through static quenching interaction. The current work provides a cost-effective and reliable way to accurately determine CC pharmaceutical.Conflicts of interest
There are no conflicts to declare.Acknowledgements
This work was financially supported by NSFC (No. 21671059 and 51802084), Program for Innovative Research Teams in University of Henan Province (No. 18IRTSTHN002 and 18IRTSTHN003), 111 Project (No. D17007), Henan Center for Outstanding Overseas Scientists (No. GZS2018003) and Youth Fund of Henan Normal University (2017QK12).References
- S. Palomba, A. Falbo and F. Zullo, Curr. Opin. Obstet. Gynecol., 2009, 21, 465–473 CrossRef PubMed.
- N. S. Weiss, M. J. Nahuis, E. Bordewijk, J. E. Oosterhuis, J. M. J. Smeenk, A. Hoek, F. J. M. Broekmans, K. Fleischer, J. Peter de Bruin, E. M. Kaaijk, J. S. E. Laven, D. J. Hendriks, M. H. Gerards, I. A. J. van Rooij, P. Bourdrez, J. Gianotten, C. Koks, C. B. Lambalk, P. G. Hompes, F. van der Veen, B. W. J. Mol and M. van Wely, Lancet, 2018, 391, 758–765 CrossRef CAS.
- D. I. Alekscandrovaa, A. V. Egorovaa, Y. V. Skripinetsa, V. P. Antonovicha and I. V. Ukrainetsb, J. Anal. Chem., 2009, 64, 705–713 CrossRef.
- S. L. Feng and L. M. Guo, J. Anal. Chem., 2009, 64, 910–915 CrossRef CAS.
- Pharmacopoeia of the People's Republic of China, 2005, vol. 387 Search PubMed.
- D. Gu, S. M. Shang, Q. Yu and J. Shen, Appl. Surf. Sci., 2016, 390, 38–42 CrossRef CAS.
- A. Kumar, A. R. Chowdhuri, D. Laha, T. K. Mahto, P. Karmakar and S. K. Sahu, Sens. Actuators, B, 2017, 242, 679–686 CrossRef CAS.
- X. L. Luo, W. G. Zhang, Y. Han, X. M. Chen, L. Zhu, W. Z. Tang, J. L. Wang, T. L. Yue and Z. H. Li, Food Chem., 2018, 258, 214–221 CrossRef CAS PubMed.
- Z. J. Xie, Y. P. Feng, F. L. Wang, D. N. Chen, Q. X. Zhang, Y. Q. Zeng, W. Y. Lv and G. G. Liu, Appl. Catal., B, 2018, 229, 96–104 CrossRef CAS.
- N. Huang, X. Chen, X. F. Zhu, M. M. Xu and J. Liu, Biomaterials, 2017, 141, 296–313 CrossRef CAS PubMed.
- K. K. Ng and G. Zheng, Chem. Rev., 2015, 115, 11012–11042 CrossRef CAS PubMed.
- X. Y. Xu, R. Ray, Y. L. Gu, H. J. Ploehn, L. Gearheart, K. Raker and W. A. Scrivens, J. Am. Chem. Soc., 2004, 126, 12736–12737 CrossRef CAS PubMed.
- Q. L. Wang, X. X. Huang, Y. J. Long, X. L. Wang, H. J. Zhang, R. Zhu, L. P. Liang, P. Teng and H. Z. Zheng, Carbon, 2013, 59, 192–199 CrossRef CAS.
- N. Gao, W. Yang, H. L. Nie, Y. Q. Gong, J. Jing, L. J. Gao and X. L. Zhang, Biosens. Bioelectron., 2017, 96, 300–307 CrossRef CAS PubMed.
- A. Gao, Y. F. Kang and X. B. Yin, New J. Chem., 2017, 41, 3422–3431 RSC.
- S. Y. Lim, W. Shen and Z. Q. Gao, Chem. Soc. Rev., 2015, 44, 362–381 RSC.
- Y. G. Lei, C. Yang, J. H. Hou, F. Wang, S. X. Min, X. H. Ma, Z. L. Jin, J. Xu, G. X. Lu and K. W. Huang, Appl. Catal., B, 2017, 216, 59–69 CrossRef CAS.
- H. Feng and Z. S. Qian, Chem. Rec., 2018, 18, 491–505 CrossRef CAS PubMed.
- X. C. Sun and Y. Lei, TrAC, Trends Anal. Chem., 2017, 89, 163–180 CrossRef CAS.
- G. L. Chen, H. Feng, X. G. Jiang, J. Xu, S. F. Pan and Z. S. Qian, Anal. Chem., 2018, 90, 1643–1651 CrossRef CAS PubMed.
- C. Tang, J. Zhou, Z. S. Qian, Y. Y. Ma, Y. Y. Huang and H. Feng, J. Mater. Chem. B, 2017, 5, 1971–1979 RSC.
- W. Shi, X. H. Li and H. M. Ma, Angew. Chem., 2012, 124, 6538–6541 CrossRef.
- H. L. Li, J. F. Zhai and X. P. Sun, J. Mater. Chem. A, 2017, 5, 1826–1859 RSC.
- K. K. Liu, X. M. Li, S. B. Cheng, R. Zhou, Y. C. Liang, L. Dong, C. X. Shan, H. B. Zeng and D. Z. Shen, Nanoscale, 2018, 15, 7155–7162 RSC.
- H. Zhu, H. Zhang and Y. S. Xia, Anal. Chem., 2018, 90, 3942–3949 CrossRef CAS PubMed.
- G. Anoop, T. Y. Kim, H. J. Lee, V. Panwar, J. H. Kwak, Y. J. Heo, J. H. Yang, J. H. Lee and J. Y. Jo, Adv. Electron. Mater., 2017, 3, 1700264 CrossRef.
- K. Dimos, F. Arcudi, A. Kouloumpis, I. B. Koutselas, P. Rudolf, D. Gournis and M. Prato, Nanoscale, 2017, 29, 10256–10262 RSC.
- Y. Choi, Y. Choi, O. H. Kwon and B. S. Kim, Chem.–Asian J., 2018, 6, 586–598 CrossRef PubMed.
- L. L. Guo, L. Li, M. Y. Liu, Q. Wan, J. W. Tian, Q. Huang, Y. Q. Wen, S. D. Liang, X. Y. Zhang and Y. Wei, Mater. Sci. Eng., C, 2018, 84, 60–66 CrossRef CAS PubMed.
- C. Y. Liang, W. Xia, C. Z. Yang, Y. C. Liu, A. M. Bai and Y. J. Hu, Carbon, 2018, 130, 257–266 CrossRef CAS.
- Y. Zhang, Z. Y. Gao, W. Q. Zhang, W. Wang, J. L. Chang and K. Jiang, Sens. Actuators, B, 2018, 262, 928–937 CrossRef CAS.
- W. Liu, H. P. Diao, H. H. Chang, H. J. Wang, T. T. Li and W. L. Wei, Sens. Actuators, B, 2017, 241, 190–198 CrossRef CAS.
- J. Shen, S. M. Shang, X. Y. Chen, D. Wang and Y. Cai, Mater. Sci. Eng., C, 2017, 76, 856–864 CrossRef CAS PubMed.
- L. Wang and H. S. Zhou, Anal. Chem., 2014, 86, 8902–8905 CrossRef CAS PubMed.
- W. B. Lu, X. Y. Qin, S. Liu, G. H. Chang, Y. W. Zhang, Y. L. Luo, A. M. Asiri, A. O. Al-Youbi and X. P. Sun, Anal. Chem., 2012, 84, 5351–5357 CrossRef CAS PubMed.
- K. M. Tripathi, A. K. Sonker, S. K. Sonkar and S. Sarkar, RSC Adv., 2014, 4, 30100–30107 RSC.
- P. C. Hsu, Z. Y. Shih, C. H. Lee and H. T. Chang, Green Chem., 2012, 14, 917–920 RSC.
- F. Li, C. J. Liu, J. Yang, Z. Wang, W. G. Liu and F. Tian, RSC Adv., 2014, 4, 3201–3205 RSC.
- J. Zhou, Y. Yang and C. Y. Zhang, Chem. Commun., 2013, 49, 8605–8607 RSC.
- M. Y. Xue, L. L. Zhang, Z. H. Zhan, M. B. Zou, Y. Huang and S. L. Zhao, Talanta, 2016, 150, 324–330 CrossRef CAS PubMed.
- F. Gao, J. Y. Qu, C. Geng, G. H. Shao and M. B. Wu, J. Mater. Chem. A, 2016, 4, 7445–7452 RSC.
- R. R. Liu, H. M. Zhang, S. W. Liu, X. Zhang, T. X. Wu, X. Ge, Y. P. Zang, H. J. Zhao and G. Z. Wang, Phys. Chem. Chem. Phys., 2016, 18, 4095–4101 RSC.
- T. T. Xu, J. X. Yang, J. M. Song, J. S. Chen, H. L. Niu, C. J. Mao, S. Y. Zhang and Y. H. Shen, Sens. Actuators, B, 2017, 243, 863–872 CrossRef CAS.
- C. Wang, T. T. Hu, Z. Q. Wen, J. D. Zhou, X. J. Wang, Q. Wu and C. X. Wang, J. Colloid Interface Sci., 2018, 521, 33–41 CrossRef CAS PubMed.
- A. Bhati, S. R. Anand, Gunture, A. K. Garg, P. Khare and S. K. Sonkar, ACS Sustainable Chem. Eng., 2018, 6, 9246–9256 CrossRef CAS.
- Y. B. Wang, Q. Chang and S. L. Hu, Sens. Actuators, B, 2017, 253, 928–933 CrossRef CAS.
- S. Liu, J. Q. Tian, L. Wang, Y. W. Zhang, X. Y. Qin, Y. L. Luo, A. M. Asiri, A. O. Al-Youbi and X. P. Sun, Adv. Mater., 2012, 24, 2037–2041 CrossRef CAS PubMed.
- P. J. S. Rana, P. Singh and P. Kar, J. Mater. Chem. B, 2016, 4, 5929–5937 RSC.
- L. B. Li, B. Yu and T. Y. You, Biosens. Bioelectron., 2015, 74, 263–269 CrossRef CAS PubMed.
- C. Q. Ding, A. W. Zhu and Y. Tian, Acc. Chem. Res., 2014, 47, 20–30 CrossRef CAS PubMed.
- G. Gedda, C. Y. Lee, Y. C. Lin and H. F. Wu, Sens. Actuators, B, 2016, 224, 396–403 CrossRef CAS.
- M. J. Krysmann, A. Kelarakis, P. Dallas and E. P. Giannelis, J. Am. Chem. Soc., 2012, 134, 747–750 CrossRef CAS PubMed.
- R. Atchudan, T. N. J. I. Edison, K. R. Aseer, S. Perumal, N. Karthik and Y. R. Lee, Biosens. Bioelectron., 2018, 99, 303–311 CrossRef CAS PubMed.
- M. Shamsipur, K. Molaei, F. Molaabasi, M. Alipour, N. Alizadeh, S. Hosseinkhani and M. Hosseini, Talanta, 2018, 183, 122–130 CrossRef CAS PubMed.
- S. Barman and M. Sadhukhan, J. Mater. Chem., 2012, 22, 21832–21837 RSC.
- G. K. Wang, H. M. Hou, S. L. Wang, C. L. Yan and Y. F. Liu, Colloids Surf., B, 2017, 157, 135–145 Search PubMed.
- Reshma, S. K. Vaishnav, I. Karbhal, M. L. Satnami and K. K. Ghosh, J. Mol. Liq., 2018, 255, 279–287 CrossRef CAS.
Footnote |
| † Electronic supplementary information (ESI) available. See DOI: 10.1039/c9ra00360f |
| This journal is © The Royal Society of Chemistry 2019 |

