
 Open Access Article
 This Open Access Article is licensed under a Creative Commons Attribution-Non Commercial 3.0 Unported Licence
Soft ionic liquid multi-point touch sensor
Jarred Fastier-Wooller *a,
Toan Dinhab,
Van Thanh Daua and
Dzung Viet Daoab
*a,
Toan Dinhab,
Van Thanh Daua and
Dzung Viet Daoab
aSchool of Engineering and Built Environment, Griffith University, Southport, QLD 4222, Australia. E-mail: jarred.fastier-wooller@griffithuni.edu.au
bQLD Micro- and Nanotechnology Centre, Griffith University, Brisbane, QLD 4111, Australia
First published on 5th April 2019
Abstract
The development of electronic skin (e-skin) and soft tactile sensing has recently attracted great interest. Here we report for the first time on a novel ionic liquid (IL) based soft pressure sensor with multi-point touch detection capability using 1-butyl-3-methylimidazolium tetrafluoroborate ([BMIM]+[BF4]−) as a highly conductive sensing medium. The sensing mechanism is attributed to the repopulation of charge cations and anions in aqueous solution under pressure. The sensor can detect two dimensional touching positions with a sensitivity of −0.28% kPa−1. Our sensor showed good stability and temperature independence thanks to the incompressibility of IL in the range of touch pressure and the appropriate signal measurement configuration. We successfully demonstrated the sensor's capability to detect multi-point human touch with different pressure levels. Our simple design with smart structures and ease of fabrication processes enable the development of a soft and low-cost sensor with multiple-point sensing capabilities on a single chip.
Introduction
Soft sensors are used in various applications in robotics1–5 and as wearables.6–9 These sensors have the necessary properties and even show benefits over other sensors in their flexibility, stretchability, and sensitivity.10–13 Soft sensors possess the ability to measure pressure on a surface that is soft and flexible enough to mimic the dexterity and delicacy of human touch.14,15 Such sensors allow for a more advanced and versatile robot to object interaction and even human to robot interaction.16Human touch is not solely dependent on pressure sensitivity; there is also thermal, pain, and visual feedback. These senses are crucial to the interaction and manipulation of objects. Though, before giving robots a sense of pain, it's important to make sure there is enough information in terms of touch. As processing power increases and more and more processing dependant solutions are presented, such as image processing,17,18 there is still a need for sensitive e-skins and soft tactile sensors that are of simple design and remain low-cost for easy fabrication, yet still allowing integration into more complex systems.
It has been discussed and shown that in order to perform dexterous manipulation of an object it is important to be able to detect force/pressure and position to better control slippage or sliding,15,19,20 or pressure distribution which has been given much attention in e-skin technologies.21–25 These solutions use an area or matrix of interconnected or individually connected sensors to detect and map pressure areas. Many of these sensing devices provide separate sensors, each capable of performing a task such as temperature and pressure stacked matrices.26
This work presents a low-cost and simple fabrication process for a soft and localised pressure distribution sensor. Fabrication is performed using well established and simple fabrication methods whilst maintaining a simple yet effective structure. Thus, we avoid as many IC and MEMS processes or materials such as CNTs27 as possible. The device consists of a processed copper PCB (milled or etched), cut 3M tape (by hand or laser cutter), and injected with 1-butyl-3-methylimidazolium tetrafluoroborate ([BMIM]+[BF4]−) Ionic Liquid (IL). This IL is used as a soft sensing medium due to its non-volatility, with benefits such as low vapour pressure, low freezing point, and high flash point. ILs are incompressible allowing them to maintain a constant volume at a constant temperature in a closed volume/chamber sensing device.28
By using a low Young's modulus material as the surface of the sensor, an array of electrodes has been positioned to allow for differential position measurements to use in a similar manner to conventional pressure measurements. Due to the incompressible nature of the IL, the shift in weight or pressure can be measured differentially and correlated to a percentage change of the overall pressure measured. It also means the device maintains its volume and does not deflate when used. Such measurements can be used to aid in showing the shift in weight during motion/manipulation of a hand or robot gripper. However, the device is soft and capable of deforming against the object it is in contact with, like that of the human fingertips. As part of the sensor is under pressure, it will expand in the lower pressure regions, increasing the difference between each section of the sensor. Thus, the device can indicate in which section of the sensor is under the most pressure. While the device is not under pressure it is possible to use it for temperature measurements in the same way as our previously reported work.29
Materials and devices
IL is used as an electrically conductive sensing medium for our device to facilitate soft sensing capability. In an aqueous ionic solution, the ions carry charge between electrodes. The effective ionic conductance of the IL is expressed by| σIL = μnzF, | (1) |
Using the ionic conductivity from eqn (1), the effective resistance (real component of impedance Z) between two electrodes in IL can be approximated as
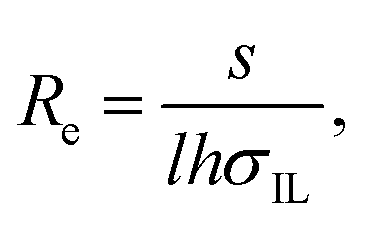 | (2) |
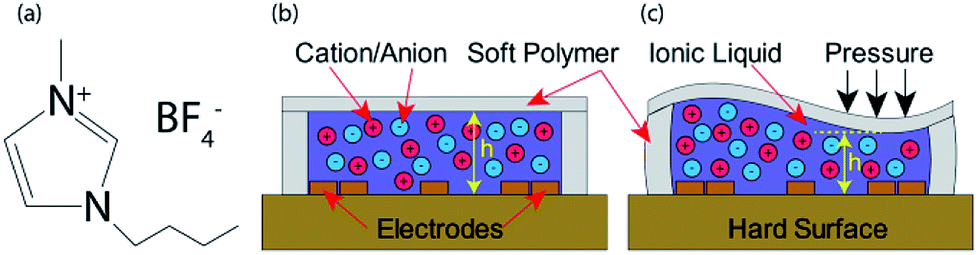 | ||
| Fig. 1 (a) Chemical structure of [BMIM]+[BF4]−, (b) sensor at rest, (c) sensor under external applied pressure. | ||
The effects of temperature can be described by the relation between temperature and viscosity, where an increase in temperature will cause a change viscosity.30,31 These changes can be related to the change in effective resistance through diffusivity (D), as an increase in diffusivity allows for the ions to propagate quicker,32
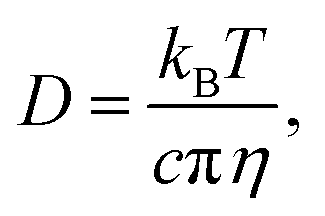 | (3) |
From eqn (2) and (3), we can show that a change in height (h) under an applied pressure (P) or a change in ion mobility (μ) due to varying ambient temperature (T),
| Re ∝ [h(P)μ(T)]−1, | (4) |
To select an IL, the physical properties and merits were evaluated on the cost and safety of the IL, where the most expensive ILs were the most inert and safe to handle. A trade-off for a low-cost solution that remained safe to handle if basic PPE and appropriate disposal were used. We purchased ≥98% assay 1-butyl-3-methylimidazolium tetrafluoroborate ([BMIM]+[BF4]−) from Sigma Aldrich. The chemical structures of [BMIM]+[BF4]− is shown in Fig. 1(a). The main benefits and perks in handling centre around the ILs non-volatility and low vapour pressure of <0.125 × 10⁻³ hPa. A low freezing point of 202 K and high flash point of 561 K are well suited for the range of measurements expected in our application ranging from 290 K to 360 K, well within the safe limits of the material. Electrical conductivity was measured to be 0.95 S m−1 which lies between the conductivity range of this IL reported in literature (0.173 S m−1 and 0.35 S m−1,33 and 5.77 S m−1 (ref. 34)). This indicates a range of excellent electrical properties for us to propose the design and implementation of a simple sensor structure.
We have shown how the deformation and displacement of a volume of electrically conductive IL covering a set of electrodes is capable of changing the effective resistivity or, in terms of the device, the output impedance/voltage. As the length and distance between electrodes is a design constant, the working principle of the proposed device is based mostly on the deformation of the IL volumes effective height around the electrodes. As the movement of IL is pushed towards one side or another, the impedance between these electrode pairs change dynamically. It can be seen in Fig. 1(c) when pressure is applied to one side of the device, the deformation is reciprocated across the other areas of the device, causing an increase in impedance in the area under pressure and a decrease in those not. The increase in impedance is attributed to the repopulation of charge cation and anion in aqueous solution under pressure.
Physical deformation of the surface area of the sensor under an applied pressure is the main contributing factor in the change of impedance between electrodes (shown in Fig. 1 and 2). By using thick walled (2.5 mm) soft polymer on the perimeter of the sensor it's possible to maintain a soft/rubbery sensor that is less sensitive to compression and expansion in the sides than the surface area. Due to the low Young's modulus of the soft polymer, the surface area of the sensor is very soft and elastic in nature, where compression in one part of the sensor will provide expansion in the other areas. This effect has been used to design a sensor that is capable of showing a difference in pressures between four sensing areas of the one device. By reducing the initial height (depth of the IL layer) the sensitivity of the device will increase. However, an IL layer that is too shallow will result in a shortening range and undesirable linearity, as the membrane will no longer deform after making contact with the electrodes on the bottom layer of the device. An increase in initial height will reduce sensitivity and increase the range. However, a larger IL volume can cause sensor bloating, as it is a sealed device filled with an incompressible liquid.
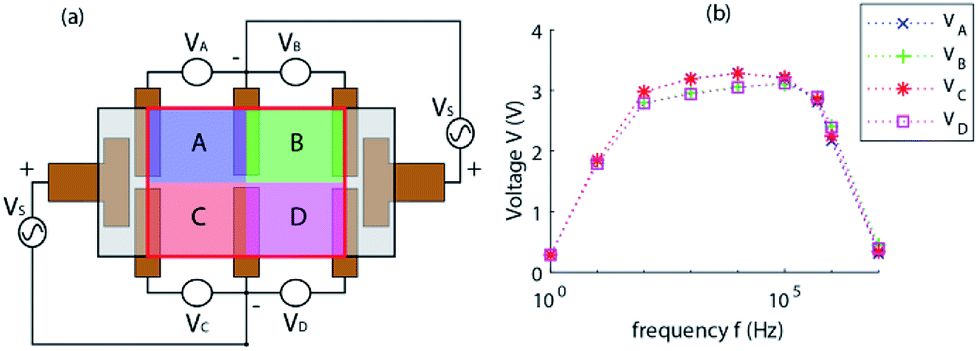 | ||
| Fig. 2 (a) Sensor design with electrode positioning and proposed measurement circuit configuration. Sensing areas coloured and outlined in red. Grey area is an introduced impedance for voltage measurement and demonstration. (b) Frequency response of adjacent configuration. | ||
To perform simple and symmetrical voltage measurements and demonstration using the device, an alternate measurement method was presented (Fig. 2(a)) based on conventional 4-point measurement methods. The device is offset with an internal voltage for direct measurements with an oscilloscope or microcontroller without requiring additional circuitry and configured in a manner to provide symmetrical readings when the device is not under pressure. This offset voltage is introduced when we power the device via Vs (far left and right electrodes in Fig. 2(a)) which is represented by the grey shaded rectangles that are outlined in black. We have performed measurements in this manner to utilise the convenience of the sensor and circuit (as seen in Fig. 6). Due to the very soft and malleable nature of the surface of the sensor, minor asymmetry can be seen between the VA & VC side and the VB & VD side of the device. Frequency of the excitation voltage applied to the sensor shows a high impact on the output magnitude of the device and minor effects on the symmetry. Low frequency measurements show that it is indeed unsuitable to use DC measurements on an ionic solution, with peak symmetry and high response shown at around 500 kHz (Fig. 2(b)).
For testing purposes, a deformable rectangular channel of IL with a height, width, and length of 0.5 mm × 7.0 mm × 14.0 mm respectively, is fabricated on a PCB board. However, it may be possible to adhere the sensor to different surface profiles if fabrication and positioning of the electrodes is not an issue. It should be noted that the surface area for adhesion with the tape used in our work requires a smooth surface to ensure no leakage occurs.
Fabrication
Copper PCB was fabricated using a router (LPKF ProtoMat S42). The resulting PCB was rough and required gentle sanding (3M 734 P240) before use. Sheets of 0.5 mm thick tape (3M VHB acrylic foam tape) were measured and cut using a scalpel (Duratool D00298). Connecting wires were soldered before and after cleaning the copper PCB with a citric acid solution and acetone. The first layer, a hollow rectangular cut-out of tape is affixed to the surface of the cleaned PCB, followed by a solid rectangular layer of tape. IL ([BMIM]+[BF4]−) was injected into the cavity by pressing a 0.3 mm needle (BD Microlance 3) through the second layer into the cavity at an angle to avoid the underside of the second layer from unintentionally sticking to the surface of the PCB. The needle and syringe are repeatedly used to ensure the sensor is filled with the IL solution and all air bubbles are removed. Due to the fine point of the needle used, these holes do not leak the viscous IL substance as long as the sensor isn't put under unnecessary internal or external pressure before the third layer is applied. Upon removal of the needle from the second layer, it was observed that the tape adheres to itself effectively sealing the perforation, this is shown in Fig. 3(f). Finally, holes in the second layer of the sensor are sealed with a third layer of tape. The protective layers on the tape were not removed prior to assembly. This process is further detailed and can be seen in Fig. 3.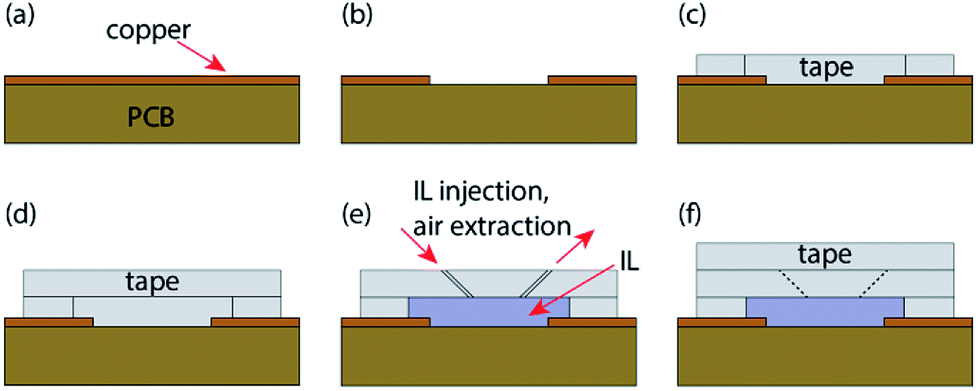 | ||
| Fig. 3 Cross section of fabrication and assembly process. (a) PCB preparation, (b) copper etching/milling of electrodes, (c) adhesion of 0.5 mm hollow cut tape, (d) bonding of 0.5 mm solid cut tape, (e) channel injected with IL, (f) bonding of final 0.5 mm tape layer. | ||
Results and discussion
The fabricated sensor is shown as an inset in Fig. 4. To calibrate the sensor, pressure was applied to the surface area over each sensing area of the device using a 4 mm × 5 mm piece of acrylic. The force applied to the sensor was measured accurately and simply using a scale (OHAUS Pioneer PA4102) supporting the sensor. An LCR Meter (U1733C) was used to perform precision impedance measurements of the output of each section of the sensor (positions VA, VB, VC, and VD as seen in Fig. 2(a)).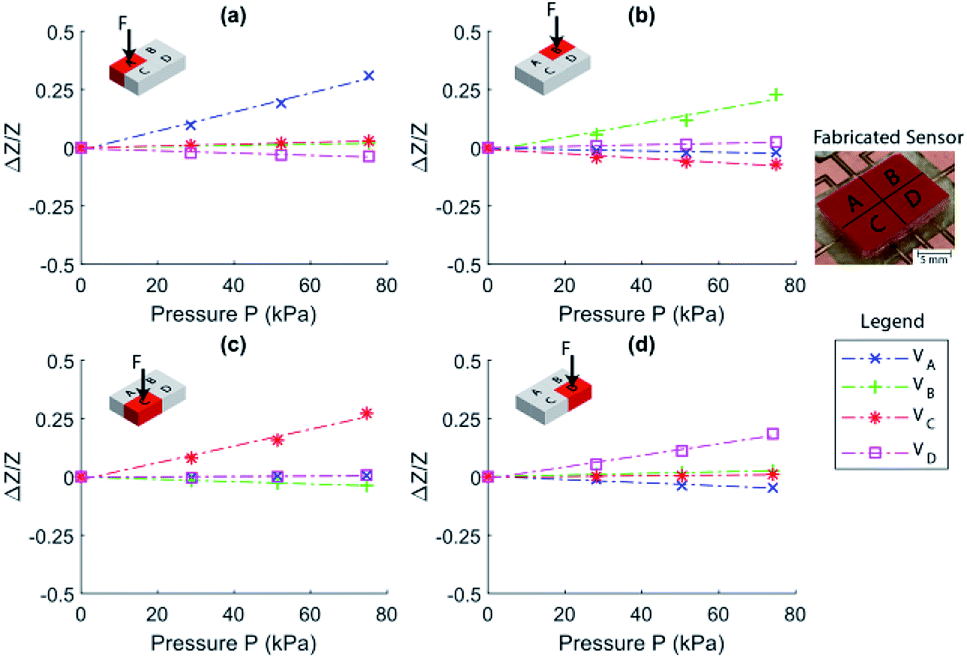 | ||
| Fig. 4 Relative changes of output impedances when each quadrant of the device is subject to pressure. (a), (b), (c), and (d) Represent the device outputs when quadrant A, B, C, or D respectively is under an applied pressure. | ||
It can be seen from Fig. 4(a) that, when a pressure is applied to section A, the local volume of IL is decreasing causing a large increase in impedance of this section, while the opposing sides B and D show slightly decreased impedances. Output from section C shows a minor increase in impedance as it is close to the area of applied pressure. Similarly, in Fig. 4(b), the most changed signal is B, followed by the opposing sides A and C, where D is the least effected. This convention can also be seen in Fig. 4(c) and (d). These agree well with the design analysis presented, showing a strong correlation between the change in pressure and output of the device as presented in Fig. 1 and eqn (4), where Re ∝ [h(P)]−1. Small differences between measurements can be seen in Fig. 4 due to the position of the applied pressure not being the same between each sensing area. However, the device has clearly shown an excellent ability to distinguish between each pressure sensitive area.
Voltage measurements were performed by exiting the device using a signal generator (Keysight Technologies MSOX3104A) supplying 5 Vpp @ 500 kHz and voltage measurements were taken using a four channel oscilloscope (Rigol DG1022). Peak–peak voltages for each section of the device were recorded alongside the applied weight/force data. The relative changes of output voltages (VA, VB, VC, and VD).
Using this measurement method, we propose a dynamic reference calculated by the total measured value over all four sensing areas (Vtotal) relative to each individual value at the same time as measurement. By using a dynamic reference point, it is possible to theoretically diminish the temperature effect on the output of the device. Thus, instead of using a reference voltage from calibration, a ratio is calculated at the time of each measurement. The device consists of a single chamber where, as long as contact with varying temperatures is distributed evenly across the surface of the device, the internal temperature will change at a near-consistent rate through the IL. This change in temperature should evenly and equally affect each of the four sections of the one device. Therefore, at any time, as long as Vtotal is referenced at the same time at each measurement,
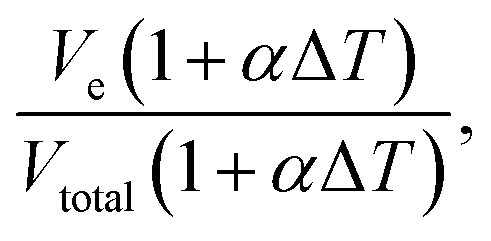 | (5) |
The desired output of the device is mathematically shown to be temperature independent. However, the presented device uses an IL that has reported high temperature/viscosity relation30,32 and thus a high Temperature Coefficient of Impedance (TCZ).33 In our previous work we have shown that [BMIM]+[BF4]− IL is capable of a very high TCZ of up to −17![[thin space (1/6-em)]](https://www.rsc.org/images/entities/char_2009.gif) 300 ppm K−1.29 The main contributing factor to these measurements was determined to be the ILs diffusivity in relation to viscosity and temperature. Similarly, when our current device is under a known pressure/load (e.g. no load), it is possible to use one (or all) cells of the device to make ambient temperature measurements. Once the system is under load, these measurements become unreliable due to the acting pressure and temperature on the device. We hypothesise that the change in viscosity may also have an impact on the sensitivity of the device to pressure due to the slight change in the materials deformability.
300 ppm K−1.29 The main contributing factor to these measurements was determined to be the ILs diffusivity in relation to viscosity and temperature. Similarly, when our current device is under a known pressure/load (e.g. no load), it is possible to use one (or all) cells of the device to make ambient temperature measurements. Once the system is under load, these measurements become unreliable due to the acting pressure and temperature on the device. We hypothesise that the change in viscosity may also have an impact on the sensitivity of the device to pressure due to the slight change in the materials deformability.
The effect of pressure dPe at a sensing element cause the locally average deformation dεe, which changes the voltage of the element to Ve(1 + βedεe) (where βe is the coefficient representing the linear relation between mechanical deformation and the output voltage, as shown in Fig. 4), will also affect the voltage throughout the device sensed by other elements ith, Vei(1 + βidεi). By setting the initial voltage equally at each element (see sensor symmetricity shown in Fig. 2(a)), the sum of voltage is simplified as
| VtotalP = Vtotal0 + Vi∑βidεi, | (6) |
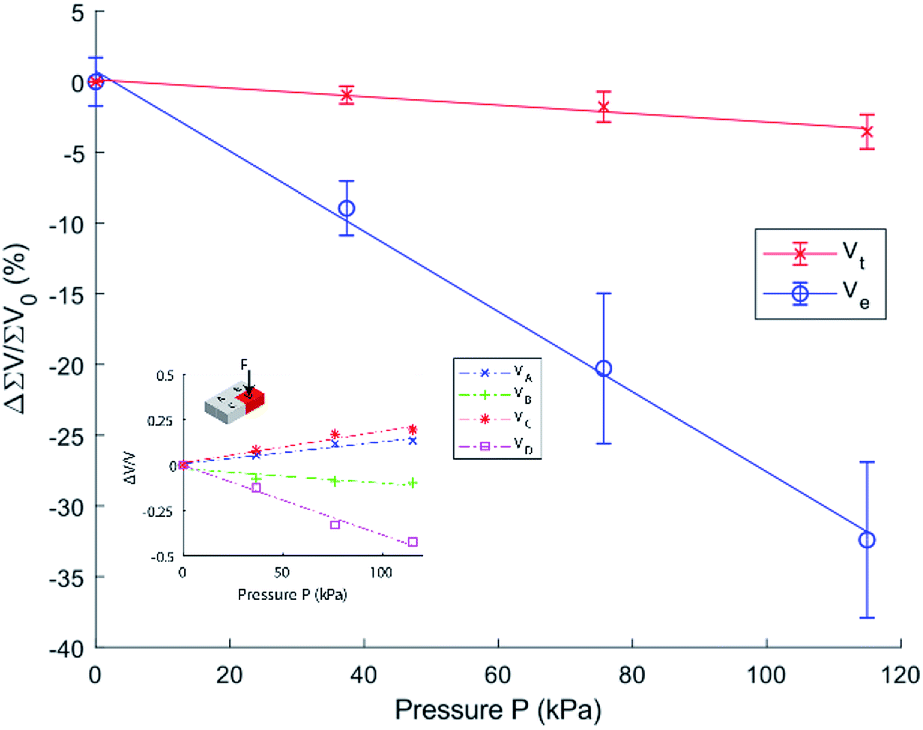 | ||
| Fig. 5 Change in sum of voltages (Vt) as pressure changes, averaged by four measurements with pressure applied at each sensing element (Ve). Error bars represent std over 10 measurements. Inset shows sample of voltage measurement of the device for one element (Vd). | ||
Fig. 5 shows that the system is capable of a sensitivity of −0.28% kPa−1 which is comparable to 0.039 kPa−1,35 0.059 kPa−1,36 and 0.023–0.068 kPa−1 (ref. 37) and even shows higher sensitivity than 0.23 × 10⁻³ kPa−1 (ref. 38) and that of conventional MEMS pressure sensors (e.g. 0.2 × 10⁻⁶ kPa−1 to 0.035 × 10⁻³ kPa−1 (ref. 39)) whose fabrication processes are a multitude more complex than our presented work. It can be seen that the voltage is decreasing rapidly instead of increasing with increased pressure, this can be attributed to the introduced impedances shown in Fig. 2.
Furthermore, by using this measurement method, a microcontroller with a synchronous sampling frequency can be used to make all the measurements and supply the constant AC supply (square wave) to the sensor with no additional circuitry. An example of this is shown in Fig. 6, using an Arduino Leonardo and simple breadboard circuit with four LEDs, to demonstrate the sensors capabilities.
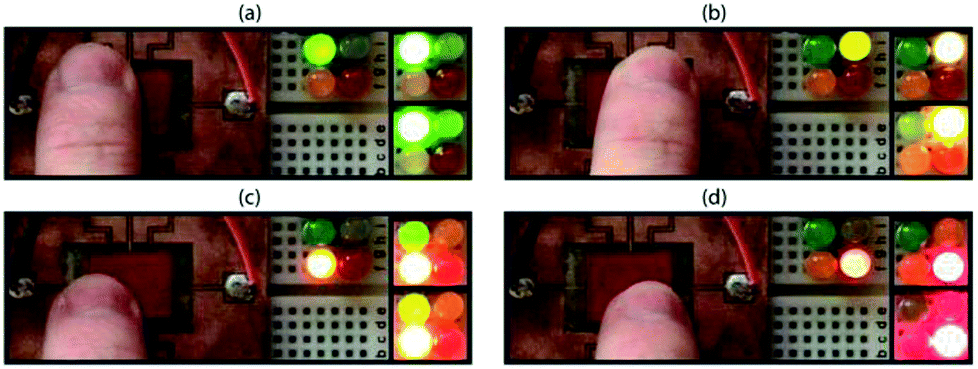 | ||
| Fig. 6 Touch applied to sensing areas A (green), B (yellow), C (orange), and D (red) with LED indication of total applied pressure at each point. Low, medium, and high pressures demonstrated for each sensing element via brightness of LED. | ||
With this elementary setup we were capable of visually representing pressure distribution using four LEDs. It can be seen in Fig. 6(c) that the green LED is active while applying pressure to sensing element C (orange), it's apparent by the finger position that the pressure is not being applied in the exact same location as seen in Fig. 6(d) by comparison. Thus, it is expected that section A shows some response to the applied pressure in section C.
Conclusions
We successfully demonstrated a soft IL-based pressure sensor which is capable of highly sensitive detection of touching points. The chosen IL ([BMIM]+[BF4]−) showed excellent stability and electrical properties for soft tactile and pressure sensing applications. Based on our original measurement circuit configuration and signal processing method, the output symmetry is unaffected by frequency, whereas conventional 4-point measurements in this configuration would be asymmetric. The device is shown to be insensitive to temperature and perpendicular pressure applied to the whole sensing surface, with a low impact on the overall output of the system, but localised pressure creates large output changes. Thanks to the smart structure design and the conservative volume nature of IL, the touching point can be detected with high sensitivity. These results indicate the potential of using [BMIM]+[BF4]− for soft sensing devices with high performance of multi-point touch functions.Conflicts of interest
There are no conflicts to declare.Acknowledgements
This work was performed in part at the Queensland node of the Australian National Fabrication Facility, a company established under the National Collaborative Research Infrastructure Strategy to provide nano and micro-fabrication facilities for Australia's researchers.Notes and references
- M. Wehner, R. L. Truby, D. J. Fitzgerald, B. Mosadegh, G. M. Whitesides, J. A. Lewis and R. J. Wood, Nature, 2016, 536, 451–455 CrossRef CAS PubMed.
- D. Rus and M. T. Tolley, Nature, 2015, 521, 467–475 CrossRef CAS PubMed.
- J. Morrow, H.-S. Shin, C. Phillips-Grafflin, S.-H. Jang, J. Torrey, R. Larkins, S. Dang, Y.-L. Park and D. Berenson, Improving Soft Pneumatic Actuator fingers through integration of soft sensors, position and force control, and rigid fingernails, 2016 IEEE International Conference on Robotics and Automation (ICRA), Stockholm, 2016, pp. 5024–5031, DOI:10.1109/ICRA.2016.7487707.
- A. M. Almassri, W. Z. W. Hasan, S. A. Ahmad, A. J. Ishak, A. M. Ghazali, D. N. Talib and C. Wada, J. Sens., 2015, 2015, 846487 Search PubMed.
- M. Zhu, Z. Wang, S. Hirai and S. Kawamura, Design and fabrication of a soft-bodied gripper with integrated curvature sensors, 2017 24th International Conference on Mechatronics and Machine Vision in Practice (M2VIP), Auckland, 2017, pp. 1–6, DOI:10.1109/M2VIP.2017.8211521.
- T. Dinh, H. P. Phan, T. K. Nguyen, A. Qamar, A. R. M. Foisal, T. N. Viet, C. D. Tran, Y. Zhu, N. T. Nguyen and D. Viet Dao, J. Mater. Chem. C, 2016, 4, 10061–10068 RSC.
- G. Ge, Y. Cai, Q. Dong, Y. Zhang, J. Shao, W. Huang and X. Dong, Nanoscale, 2018, 10, 10033–10040 RSC.
- T. Yang, D. Xie, Z. Li and H. Zhu, Mater. Sci. Eng., R, 2017, 115, 1–37 CrossRef.
- R. K. Kramer, C. Majidi and R. J. Wood, Wearable tactile keypad with stretchable artificial skin, 2011 IEEE International Conference on Robotics and Automation, Shanghai, 2011, pp. 1103–1107, DOI:10.1109/ICRA.2011.5980082.
- B. Nie, R. Li, J. D. Brandt and T. Pan, Lab Chip, 2014, 14, 1107–1116 RSC.
- J. C. Yeo, J. Yu, K. P. Loh, Z. Wang and C. T. Lim, ACS Sens., 2016, 1, 543–551 CrossRef CAS.
- C. Larson, B. Peele, S. Li, S. Robinson, M. Totaro, L. Beccai, B. Mazzolai and R. Shepherd, Science, 2016, 351, 1071–1074 CrossRef CAS PubMed.
- T. Dinh, H. P. Phan, A. Qamar, N. T. Nguyen and D. V. Dao, RSC Adv., 2016, 6, 77267–77274 RSC.
- R. Bogue, Industrial Robot: An International Journal, 2016, 43, 258–263 CrossRef.
- V. A. Ho, D. V. Dao, S. Sugiyama and S. Hirai, IEEE Trans. Rob., 2011, 27, 411–424 Search PubMed.
- R. M. Pierce, E. A. Fedalei and K. J. Kuchenbecker, A wearable device for controlling a robot gripper with fingertip contact, pressure, vibrotactile, and grip force feedback, 2014 IEEE Haptics Symposium (HAPTICS), Houston, TX, 2014, pp. 19–25, DOI:10.1109/HAPTICS.2014.6775428.
- S. Levine, P. Pastor, A. Krizhevsky, J. Ibarz and D. Quillen, Int. J. Robotics Res., 2018, 37, 421–436 CrossRef.
- T. B. Jørgensen, S. H. N. Jensen, H. Aanæs, N. W. Hansen and N. Krüger, J. Intell. Robotic Syst., 2019, 94, 81 CrossRef.
- M. H. Lee and H. R. Nicholls, Mechatronics, 1999, 9, 1–31 CrossRef.
- M. R. Cutkosky and W. Provancher, in Springer Handbook of Robotics, ed. B. Siciliano and O. Khatib, Springer International Publishing, Cham, 2016, pp. 717–736, DOI:10.1007/978-3-319-32552-1_28.
- A. Ahmed, S. L. Zhang, I. Hassan, Z. Saadatnia, Y. Zi, J. Zu and Z. L. Wang, Extreme Mechanics Letters, 2017, 13, 25–35 CrossRef.
- Y. Yang, M. Y. Cheng, W. Y. Chang, L. C. Tsao, S. A. Yang, W. P. Shih, E. Y. Chang, S. H. Chang and K. C. Fan, Sens. Actuators, 2008, 143, 143–153 CrossRef CAS.
- J. Li, R. R. Bao, J. Tao, Y. Y. Peng and C. F. Pan, J. Mater. Chem. C, 2018, 6, 11878–11892 RSC.
- J. Engel, J. Chen and C. Liu, J. Micromech. Microeng., 2003, 13, 359–366 CrossRef.
- J.-B. Chossat, H.-S. Shin, Y.-L. Park and V. Duchaine, Journal of Mechanisms and Robotics, 2015, 7, 021008 CrossRef.
- T. Someya, Y. Kato, T. Sekitani, S. Iba, Y. Noguchi, Y. Murase, H. Kawaguchi and T. Sakurai, Proc. Natl. Acad. Sci. U. S. A., 2005, 102, 12321–12325 CrossRef CAS PubMed.
- V. T. Dau, T. Yamada, D. V. Dao, B. T. Tung, K. Hata and S. Sugiyama, Microelectron. J., 2010, 41, 860–864 CrossRef CAS.
- K. R. Harris, M. Kanakubo and L. A. Woolf, J. Chem. Eng. Data, 2007, 52, 2425–2430 CrossRef CAS.
- J. Fastier-Wooller, R. Yoshikawa, T. Dinh, V. Dau, H.-P. Phan, A. Teo, S. H. Tan and D. V. Dao, in Sustainable Design and Manufacturing 2018, 2019, ch. 19, pp. 184–192, DOI:10.1007/978-3-030-04290-5_19.
- R. Brookes, A. Davies, G. Ketwaroo and P. A. Madden, J. Phys. Chem. B, 2005, 109, 6485–6490 CrossRef CAS PubMed.
- K. R. Harris, M. Kanakubo and L. A. Woolf, J. Chem. Eng. Data, 2007, 52, 2425–2430 CrossRef CAS.
- C. Schreiner, S. Zugmann, R. Hartl and H. J. Gores, J. Chem. Eng. Data, 2009, 55, 1784–1788 CrossRef.
- M. Galiński, A. Lewandowski and I. Stępniak, Electrochim. Acta, 2006, 51, 5567–5580 CrossRef.
- W. W. Liu, T. Y. Zhao, Y. M. Zhang, H. P. Wang and M. F. Yu, J. Solution Chem., 2006, 35, 1337–1346 CrossRef CAS.
- S. Chun, Y. Kim, H. S. Oh, G. Bae and W. Park, Nanoscale, 2015, 7, 11652–11659 RSC.
- Y. H. Wu, H. Z. Liu, S. Chen, X. C. Dong, P. P. Wang, S. Q. Liu, Y. Lin, Y. Wei and L. Liu, ACS Appl. Mater. Interfaces, 2017, 9, 20098–20105 CrossRef CAS PubMed.
- X. Wu, Y. Han, X. Zhang, Z. Zhou and C. Lu, Adv. Funct. Mater., 2016, 26, 6246–6256 CrossRef CAS.
- D. J. Lipomi, M. Vosgueritchian, B. C. Tee, S. L. Hellstrom, J. A. Lee, C. H. Fox and Z. Bao, Nat. Nanotechnol., 2011, 6, 788–792 CrossRef CAS PubMed.
- H. P. Phan, D. V. Dao, K. Nakamura, S. Dimitrijev and N. T. Nguyen, J. Microelectromech. Syst., 2015, 24, 1663–1677 CAS.
| This journal is © The Royal Society of Chemistry 2019 |