DOI:
10.1039/C9RA00228F
(Paper)
RSC Adv., 2019,
9, 19905-19916
Advanced chemical stability diagrams to predict the formation of complex zinc compounds in a chloride environment†
Received
10th January 2019
, Accepted 17th June 2019
First published on 26th June 2019
Abstract
A chemical stability map is advanced by incorporating ion complexation, solubility, and chemical trajectories to predict ZnO, Zn(OH)2, ZnCO3, ZnCl2, Zn5(CO3)2(OH)6, and Zn5(OH)8Cl2·H2O precipitation as a function of the total Zn content and pH of an NaCl solution. These calculations demonstrate equilibrium stability of solid Zn products often not considered while tracking the consumed and produced aqueous Zn ion species concentrations through chemical trajectories. The effect of Cl-based ligand formation is incorporated into these stability predictions, enabling enhanced appreciation for the local corrosion conditions experienced at the Zn surface in chloride-containing environments. Additionally, the complexation of Cl− with Zn2+ is demonstrated to compete with the formation of solid phases, making precipitation more difficult. The present work also extends the chemical stability diagram derivations by incorporating a Gibbs–Thompson curvature relation to predict the effect of nanoscale precipitate phase formation on species solubility. These thermodynamic predictions correlate well with experimental results for Zn corrosion in full and alternate NaCl immersion, and have far-reaching utility in a variety of fields requiring nanoscale, semiconductor, and/or structural materials.
1. Introduction
Chemical stability predictions inform decisions in the corrosion engineering, chemical engineering, geology, soil science, energy, and biomedical fields. These technological fields increasingly demand the accurate understanding of chemical system progression in increasingly complex conditions.1–5 Classical thermodynamic predictions of metal stability, environmental degradation, and eventual corrosion product formation have undergone extensive experimental verification since Marcel Pourbaix's original derivation of E–pH (chemical stability) diagrams,2–7 however little work exists which actively aims to further develop Pourbaix's prediction methods. Recent work by Santucci et al.8 added to Pourbaix's chemical stability diagram method by developing chemical trajectory expressions which track the progression of available ion content in the global system with respect to pH. The equilibrium metal (M) ion concentration ([Mn+]) and pH conditions necessary for M-compound formation, as well as the changes in those conditions upon dissolution of the M-compound were graphically depicted in these improved chemical stability diagrams. The ionic concentration and pH trajectory trends were validated through analysis of the work of Plagemann et al.,9 Lin et al.,10 and Xu et al.11 concerning previously published yet not fully explained experimental findings, wherein customized chemical stability diagrams produced thermodynamic predictions that answered open questions remaining from the interpretation of purely empirical experimental results.8 However, these analyses required equilibrium stability calculation for relatively simple oxidation products whose precipitation could be predicted based on known chemical potentials. More complex corroding systems that have considerable engineering relevance have yet to be fully assessed through chemical stability prediction, as the necessary chemical potential data for such systems are not necessarily known. Thus, these methods must be expanded in breadth, complexity, and accuracy.
One element of increasing societal importance for materials science and engineering is zinc (Zn), which has been historically used in the design of brass alloys and for sacrificial corrosion protection. Corrosion in the Zn system has been thoroughly studied due to the importance of this metal for cathodic protection of steel,12 however formation of many typical and important Zn corrosion products are only qualitatively understood due to the complexity of their makeup.13 Today, Zn is also used in a wider variety of applications such as hazard management, biomedical applications such as drug delivery and antibiotics, as well as in electronics and data storage.14–20 Depending on the application, either metallic Zn or a specific Zn corrosion product may be desired, for which the development of accurate stability/precipitation prediction methods would be beneficial and may inform product development for long-term use.
The complex makeup of many of the zinc compounds requires advancements in the derivation of expressions which track the evolution of total Zn concentration ([Zn]Tot) in tandem with pH as these compounds react electrochemically to achieve equilibrium in the aqueous phase. Complexities arise due to proton transfer reactions (as with Zn2+ + OH− and CO32− + H+) and complexation reactions (as with Zn2+ + Cl−). Therefore, the present work will quantify and predict corrosion product formation within the Zn system through thermodynamically-derived chemical stability diagrams based on known solubility constants that have not been broadly considered.21 The derivation will include complexation effects due to chloride, hydroxide, and carbonate species as a function of bulk chemistry. Lastly, surface effects due to precipitated solid phase curvature will be incorporated into the method through utilizing a Gibbs–Thompson relation, which will predict the required conditions for spherical ZnO nanoparticle formation as a function of radius.
2. Theory/calculations
This work utilized recently developed solubility relations21 to derive chemical stability diagrams that encompass the spectrum of experimentally observed Zn corrosion products that form in non-sulfate-containing marine environment. These corrosion products include zincite (ZnO), wulfingite (Zn(OH)2, (amorphous as well as epsilon phase)), smithsonite (ZnCO3), zinc chloride (ZnCl2), simonkolleite (Zn5(OH)8Cl2·H2O), and zinc hydroxycarbonate (Zn5(CO3)2(OH)6).12,13 Previous work demonstrated the utility of chemical stability diagrams when derived based on thermodynamic chemical potential data, which enabled the stability prediction of relatively simple reaction products such as Mg(OH)2 or Li2CO3.8,22 In the Zn system, however, the presence of complex corrosion products such as simonkolleite and zinc hydroxycarbonate require an expansion on the previously demonstrated methods, as the chemical potentials for these complex products are not known or easily determined.12 It is worth noting that the present framework necessitates the use of molarity in the prediction of these complex Zn compounds, thus activity is not utilized in these thermodynamic equilibrium calculations. Utilizing molarity is of principal importance to allow for the tandem evaluation of the equilibrium boundary lines with the chemical dissolution trajectories. Previous work has shown that activity approaches unity in pure NaCl at concentrations increasingly less than or increasingly greater than 1 M (with higher concentration actually reaching unity at saturation) (see ESI,† where the reproduced data being mentioned apply only to the case of pure NaCl).23 It is noteworthy that the Zn activity coefficients will vary in magnitude as a function of saline concentration between different aqueous environments, or if different ionic species are introduced into a given environment, and that specific Zn ionic complexes will exhibit different activities from one another in these scenarios. For mathematical purposes as well as the availability of required thermodynamic data, the present calculations necessarily assume pure NaCl + H2O + XCO3 conditions, thus these results may be affected by the introduction of pollutants, foreign ionic species, etc. The 0.06 M NaCl case analyzed here is the most likely to demonstrate calculation error based on known trends in activity in pure NaCl (see ESI†),23 so this concentration was chosen for experimental validation, which will be detailed in an ensuing section.
2.1 Construction of equilibrium chemical stability boundaries: bulk formation
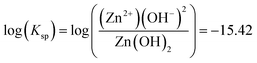
Baseline thermodynamic predictions in the present work neglected Cl− complexation effects, and so the calculation of each aqueous Zn ion's stability was necessary. The chosen environment was NaCl, though other Cl− environments may also be considered. In cases where the cation is simple and has the same charge and/or affinity for complexation with OH− and Cl−, such as for KCl, the results of these thermodynamic predictions will be the same until the solubility limit is reached for the less soluble salt. When the cation has greater charge and increased affinity for complexation, the predictions will differ from the NaCl scenario due to potential effects on the available free [Cl−], as well as effects on the activities of surrounding species. Lange's Handbook of Chemistry provided stability constant values for the range of Zn ion species present in chloride-based, non-sulfate-containing saline environment.22 These data were utilized to create predominance diagrams for the Zn system, which demonstrated that three zones of ion predominance generally occur: Zn2+ (pH 9.0 and lower), Zn(OH)02 (pH 9.0 to pH 13.0), and Zn(OH)42− (pH 13.0 and higher).6,12,22 Zinc predominance diagrams are common in the literature, especially when considering nanoparticle formulation, and are useful to determine available ion content within an electrochemical system as a function of pH.24–26 These predominance results based on the Lange constants, which demonstrated Zn(OH)02 stability in the central pH region, were compared with previous work by Pourbaix, which computed a different set of aqueous Zn ions thought at the time to be dominant (HZnO2− was most stable in the central pH region).6 These comparisons showed good correlation between the models, and demonstrated that, with self-consistent use of a given thermodynamic database, use of a certain ion for rederivation of stability products (Ksp) is not necessary to yield consistent predictions. Corrosion product reactions were then rederived with respect to Zn2+, Zn(OH)3− (chosen to enable the stability prediction of Zn(OH)2 (s)), and Zn(OH)42−, creating three reactions and three Ksp values for each corrosion product which, when summed together, produce each equilibrium compound stability boundary line across the entire pH range (for situations where ion complexation effects due to Cl− are not considered). These Ksp values are shown with respect to each predominant ion in Table 1. For example, in the case of the amorphous Zn(OH)2 reaction equilibrium can be established through the following routes:| | |
(Acidic) Zn(OH)2 (s) = Zn2+ (aq) + 2OH− (aq)
| (1) |
| | |
(Near-neutral) Zn(OH)2 (s) + OH− (aq) = Zn(OH)3− (aq)
| (2) |
| | |
(Alkaline) Zn(OH)2 (s) + 2OH− (aq) = Zn(OH)42− (aq)
| (3) |
Table 1 Zn-based solid corrosion product equilibrium stability constants, Ksp, and formation ratio with respect to predominance zone. a = # of available Zn cations required, b = # of available OH− species required, and c = # of CO32− species required for corrosion product formation. Ksp values are determined with respect to the dissolution of the compound to Zn2+, Cl−, CO32−, and OH−
| Corrosion product |
log(solubility product (Ksp)) for each ion predominance zone |
Species formation ratio |
| Zn2+ |
Zn(OH)3− |
Zn(OH)22− |
a![[thin space (1/6-em)]](https://www.rsc.org/images/entities/char_2009.gif) :b:c :b:c |
| ZnO |
Zincite |
−16.65 |
−2.51 |
1.01 |
1:2:0 |
| Zn(OH)2 (amorphous) |
Wulfingite (am) |
−15.42 |
−1.28 |
−2.24 |
1:2:0 |
| Zn(OH)2 (epsilon) |
Wulfingite (ε) |
−17.04 |
−2.90 |
−1.62 |
1:2:0 |
| Zn(CO3) |
Smithsonite |
−10.92 |
3.22 |
6.74 |
1:0:1 |
| Zn5(CO3)2(OH)6 |
Zinc hydroxycarbonate |
−77.60 |
−6.90 |
10.70 |
5:6:2 |
| Zn5(OH)8Cl2·H2O |
Simonkolleite |
−73.80 |
−3.10 |
14.50 |
5:8:0 |
Utilizing these reactions, the solubility relation can be determined based on the Ksp constants in Table 1, such as for eqn (1):
| |
 | (4) |
Derivation of the three chemical stability equations, one with respect to each predominant aqueous Zn ion, when summed produced a solubility-based chemical stability diagram for Zn(OH)2 (am) based on the assumption that free dominant Znaq ion availability is not limiting (always present in greater quantities than necessary for equilibrium corrosion product precipitation). The method of calculating these equilibria follows fundamental solubility relations, which can be found in previous work and elsewhere.8,22 The method of calculation and the exact solubility relations utilized to construct the chemical equilibrium diagrams are provided in detail in the ESI.†
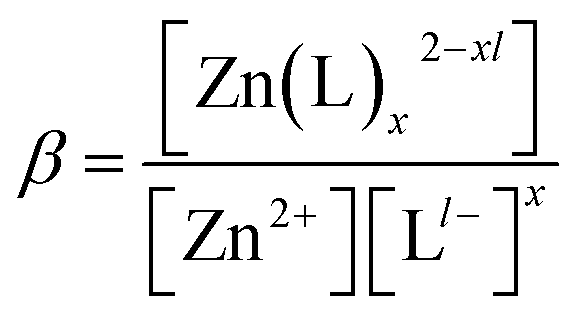
In the presence of complexing species such as chloride, however, the necessary Znaq content required for unhindered corrosion product precipitation may not always exist, as these ligands compete for the use of this cation content through ligand formation (such as formation of ZnCl+, ZnCl3−, etc.). To account for this complexation competition, available, dominant Znaq content was quantified for each ion predominance zone across the pH spectrum to quantify the “actual” solubility of each corrosion product. In this treatment, the actual solubility of Zn-compounds was calculated with respect to free Zn2+ by determining the actual [Zn2+] as a function of pH and [Cl−]. The specific stability constants, or β values, shown in Table 2, were used to determine the ratio of each Zn-based ion present in solution to the total aqueous Zn concentration, [ZnTot]. The derivation of this aqueous Zn ion availability equation is provided in the ESI.† These equations were utilized to quantify the ratio of free Zn2+ ion content to the total aqueous Zn concentration for the Zn2+ ion. Since the Zn2+ requirement for corrosion product equilibrium was calculated from equations like eqn (4), the total Znaq content required for corrosion product formation could be determined from this ratio. Chemical stability diagrams were then reconstructed to incorporate complexation competition in this way, enabling these diagrams to predict bulk Zn corrosion product formation under more rigorous solubility conditions for the marine environment of interest.
Table 2 Zn-based aqueous ion specific stability product constants, β, calculated based on formation from Zn2+
| Zn–L ion species |
log(stability product (β)), 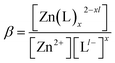
|
| Zn(OH)+ |
4.40 |
| Zn(OH)02 |
11.30 |
| Zn(OH)3− |
14.14 |
| Zn(OH)42− |
17.66 |
| ZnCl+ |
0.43 |
| ZnCl2 |
0.61 |
| ZnCl3− |
0.53 |
| ZnCl42− |
0.20 |
2.2 Construction of equilibrium chemical stability boundaries: nanoscale formation
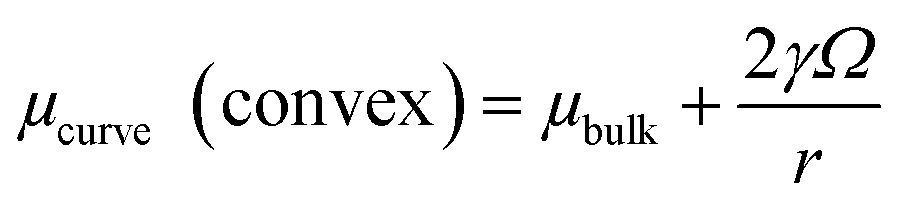
The size scale of the corrosion product formation was also evaluated by incorporating the Gibbs–Thompson curvature relation into the chemical stability trend equations. For this purpose, use of chemical potential was necessary instead of solubility, as has been practiced in previous work,6,8 which enabled the differentiation of the bulk chemical potential from the curvature-dependent chemical potential for the corrosion product of interest:| |
 | (5) |
where γ = interfacial energy (J m−2), Ω = molar volume (m3 mol−1), and r = radius of the nanosphere (m). As γ and Ω can be experimentally and mathematically understood, the effect of curvature on corrosion product stability may then be assessed at the nanoscale. This derivation is conducted with respect to a spherical case, but these relations may be derived to consider more general curvature geometries also. In the case of the ZnO dissolution reaction in the Zn2+ predominance zone,| | |
ZnO + H2O = Zn2+ + 2OH−
| (6) |
for example, the incorporation of the surface curvature would affect the ZnO chemical potential component of the overall solubility relation:| |
 | (7) |
where R is the ideal gas constant (J mol−1 K−1) and T is temperature (K). The γZnO value of 3.55 J m−2 was obtained from theoretical modeling literature (which does not incorporate the environment, but is a suitable baseline to evaluate trends in stability) and describes the assumedly relaxed lattice state on the (111) ZnO surface,27 which enabled the calculation of a nanoscale ZnO chemical stability diagram. Use of this relation enables the derivation of chemical stability based on both “actual” solubility and surface curvature to enable thermodynamic prediction of the Zn ion concentration and pH boundaries for ZnO nanostructure formation and dissolution.
2.3 Construction of chemical trajectory trends
The derivation of the chemical trajectory relations required unique expressions for each corrosion product or group of corrosion products having a specific and unique elemental ratio. To first quantify the ratio of produced cations and the corresponding pH change associated with the dissolution of each corrosion product, consider the general Zn reaction for a simple hydroxide:| | |
Ma(OH)b + nH+ = aMn+ + bH2O
| (8) |
where the desired cation (Mn+) to H+ ratio is a:n (the relationship between metal ion charge and number of hydrogen ions may require more sophisticated variable assignment in exceedingly complex reactions). Effects on chemical trajectory due to the presence of a pH buffer have been considered and quantified in previous work.8 After applying the previously developed trajectory expressions to quantify the [Mn+] change as a function of pH for the corroding system,8 the following general chemical trajectory equation is produced:| |
 | (9) |
However, the effects of more complex corrosion product dissolution need to be assessed in the Zn system, in which exist complex elemental ratios that must be accounted for. For instance, take the simonkolleite (Zn5(OH)8Cl2·H2O) dissolution reaction:
| | |
Zn5OH8Cl2·H2O = 5Zn2+ + 8OH− + 2Cl− + H2O
| (10) |
In this reaction, the produced cation content must be tracked according to the change in OH− or H+ concentration. During complexation competition, the available free OH− content and its distribution between Zn(OH)+, Zn(OH)02, Zn(OH)3−, or Zn(OH)42− will be affected by pH (Table 2). For that purpose, the fraction of hydroxylation (OH− consumption to form aqueous OH-based complexes) that occurs for each released Mn+ may be tracked as f:
| | |
f = ∑d[M(OH)dn−d]d∈[1,4]
| (11) |
where
d is the required number of OH
− consumed during hydroxylation and
n is the charge of the free metal ion. When the given reaction occurs, such as simonkolleite dissolution, 8 OH
− species are produced as well as 5 Zn
2+ species (
b = 8,
a = 5,
a:
b ratio = 5
:
8). The
a:
b ratio would quantify the chemical system progression ([Zn]
tot) across the pH range of an M
n+–pH diagram without the complication of species complexation; however, the subsequent complexation of OH
− species, according to the
f function reduces the effective increase in available OH
− content as a function of pH, requiring that
eqn (11) incorporate such effects to become:
| |
 | (12) |
Furthermore, the presence of carbonate species must also be quantified to establish the proper trend, as the availability of CO32− is also influenced by pH. The concentration of 5 mM was chosen for accuracy to typical atmospheric concentrations.28 While not considered here, the dissolved CO32− concentration may vary with pH and CO2 partial pressure and is known to impact the precipitation of various Zn corrosion products.29 Consider the dissolution of Zn hydroxycarbonate:
| | |
Zn5(CO3)2OH6 = 5Zn2+ + 2CO32− + 6OH−
| (13) |
For this reaction to occur, the availability of the pH-dependent species CO32− is necessary, as can be understood through the following relation:
| | |
Zn(OH)f2−f + HF(CO3)c−(2−F) = Zn2+ + fOH− + cCO32− + FH+
| (14) |
where
c is the required number of CO
32− species. This combined reliance on hydroxyl and carbonate species availability produces the following chemical trajectory equation to quantify the progression of pH and [M
+] dissolved in solution:
| |
 | (15) |
where

quantifies the fraction of available CO
32− in a similar fashion as
eqn (11). For the calculation of the remaining chemical trajectories necessary to describe the corroding Zn system, the
a:
b:
c ratio for each Zn corrosion product is included in
Table 1. Together, these trend relations enable the tracking of the available aqueous Zn ion concentration from an initial pH/available CO
32− condition in consideration OH
−- and Cl
−-based ligand formation.
3. Experimental methods
Titration testing was conducted in 0.06 M NaCl solution at the Zn2+ concentrations of 10−3 M and 10−6 M to assess the accuracy of the chemical stability diagram where the difference between activity and concentration would be highest (compared to the 5.45 M [NaCl] scenario). Experiments were conducted with actively stirred 10−3/10−6 M [Zn2+], 0.06 M [NaCl] solution while actively measuring the pH. Titrant made of the same solution plus several mL of NaOH to reach pH of approximately 13 (above the stable region of solid Zn corrosion product formation) was added in 25 μL increments. Following 1 minute of mixing after each titration, the presence or absence of solid Zn corrosion product was noted, for comparison to thermodynamic predictions.
4. Results
4.1 Ion predominance and chemical stability as a function of bulk environment
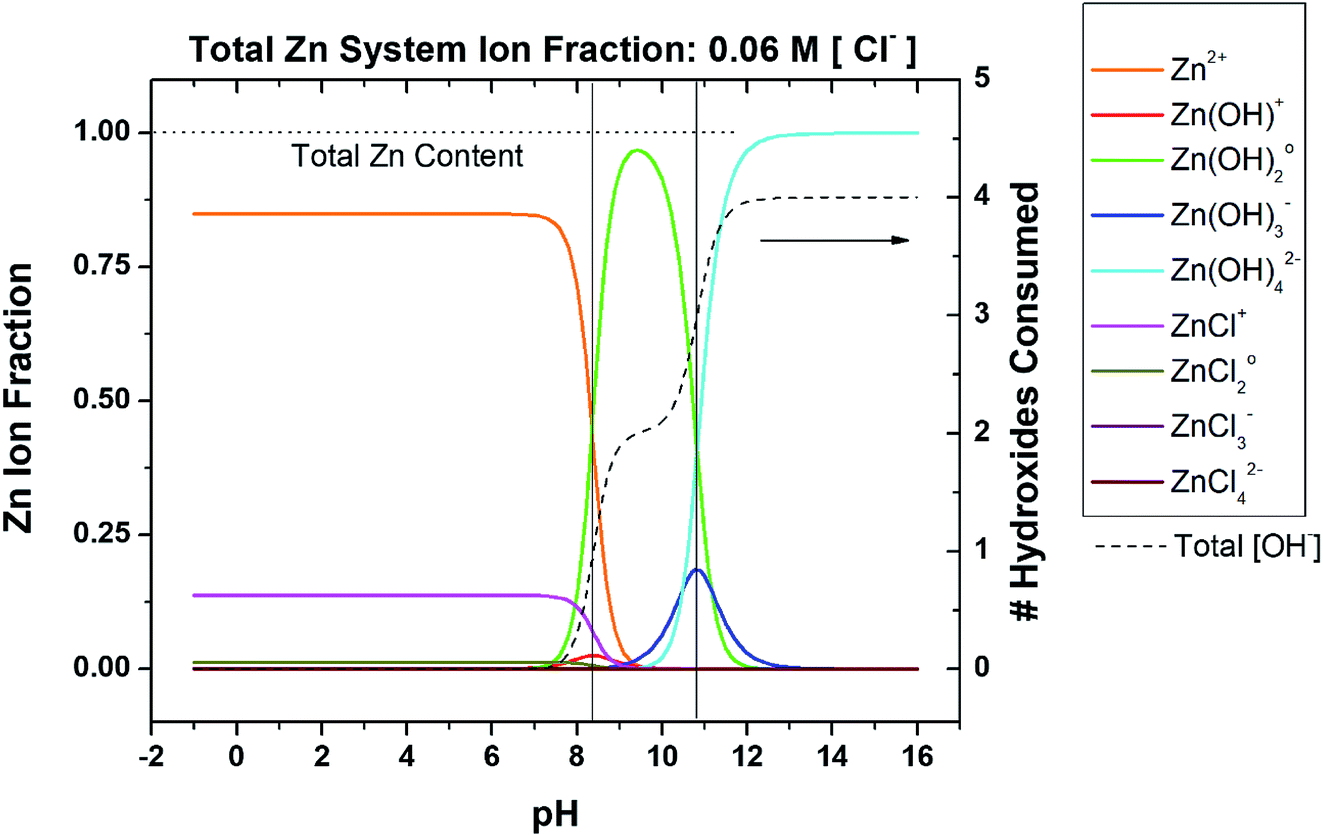
To begin to develop a more inclusive chemical stability diagram for the Zn system, the regions and type of Zn ion species predominance must be understood based on the spectrum of Zn ions known to occur in a given solution. Consider a non-sulfate-containing chloride environment where Zn2+ is provided by any dissolution process that may occur during corrosion, drug delivery, Zn-rich coating depletion, oxide degradation, etc. The pertinent ions are listed in Table 2. The state of chloride saturation at 5.45 M concentration was first assessed to evaluate predominance, as shown in Fig. 1. These diagrams are marked by threshold pH values at which a transition in the dominant, aqueous Zn ion species occurs. At this high chloride content, the ZnCl42− ion dominates from pH −1.0 to 9.8 followed by Zn(OH)02 dominating from pH 9.8 to 10.9, and lastly Zn(OH)42− dominates from pH 10.9 to 16.0. Similar Zn ion predominance diagrams have been previously produced in the literature for corrosion analysis at various fixed [Cl−] or [CO32−], many of which utilize the program Medusa-Hydra.30–34 However, these predominance diagrams are often underutilized and are not typically used to produce even basic chemical stability diagrams. As shown on the right y-axis in Fig. 1, the coordination of the dominant hydroxide species increases with increasing overall amount of consumed hydroxyl ions (and increasingly alkaline pH). To evaluate the effect of the chloride complexation further, ion predominance was calculated at the dilute condition of 0.06 M, as shown in Fig. 2. In the substantially reduced presence of Cl− the Zn2+ ion now dominates in the acidic region to a pH of 8.3. However, the neutral and alkaline regions remain unchanged, as transition between these aqueous ion predominance regions remains at a pH of 10.9 and both the Zn(OH)02 and Zn(OH)42− continue to dominate (Fig. 2). As can be seen in the total hydroxyl consumption, the chloride content does have some measurable impact on the hydroxide formation at neutral pH. As the more dilute conditions are common and chloride concentrations of approximately 2 M are necessary before the Zn2+ ion no longer dominates in the acidic region, the predominant ions pertinent to the dilute scenario will be mainly considered for recalculation of corrosion product solubility relations to derive the chemical stability diagrams.
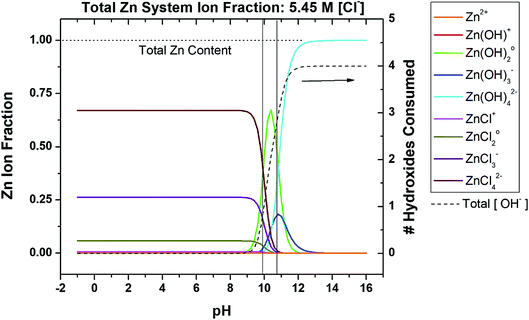 |
| | Fig. 1 Speciation diagram depicting the fractional distribution of various Zn-based species as a function of pH for a given ligand concentration, in this case 5.45 M [Cl−]. Included is the function (dashed line) which describes the number of OH− which would be consumed upon the addition of Zn2+ to the system, as a function of pH. Transition points are marked by vertical black lines where the dominant aqueous Zn ion identity changes. This system neglects carbonates. | |
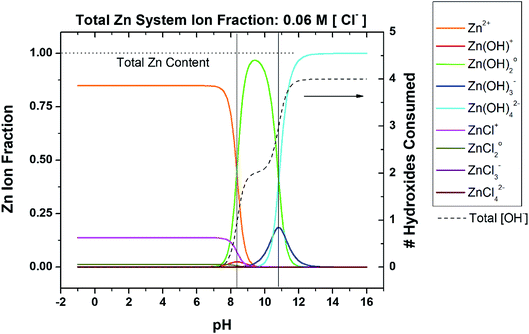 |
| | Fig. 2 Speciation diagram depicting the fractional distribution of various Zn-based species as a function of pH for a given ligand concentration, in this case 0.06 M [Cl−]. Included is the function (dashed line) which describes the number of OH− which would be consumed upon the addition of Zn2+ to the system, as a function of pH. Transition points are marked by vertical black lines where the dominant aqueous Zn ion identity changes. This system neglects carbonates. | |
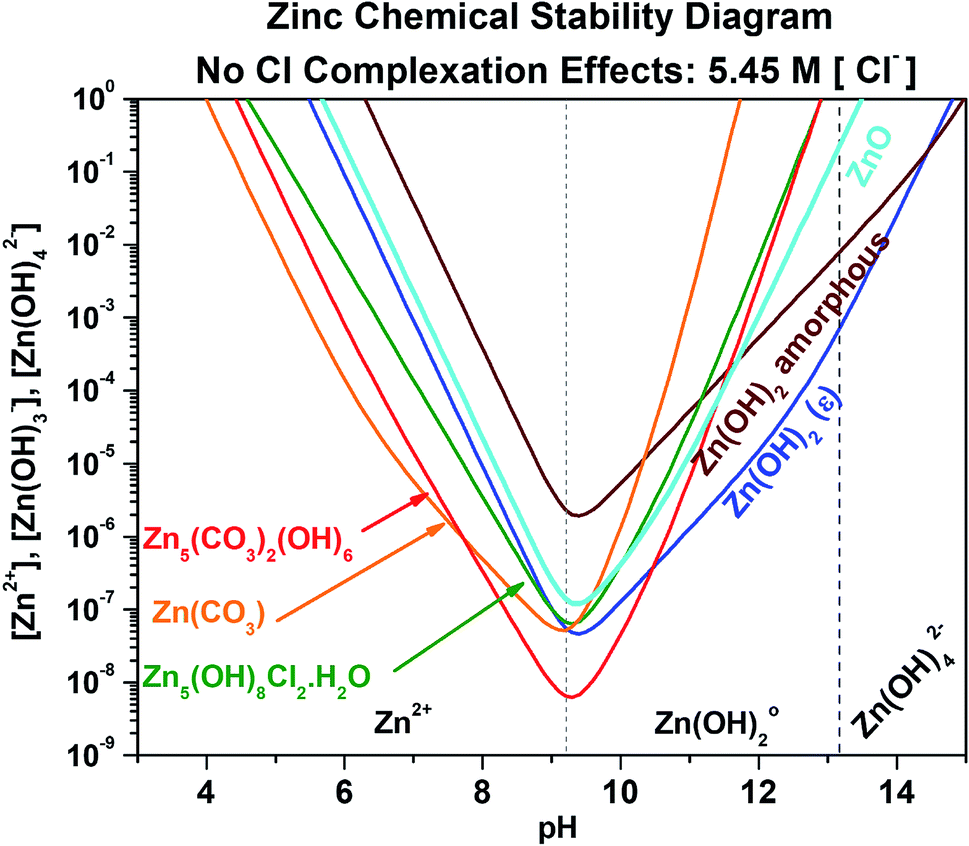
As a baseline, the Zn chemical stability diagram for saturated chloride conditions (5.45 M) was first developed neglecting Cl− complexation effects (no limitation on available Znaq content), as shown in Fig. 3 zoomed in to focus on the key pH range of 3.0 to 15.0. The exact chemical reactions necessary to construct Fig. 3, as well as the chemical stability diagrams to follow, can be found in the ESI.† Analyses of solid Zn corrosion product stability with respect to pH are present in the literature for simple Zn-based corrosion products, but not for complex products such as Zn5(CO3)2(OH)8 and Zn5(OH)8Cl2·H2O.6,35 At these high chloride concentrations for a fixed dissolved carbonate content of 5 mM, ZnCO3 is the most readily formed corrosion product from pH 4.0 to 7.8, followed by Zn5(CO3)2(OH)8 from a pH of 7.8 to 10.8, and lastly Zn(OH)2 (epsilon) from pH 10.2 to 15.0. These corrosion products require small Zn concentrations to form under these conditions, with the lowest requirement being approximately 8 × 10⁻⁹ M and 6 × 10⁻⁸ M Znaq for Zn5(CO3)2(OH)8 and Zn(OH)2/ZnCO3 at pH 9.2, respectively. However, the condition of plentiful free Zn2+ content for corrosion product formation is unlikely, and free Zn2+ ion limited conditions must be quantified to more accurately predict corrosion product formation.
 |
| | Fig. 3 Chemical stability diagram for the Zn–water system. Relevant species are given for exposure in a Cl− (5.45 M) and CO32− (5.00 mM) containing environment. This diagram does not include the effect of ligand complexation due to the presence of Cl−. | |
4.2 Chemical stability as a function of bulk environment and complexation competition
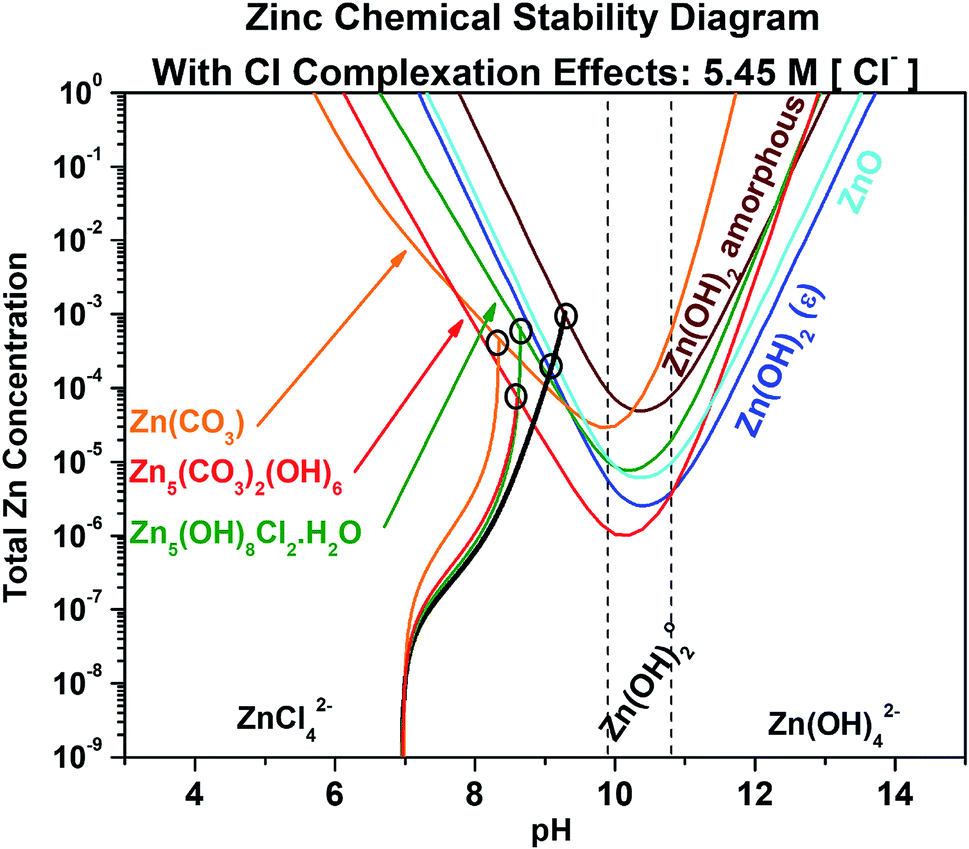
For the same saturated chloride (5.45 M) condition, the Zn chemical stability diagram was then recalculated to include the effects of ion complexation, as shown in Fig. 4. Also included in Fig. 4 are the chemical trajectories (Mn+, pH) to track the [ZnTot] progression of the system from an initial pH of 7 if Zn2+ were added to the solution via dissolution of the various compounds. Separate trajectory lines are necessary for each elemental ratio required to form the associated corrosion products (Table 1), thus the line color for the trajectories matches that of the associated corrosion product equilibrium stability line. For example, the orange chemical trajectory corresponds to the orange equilibrium chemical stability curve for ZnCO3, which has the unique a:b:c of 1:0:1 (Table 1). A unique case exists for Zn(OH)2 and ZnO, since both have a:b:c of 1:2:0 (Table 1), thus the single chemical trajectory associated with the chemical stability curves for Zn(OH)2 and ZnO is shown in black. The point of intersection between these chemical trajectories and the relevant equilibrium stability line has been circled to indicate the total aqueous Zn concentration and pH required for equilibration of each corrosion product. It is recognized that the equilibrium conditions may be met for the formation of a more stable compound upon the dissolution of a less stable compound, resulting in compound transformation over time. As can be readily observed in Fig. 4, the inclusion of complexation effects due to Cl− and OH− on corrosion product stability causes an increase in the required total aqueous Zn content of two orders of magnitude to reach and establish equilibrium, and the chemical stability trends all shift towards more alkaline pH values. Chemical stability diagrams for the Zn system that incorporate ligand complexation effects exist sparingly in the literature, such as in Tay et al.,35 which considers only OH− complexation effects on aqueous Zn ion availability. However, no Zn stability diagrams exist to predict the complexity of corrosion products shown here, nor do any works consider Cl− and OH− complexation in a CO32−-containing environment, and none exist which also track such a complex system state via chemical trajectories. As shown in Fig. 4, ZnCO3 remains the most readily formed corrosion product from pH 6.0 to 7.8 when Cl− complexation is considered, followed by Zn5(CO3)2(OH)8 from a pH of 7.8 to 10.8, and lastly Zn(OH)2 (epsilon) from pH 10.2 to 13.7. At the point of least Zn content requirement for formation at pH 10.2, Zn5(CO3)2(OH)6 and Zn(OH)2 (epsilon) require approximately 1 × 10⁻⁶ M and 2 × 10⁻⁶ M [ZnTot]. The chemical trajectories for each corrosion product are relatively similar despite considerable differences in elemental ratios required to form the range of products.
 |
| | Fig. 4 Chemical stability diagram for the Zn–water system. Relevant species are given for exposure in a Cl− (5.45 M) and CO32− (5.00 mM) containing environment. This diagram includes the effect of ligand complexation with Cl− on the stability of the zinc compounds. Included are chemical dissolution trajectories which describe how the solution chemistry progresses after assuming some initial condition (pH = 7, [ZnTot] = 10−8) to a final equilibrium condition (where the trajectory line intersects an equilibrium line). The trajectory line color matches that of the compound being tracked with respect to concentration and pH (black corresponds to the trajectory line involving both Zn(OH)2 and ZnO due to the expense of their trajectory being the same (Table 1)). Note the incorporation of ligand complexation effects due to the presence of Cl−. | |
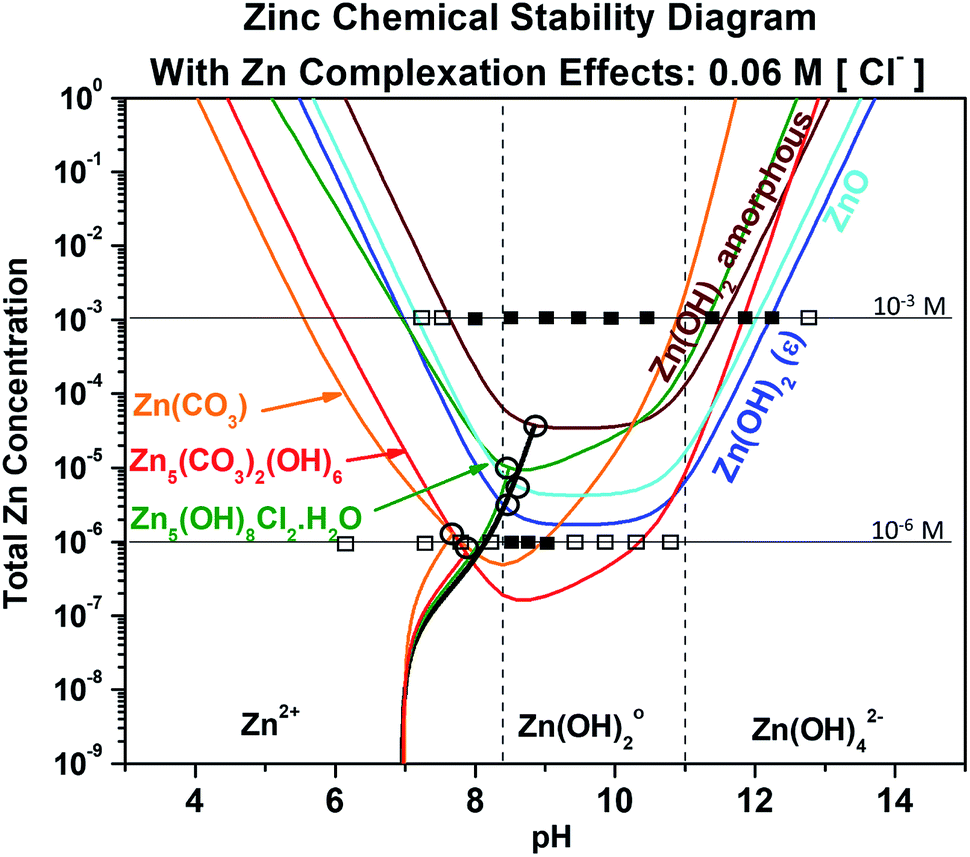
The effect of the chloride content and complexation was then re-evaluated by recalculating the chemical stability diagram for a dilute chloride concentration of 0.06 M at fixed dissolved carbonate concentration of 5 mM, as shown in Fig. 5. The first readily observed changes in the chemical stability trends are that the ZnO and Zn(OH)2 trends flatten in the neutral region, and the minima in zinc ion concentration required to reach equilibrium of the carbonate-/chloride-containing corrosion products shift towards pH of ∼8.5. Under these dilute chloride conditions these minima also decrease the Zn ion requirement for equilibrium by half an order of magnitude. The combination of these changes causes intersection of the Zn5(CO3)2(OH)6 and Zn(OH)2 (epsilon) stability curves with the chemical trajectory trends near their minima, suggesting that formation of these phases may occur at increasingly lower [ZnTot] until an initial pH of approximately 8 in the bulk system. The experimental titration results are overlaid with the thermodynamic predictions in Fig. 5 for the [ZnTot] of 10−3 M and 10−6 M. For the 10−3 M case, these results show better correlation with thermodynamic predictions in the alkaline pH range than in the near-neutral/acidic region. Specifically, the Zn corrosion products do not form as predicted below pH ≈ 8. In the 10−6 M [ZnTot] data, similar differences are present, namely a reduced pH range of solid product formation than thermodynamically predicted.
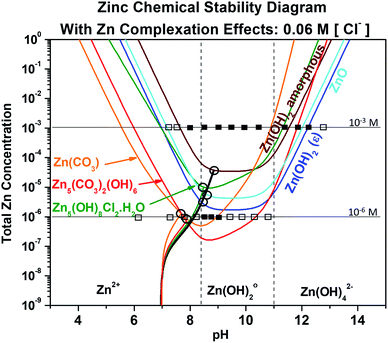 |
| | Fig. 5 Chemical stability diagram for the Zn–water system. Relevant species are given for exposure in a Cl− (0.06 M) and CO32− (5 mM) containing environment. This diagram includes the effect of ligand complexation on the stability of the zinc compounds. Included are chemical dissolution trajectories which describe how the solution chemistry progresses to some initial condition (pH = 7, [ZnTot] = 10−8) to a final equilibrium condition (where the trajectory intersects an equilibrium line). The trajectory line color matches that of the compound being tracked with respect to concentration and pH (black corresponds to both Zn(OH)2 and ZnO due to the expense of their trajectory being the same (Table 1)). For 10−3 M and 10−6 M aqueous Zn concentration, titration data are overlaid with the model predictions, where (□) means completely solubilized and (■) means that solid Zn corrosion product formed. | |
4.3 Chemical stability as a function of complexation and curvature
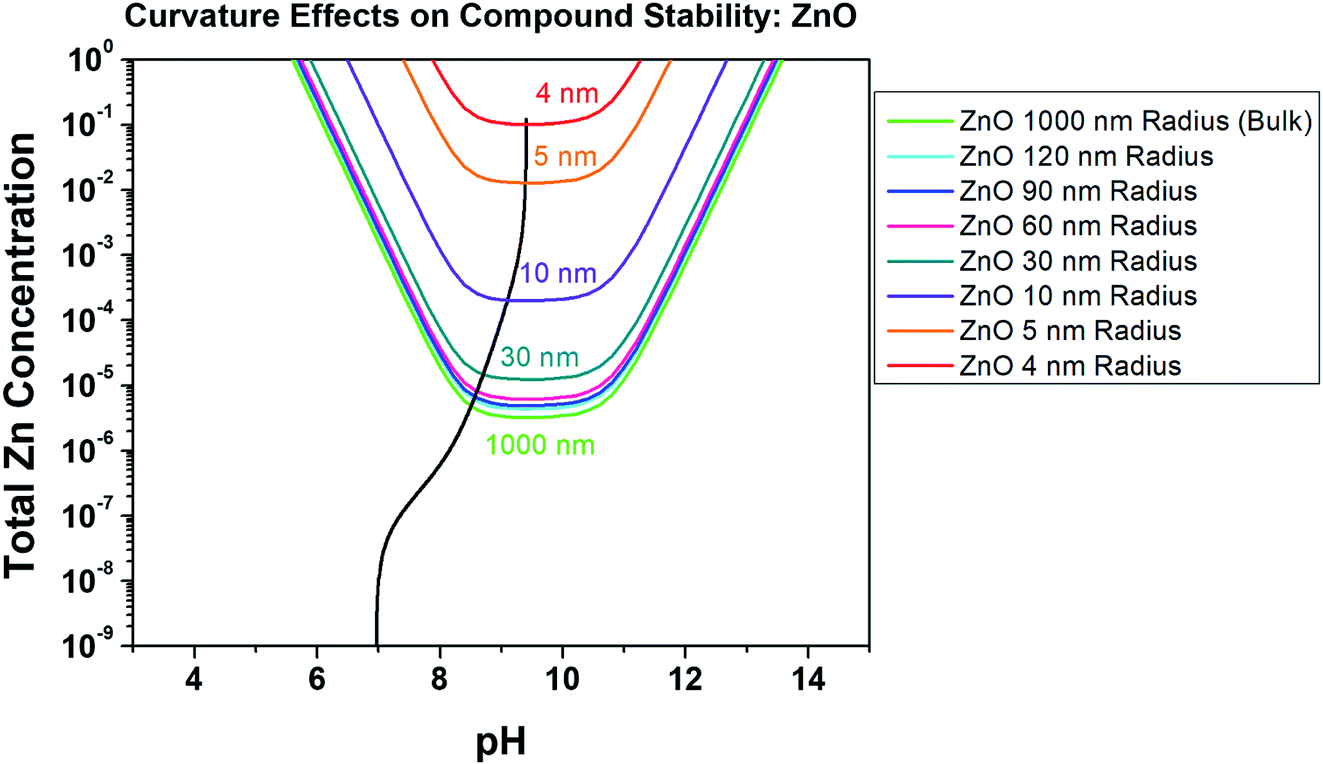
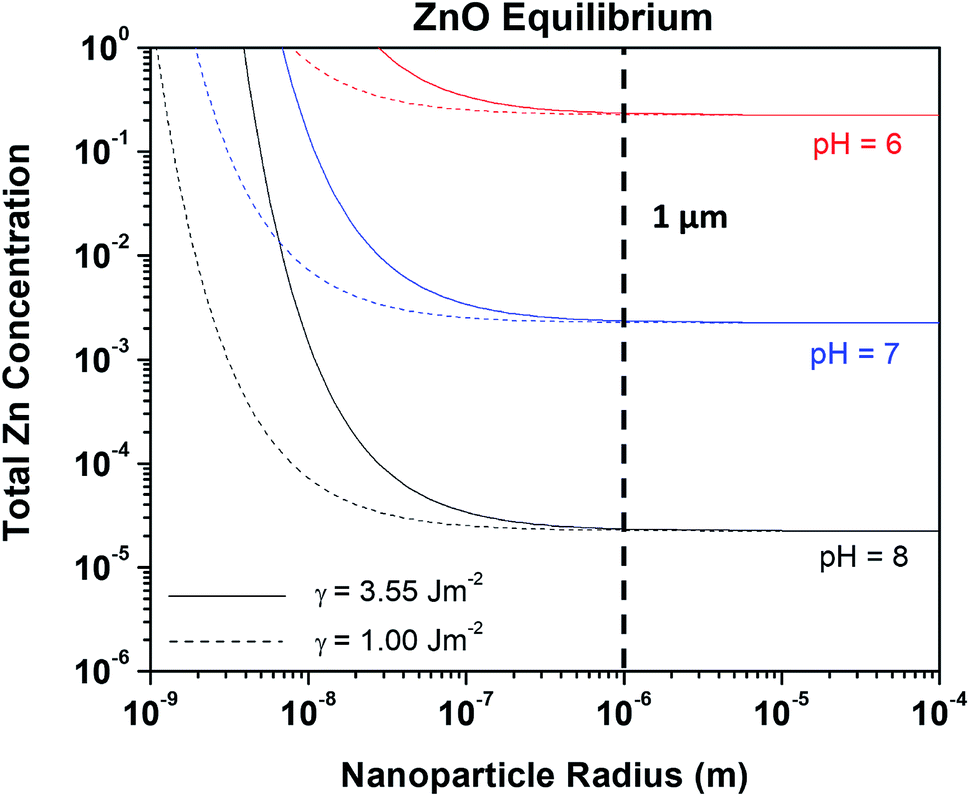
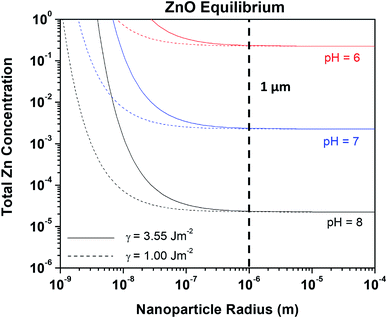
Nanoparticles of ZnO are being increasingly utilized in the biomedical, corrosion engineering, and energy sectors, and their formulation can be both dangerous due to high reactivity and costly.16,36 For this reason, ZnO has been thoroughly studied in terms of production pathways, quality, and the effects of different production methods on particle size and surface reactivity/energy.31 One theoretical study found that the surface energy of ZnO on the relaxed (111) plane at 298 K remains relatively constant at 3.55 J m−2,27 which we utilized here to evaluate the Znaq requirement for ZnO nanoparticle equilibrium as a function of radius, Zn2+ and pH. This Gibbs–Thompson-based chemical stability prediction is shown in Fig. 6, demonstrating the increase in the required [ZnTot] for ZnO nanoparticle equilibration at increasingly small radii. Specifically, a ZnO nanoparticle with radius of 4 nm at pH 9.5 is soluble at roughly four orders of magnitude greater [ZnTot] in the bulk solution than is a nanoparticle having radius of 30 nm, and therefore is less thermodynamically stable. As the ZnO surface energy is fixed here at a value theoretically calculated in vacuum, the effect of utilizing a different γ value was evaluated in Fig. 7. These predictions demonstrate that there is an observable effect on the equilibrium requirement for ZnO nanoparticles in terms of [ZnTot] and pH conditions by changing γ from 3.55 J m−2 to 1.00 J m−2, however this effect only exists at radii less than 1 micrometer (10−6 m). These findings are comparable to experimental findings present in the literature, as will be explored in the Discussion.
 |
| | Fig. 6 Chemical stability diagram for ZnO at various particle radii at the nanometer scale, illustrating the effect of surface curvature on the stability ([ZnTot], pH) phase field at a constant surface energy of 3.55 J m−2.27 Included in the solid black line is the chemical trajectory trend for a starting pH of 7, [ZnTot] = 10−8. This thermodynamic calculation assumes a constant temperature of 298 K and spherical capillarity effects on a (111), relaxed lattice ZnO surface condition. A [Cl−] of 0.06 M is considered here. | |
 |
| | Fig. 7 Line plot demonstrating the effect of ZnO particle radius on the equilibrium [ZnAq]Tot stability requirement. The effect of varying surface energy is given by the trends produced for the two different surface energy values (eqn (5)). | |
5. Discussion
Zinc remains a consistently utilized metal today, with ever diversifying applications pertaining to health, biotechnology, and energy. With these diverse needs comes the demand to understand Zn corrosion and the formation of specific oxidation products in changing electrochemical conditions and saline environments, as these changes may be either beneficial or detrimental to component performance. In studies on Zn-rich primers (ZRPs), for instance, not only are certain products such as Zn5(CO3)2(OH)6 known to be more passivating and protective than others,13 but each corrosion product will also have a characteristic volume increase associated with its formation that is known to affect coating porosity, Zn pigment connectivity, and the electrolyte ingress necessary for pigment activation to achieve effective corrosion protection on vital alloys such as steel.13,37–43 Comparison of the present modeling results with experimental findings on Zn in the literature will enlighten the reader as to the accuracy and utility of these new developments to advance the scope of the chemical stability diagram. Furthermore, comparison will be drawn from the wide spectrum of literature on ZnO nanoparticle formation19,31,36,44 to discuss the potential for utilizing the Gibbs–Thompson rederivation of the ZnO chemical stability diagram.
Titration results provided initial insight into the utility of the present thermodynamic calculations to predict solid Zn-based corrosion product formation in NaCl. In order to further understand the utility of the presently developed chemical stability diagram methods, a thorough literature review will demonstrate notable experimental results and trends for the pure Zn system. Experimental studies demonstrate that Zn corrosion is largely dictated by anionic surface chemistry and bulk pH conditions, and that reaction kinetics play a significant role only in select situations, which suggests that chemical stability diagrams could be a valuable predictive tool when accurately applied to the Zn system.12,30,45,46 At pH lower than 5.0 or higher than 13.5, little to no corrosion product formation typically occurs on Zn.12,47 At more intermediate pH values, experimental results have shown that Zn easily forms carbonate species, as dictated by the absorption and presence of CO32− in the electrolyte.13,45 These findings on pure Zn agree with alternate immersion studies on ZRPs, which find an increasing presence of CO3-containing Zn corrosion product formation with increased drying time (and thus increasing concentration of dissolved CO32− in the surface film).13,37 Ohtsuka and Matsuda demonstrated through use of in situ Raman spectroscopy that ZnO and Zn(OH)2 (epsilon) readily form on the Zn surface during dry air exposure, and as the relative humidity (RH) is increased to 75% Zn5(CO3)2(OH)6 also forms.37 At continuous RH of 80% or more, only Zn5(OH)8Cl2·H2O and aqueous ZnCl02 formation occur on the Zn surface.37 When drying cycles are introduced intermittent to the establishment of 88% RH, a combination of ZnO, Zn5(CO3)2(OH)6, Zn5(OH)8Cl2·H2O, and aqueous ZnCl02 are found on the Zn surface, with the amount of Zn5(CO3)2(OH)6 increasing as greater drying to wetting ratio was allowed.37 Mouanga et al. and Ligier et al. also demonstrated that Zn5(CO3)2(OH)6 and Zn5(OH)8Cl2·H2O were the major corrosion products formed on pure Zn following atmospheric exposure in dilute chloride, which is supported in the literature by the known transformation of Zn(OH)2/ZnO to these more complex products as a function of dissolved carbonate content.13,48 In agreement with these proposed mechanisms, Marchebois et al. demonstrated that the formation of ZnO occurs quickly on pure Zn in full simulated seawater immersion, followed by the formation of increasing amounts of Zn5(OH)8Cl2·H2O with time.40 The presently developed Zn chemical stability diagrams predict many of these experimental results and demonstrate strong utility for the thermodynamically-dictated Zn system.
Chemical stability diagrams are based on thermodynamic stability and cannot communicate the influence of kinetics in the formation of Zn corrosion products. However, cross comparison of these diagrams with the extensive experimental evidence present in the literature can suggest the utility of these diagrams where stability, rather than kinetics, is dominant, and can infer where the electrochemical kinetics may be necessary to obtain the equilibrium Zn concentration. Fig. 5 demonstrates that during dilute chloride immersion of the Zn surface, the formation of any Zn corrosion products outside of the pH value range of 4.5 to 13.5 would require 1 or more moles of aqueous Zn content. The low probability of such a high Zn ion concentration being present agrees with the experimental findings showing that little to no corrosion product forms outside the pH range of 5.0 to 13.5.47 In dilute alkalinity, such as in the conditions which may occur where low RH is present, Fig. 5 predicts the formation of Zn(OH)2 (epsilon) followed by ZnO. This prediction is in agreement with Ohtsuka and Matsuda.37 However, the dominance of ZnO formation with increasing exposure time suggests that Zn(OH)2 (epsilon) is affected more by kinetic limitations such that ZnO is more readily formed. Additionally, it is possible that the assumed thermodynamic variables utilized here may not accurately reflect experiment, as the conventional chemical potential for NiO was recently revisited using first-principle modelling.7 When RH < 80% is present, Zn5(CO3)2(OH)6 coexists with ZnO and Zn(OH)2 in the presence of NaCl salt, which directly agrees with Fig. 5 at pH of 10.7 or less. The acidification of the chloride solution to achieve pH less than 10.1 would agree with the known effects of atmospheric CO2 aqueous absorption to form carbonic acid, known on a large scale as the ocean acidification process.28 When utilizing the chemical trajectory trends from the example starting condition of pH 7.0, the Zn(OH)2 (epsilon)/ZnO formation (solid black trajectory line) would begin at more alkaline pH (8.30/8.55) than the formation of Zn5(CO3)2(OH)6 (solid red trajectory line) (pH 8.00). Given a condition of sufficient wetting to increase [Cl−], the Zn(OH)2 (epsilon), ZnO, and Zn5(CO3)2(OH)6 trends would shift slightly towards more alkaline values and Zn5(OH)8Cl2·H2O formation would more readily occur (Fig. 4). These trends are also in agreement with the results of Ohtsuka and Matsuda, wherein increased RH caused the stabilization of aqueous ZnCl02 and Zn5(OH)8Cl2·H2O in the thin film.37 As illustrated in Fig. 1, aqueous ZnClx species predominate at pH 9.8 or less in conditions of high [Cl−], and in saturated NaCl conditions Fig. 4 would predict that Zn5(OH)8Cl2·H2O stability would be reached prior to Zn(OH)2 (epsilon)/ZnO equilibration at pH 9.0 or less. Specifically, recalculation of these ion predominance relations demonstrates that aqueous ZnCl02 is the most abundant species when [Cl−] is between 0.7 M and 1.2 M.
The thermodynamic predictions presented here also correlate well with long-term, controlled atmospheric exposure results on pure Zn where the [Cl−] and/or [CO32−] were limited. Qu et al. deposited dilute amounts of NaCl on the Zn surface and held 80% RH using purified water vapor and air for 25 hours, which resulted in the formation of ZnO and Zn5(OH)8Cl2·H2O.49 Svensson and Johansson performed similar experiments on pure Zn but for 420 hours at 70% RH, and only Zn5(OH)8Cl2·H2O was observed through X-ray diffraction regardless of the amount of NaCl deposited on the Zn surface prior to exposure.50 In light of the known transformation of ZnO/Zn(OH)2 with increasing exposure time, these results agree well with Fig. 5 for the initial pH of 7 due to the lack of carbonate species introduced during these experiments. Specifically, these thermodynamic predictions would dictate that ZnO would begin to form at pH of 8.5 and [Znaq] of 6 × 10⁻⁶ M, while Zn5(OH)8Cl2·H2O formation would require higher concentration, [Znaq] of 1 × 10⁻⁵ M, at pH 8.5. In the case of Svensson and Johansson, additional salt deposition at 75% RH would increase [Cl−] towards saturation, which would explain the dominance of the Zn5(OH)8Cl2·H2O formation; as [Cl−] increases, Zn5(OH)8Cl2·H2O becomes more stable than ZnO at pH below 10.0 as seen in the high [Cl−] case of Fig. 4.50 Ligier et al. evaluated pure Zn corrosion product formation following exposure to simulated atmospheric electrolytes containing 5 × 10⁻³ M NaHCO3/1 × 10−3 H2O2 and 2 × 10⁻¹ M NaCl/5 × 10−3 NaHCO3/1 × 10−3 M H2O2 for 4 days, and demonstrated that the amount of Zn5(CO3)2(OH)6 formed on Zn depends on the [Cl−] concentration, as Zn5(OH)8Cl2·H2O formation quickly dominates.13 These results do not correlate well with the dilute [Cl−] or saturated [Cl−] prediction shown in Fig. 4 and 5 for an initial pH of 7, suggesting that kinetic limitations may have more effect in Zn5(CO3)2(OH)6 than in Zn5(OH)8Cl2·H2O formation; perhaps with a difference in CO32−/Cl− diffusivity. None of the aforementioned atmospheric exposures resulted in the formation of ZnCO3, despite this corrosion product being the most stable from pH 4.0 to 7.7 in dilute chloride and from pH 5.7 to 7.8 in saturated chloride conditions (Fig. 4 and 5). However, the 13–16 year marine exposures conducted on pure Zn by de la Fuente et al. demonstrate ZnO, ZnCO3, and Zn5(OH)8Cl2·H2O formation, suggesting that either the previous experiments did not reach sufficiently low pH or that ZnCO3 has slow formation kinetics.51
The present diagrams focus solely on a chloride-based saline environment with equilibrium carbonate concentration of 5 mM (adjustable to consider more dilute cases), which does not include the effects of impurities present in the electrolyte such as sulfur, less common corrosion product formation, or changing temperature (all calculations done at 25 °C) (for more detail on the assumptions see the ESI†). However, further advancement of these diagrams to incorporate such effects will prove useful for predicting Zn corrosion in unique settings, such as for the design of effective cathodic protection systems. Modern developments in the use of ZnO have produced a much wider spectrum of uses for this material, however, in which the chemical stability diagram based on the Gibbs–Thompson rederivation may also prove useful to predict performance.
Zinc oxide has the unique duality of a large direct band gap and the ability to form nanostructures, making the applications for this material far-reaching: ranging from drug delivery and cancer therapy to piezoelectric power generation and spintronics.31 Considerable research has been dedicated to expanding the growth and production procedures as well as to discover new applications for ZnO, especially when used in the form of nanoparticles and nanorods.31,35,44 Such research is motivated by the strong tunability of the size, shape, and morphology of ZnO crystals in solutions such as ZnAc2.31,35 Specifically, in this solution the ZnO size, density, growth uniformity, and crystal morphology may be tuned via control of the ZnAc2 concentration and the solution pH through addition or subtraction of NH4OH.31 Despite the typical use of organic solutions to contain the ZnO formation reactions, common ZnO growth trends exist that enable correlation with the present thermodynamic analysis in aqueous Cl-based environment.
Fig. 6 demonstrates the concept of the curvature-dependent chemical stability diagram derivation in NaCl for comparison to the bulk thermodynamic predictions shown in Fig. 3–5, demonstrating that as much as 5 orders of magnitude increase in aqueous Zn concentration is necessary for ZnO to be thermodynamically stable in Cl-containing environment at increasing nanoscale size, from the bulk (greater than 1 micrometer) to 4 nm particle radius. These predictions also demonstrate that the dependence of ZnO solubility on surface curvature is greater than the effect of [Cl−] complexation, which is supported by the results of ZnO synthesis studies utilizing various ZnO precipitation methods in non-chloride-containing solutions. Moazzen et al. observed that the average ZnO nanoparticle size produced in Zn acetate dihydrate + sodium hydroxide solution increased as the ratio of Zn acetate dihydrate to sodium hydroxide was decreased from 1:1 (20 nm ZnO particle size) to 1:4 (36 nm ZnO particle size).52 When hydrothermally growing ZnO nanorods in Zn acetate and ammonia, Tay et al. observed increasingly smaller, denser ZnO nanorods forming as the Zn acetate concentration was increased for a given concentration of ammonia following three hours at 370 K.35 Tay et al. utilized curvature relations based in nucleation theory as well as a basic Zn chemical stability diagram prediction to support and explain these findings, which arrived at similar conclusions as seen here.35 Recent work in lead-based systems has demonstrated utility of curvature-based solubility relationships for determining nanoparticle formation as well.53 These results also illuminate the effect of surface energy on the stability of capillary-affected surfaces. Fig. 7 illustrates that larger concentrations of aqueous Zn are indeed for surfaces with higher surface energy. The curvature-dependent derivation illustrated here may easily be expanded to offer further insight into mechanisms underlying ZnO growth in more favorable and economically viable media (out of the scope of the present work), especially as the solubility constants necessary for such mathematical constructs are increasingly available for the Zn species of interest to ZnO growth.21,22,54,55
6. Conclusion
The chemical stability diagram concept has been advanced within the present work to encompass (1) “actual” solubility through accounting for all known species complexes; (2) chemical trajectories based on complex elemental ratios and present species which predict pH and Mn+ conditions where specific corrosion products are expected to be in equilibrium with specific compounds, as well as the Mn+ and pH ranges where these products are soluble, and (3) the dependence of solubility on surface curvature relevant to the prediction of nanoscale growth and morphology. The utility of this method was demonstrated for the corroding Zn system on the bulk scale, and for the ZnO system at the nanoscale in NaCl environment. These thermodynamic bulk scale predictions correlate relatively well with experiment for the Zn system in NaCl where reaction kinetics are likely to have a limited role, and suggest that the chemical stability diagram method should continue to be advanced for more accurate understanding of reaction trends in technologically relevant metals and corrosion systems.
Data availability statement
All thermodynamic constants utilized in the present work may be found in raw form in the references provided, or derived from the raw form using methods described in the ESI.† Calculations generated during this study are available in an open access data repository, which can be accessed at DOI: 10.17605/OSF.IO/Y39U6.
Author contributions
All authors contributed to the derivation and construction of these chemical stability diagrams, as well as to the structure and composition of this manuscript. M. E. M. provided literature review of Zn corrosion and drafted the paper. R. J. S. Jr provided literature review of publications utilizing speciation and/or chemical stability methods, created the graphical abstract, and modified the manuscript. J. R. S. reviewed, edited, and modified the manuscript.
Conflicts of interest
The authors declare no competing interests.
Acknowledgements
The authors are grateful for the financial support and contribution of the United States Office of Naval Research [Award # N000141512491] under the direction of Dr Airan Perez, the United States Office of the Undersecretary of Defense Corrosion University Pilot Program [Award # FA7000-14-2-0010] under the direction of Mr Daniel Dunmire, and the National Science Foundation [Award # NSF DMR #1309999].
References
- F. M. Toma, J. K. Cooper, V. Kunzelmann, M. T. McDowell, J. Yu, D. M. Larson, N. J. Borys, C. Abelyan, J. W. Beeman, K. M. Yu, J. Yang, L. Chen, M. R. Shaner, J. Spurgeon, F. A. Houle, K. A. Persson and I. D. Sharp, Nat. Commun., 2016, 7, 1–11 CrossRef PubMed.
- M. Schuisky and A. Harsta, J. Electrochem. Soc., 1998, 145, 4234–4239 CrossRef CAS.
- D. G. Kinniburgh and D. M. Cooper, Environ. Sci. Technol., 2004, 38, 3641–3648 CrossRef CAS PubMed.
- J. D. Hem, Hydrol. Sci. J., 1960, 5, 45–53 Search PubMed.
- H. L. Bohn, R. A. Myer and G. A. O'Connor, in Soil Chemistry, John Wiley & Sons, Inc., New York, 3rd edn, 2001, pp. 201–206 Search PubMed.
- M. Pourbaix, Atlas of Electrochemical Equilibria in Aqueous Solutions, National Association of Corrosion Engineers, 1974 Search PubMed.
- L. F. Huang, M. J. Hutchison, R. J. Santucci, J. R. Scully and J. M. Rondinelli, J. Phys. Chem. C, 2017, 121, 9782–9789 CrossRef CAS.
- R. J. Santucci, M. E. McMahon and J. R. Scully, npj Mater. Degrad., 2018, 2, 1 CrossRef.
- P. Plagemann, J. Weise and A. Zockoll, Prog. Org. Coat., 2013, 76, 616–625 CrossRef CAS.
- J. Lin, D. Battocchi and G. P. Bierwagen, Corrosion, 2017, 73, 408–416 CrossRef CAS.
- W. Xu, N. Birbilis, G. Sha, Y. Wang, J. E. Daniels, Y. Xiao and M. Ferry, Nat. Mater., 2015, 14, 1229–1235 CrossRef CAS PubMed.
- X. G. Zhang, Corrosion and Electrochemistry of Zinc, Plenum Press, New York, 1st edn, 1996 Search PubMed.
- V. Ligier, M. Wéry, J.-Y. Hihn, J. Faucheu and M. Tachez, Corros. Sci., 1999, 41, 1139–1164 CrossRef CAS.
- A. A. Bagabas, R. M. Mohamed, M. F. A. Aboud, M. M. M. Mostafa, A. S. Alshammari and Z. A. Al-Othman, US Pat., 8361324, 2013.
- K. S. Suganthi, Flexible Printed Electron., 2018, 3, 1–11 Search PubMed.
- H. Agarwal, S. Venkat Kumar and S. Rajeshkumar, Resour.-Effic. Technol., 2017, 3, 406–413 CrossRef.
- W. Salem, D. R. Leitner, F. G. Zingl, G. Schratter, R. Prassl, W. Goessler, J. Reidl and S. Schild, Int. J. Med. Microbiol., 2015, 305, 85–95 CrossRef CAS PubMed.
- P. K. Mishra, H. Mishra, A. Ekielski, S. Talegaonkar and B. Vaidya, Drug Discovery Today, 2017, 22, 1825–1834 CrossRef CAS PubMed.
- A. Król, P. Pomastowski, K. Rafińska, V. Railean-Plugaru and B. Buszewski, Adv. Colloid Interface Sci., 2017, 249, 37–52 CrossRef PubMed.
- F. Verbakel, S. C. J. Meskers and R. A. J. Janssen, J. Appl. Phys., 2007, 102, 083701 CrossRef.
- S. Hagemann, Entwicklung eines thermodynamischen Modells für Zink, Blei und Cadmium in salinaren Lösungen, Gesellschaft für Anlagen- und Reaktorsicherheit, (GRS) mbH, Berlin, 1st edn, 2012 Search PubMed.
- G. S. James, Lange's Handbook of Chemistry, New York, 17th edn, 2017 Search PubMed.
- B. E. Conway, Electrochemical Data, Elsevier, Houston, 1952 Search PubMed.
- K. J. Kim, P. B. Kreider, C. Choi, C. H. Chang and H. G. Ahn, RSC Adv., 2013, 3, 12702–12710 RSC.
- C. H. Choi, J. B. Levin and C. H. Chang, CrystEngComm, 2016, 18, 8645–8652 RSC.
- S. E. A. Sharaf El-Deen, S. I. Moussa, Z. A. Mekawy, M. K. K. Shehata, S. A. Sadeek and H. H. Someda, Radiochim. Acta, 2017, 105, 43–55 CAS.
- C. Tang, M. J. S. Spencer and A. S. Barnard, Phys. Chem. Chem. Phys., 2014, 16, 22139–22144 RSC.
- S. E. Manahan, Environmental Chemistry, CRC Press, New York, 8th edn, 2005 Search PubMed.
- I. Odnevall Wallinder and C. Leygraf, Corrosion, 2017, 73, 1060–1077 CrossRef.
- S. Thomas, N. Birbilis, M. S. Venkatraman and I. S. Cole, Corrosion, 2012, 68, 015009 CrossRef.
- Z. C. Feng, Handbook of Zinc Oxide and Related Materials: Volume 1, Materials, CRC Press, New York, 2013 Search PubMed.
- P. Volovitch, C. Allely and K. Ogle, Corros. Sci., 2009, 51, 1251–1262 CrossRef CAS.
- M. Bockelmann, L. Reining, U. Kunz and T. Turek, Electrochim. Acta, 2017, 237, 276–298 CrossRef CAS.
- S. Thomas, N. Birbilis, M. S. Venkatraman and I. S. Cole, Corros. Sci., 2013, 69, 11–22 CrossRef CAS.
- C. B. Tay, S. J. Chua and K. P. Loh, J. Cryst. Growth, 2009, 311, 1278–1284 CrossRef CAS.
- R. Brayner, S. A. Dahoumane, C. Yéprémian, C. Djediat, M. Meyer, A. Couté and F. Fiévet, Langmuir, 2010, 26, 6522–6528 CrossRef CAS PubMed.
- T. Ohtsuka and M. Matsuda, Corrosion, 2003, 59, 407–413 CrossRef CAS.
- O. Ø. Knudsen, U. Steinsmo and M. Bjordal, Prog. Org. Coat., 2005, 54, 224–229 CrossRef CAS.
- H. Marchebois, S. Joiret, C. Savall, J. Bernard and S. Touzain, Surf. Coat. Technol., 2002, 157, 151–161 CrossRef CAS.
- H. Marchebois, C. Savall, J. Bernard and S. Touzain, Electrochim. Acta, 2004, 49, 2945–2954 CrossRef CAS.
- S. Feliu, M. Morcillo and S. Feliu, Corrosion, 2001, 57, 591–597 CrossRef CAS.
- S. J. Feliu, R. Barajas, J. M. Bastidas, M. Morcillo and S. Feliu, Electrochem. Impedance Anal. ans Interpret. ASTM STP 1188, 1993, pp. 438–449 Search PubMed.
- E. Diler, B. Rouvellou, S. Rioual, B. Lescop, G. Nguyen Vien and D. Thierry, Corros. Sci., 2014, 87, 111–117 CrossRef CAS.
- E. A. Meulenkamp, J. Phys. Chem. B, 1998, 102, 5566–5572 CrossRef CAS.
- T. E. Graedel, J. Electrochem. Soc., 1989, 136, 193–203 CrossRef.
- I. Suzuki, Corros. Sci., 1985, 25, 1029–1034 CrossRef CAS.
- B. E. Roetheli, G. L. Cox and W. B. Littreal, Met. Alloys, 1932, 3, 73–76 CAS.
- M. Mouanga, P. Berçot and J. Y. Rauch, Corros. Sci., 2010, 52, 3984–3992 CrossRef CAS.
- Q. Qu, C. Yan, Y. Wan and C. Cao, Corros. Sci., 2002, 44, 2789–2803 CrossRef CAS.
- J. E. Svensson and L. G. Johansson, Corros. Sci., 1993, 34, 721–740 CrossRef CAS.
- D. de la Fuente, J. G. Castano and M. Morcillo, Corros. Sci., 2006, 49, 1420–1436 CrossRef.
- M. A. M. Moazzen, S. M. Borghei and F. Taleshi, Appl. Nanosci., 2013, 3, 295–302 CrossRef.
- C. Dai, J. Zhao, D. E. Giammar, J. D. Pasteris, X. Zuo and Y. Hu, ACS Earth Space Chem., 2018, 2, 869–877 CrossRef CAS.
- A. E. Martell and R. M. Smith, Critical Stability Constants, Plenum Press, New York, 6th edn, 1989 Search PubMed.
- R. Fernandez-Prini, A. H. Harvey and D. A. Palmer, Aqueous Systems at Elevated Temperatures and Pressures, Elsevier, New York, 2004 Search PubMed.
Footnote |
| † Electronic supplementary information (ESI) available. See DOI: 10.1039/c9ra00228f |
|
| This journal is © The Royal Society of Chemistry 2019 |
Click here to see how this site uses Cookies. View our privacy policy here. 
 Open Access Article
 This Open Access Article is licensed under a Creative Commons Attribution-Non Commercial 3.0 Unported Licence
 *,
R. J. Santucci Jr and
J. R. Scully
*,
R. J. Santucci Jr and
J. R. Scully


 quantifies the fraction of available CO32− in a similar fashion as eqn (11). For the calculation of the remaining chemical trajectories necessary to describe the corroding Zn system, the a