 Open Access Article
Fe(II) and Mn(II) removal by Ca(II)–manganite (γ-MnOOH)-modified red mud granules in water
Yingying Sua,
Qi Zhu *a,
Jian Lia,
Dongdong Wanga,
Zipeng Xing*a and
Lei Fang*b
aSchool of Chemistry and Materials Science, Key Laboratory of Chemical Engineering Process & Technology for High-efficiency Conversion, Heilongjiang University, China. E-mail: hdzhuqi@126.com; xzphit@126.com; cherry1999_0@163.com
bSchool of Food Engineering, Harbin University, Harbin 150080, China
First published on 2nd April 2019
Abstract
In this study, a material (DLRMG) was synthesized by modifying Ca2+ and manganite (γ-MnOOH) on red mud granules (RMG), which were the main raw materials derived from industrial alumina. Moreover, a series of experiments were conducted on the adsorption of Fe2+ and Mn2+ in underground water. The prepared samples were analyzed by X-ray diffraction (XRD), thermogravimetric analysis-differential thermal analysis (TG-DTA), zeta potential analysis, BET and scanning electron microscopy (SEM); the concentration of the effluent was found to be of acceptable standard after the treatment. DLRMG continued to treat fluoride wastewater even after the saturated adsorption of Fe2+ and Mn2+, and the results clearly showed that the treatment was effective. Overall, the problems of red mud stockpile and pollution in China would be effectively controlled by DLRMG.
1. Introduction
Groundwater is a major source of water for industrial use, agricultural production and residents in China; it usually has adequate quality as it is filtered and adsorbed by the strata and not readily affected by human activities; however, due to the overall improvement of industry and agriculture, the pollution of groundwater is becoming a significantly serious concern. In this regard, an effective treatment of groundwater has drawn significant attention.1,2 Groundwater is generally hypoxic and weakly alkaline under natural conditions. The regional groundwater that flows through the minerals, rocks and other substances often contains elements, such as Fe2+ and Mn2+, owing to the physical and chemical reactions; moreover, some metal ions enter groundwater via various ways due to the continuous flow of groundwater, and this leads to an increase in the concentration of metal ions in groundwater beyond the safety standards. In addition, the industrial and agricultural pollution can exacerbate groundwater pollution.The major source of drinking water in rural areas is groundwater, and the existing status of Fe2+ and Mn2+ in groundwater exceeds the safety standards in some areas;3,4 according to the drinking water health standards of China (GB54789-2006), the Fe2+ content in drinking water should not be more than 0.3 mg L−1 and the Mn2+ content in drinking water should not be more than 0.1 mg L−1 because water containing Fe2+ and Mn2+ in excess is harmful for drinking in the long run. An excessive intake of Fe2+ and Mn2+ can result in osteoporosis, liver cirrhosis, Parkinson's disease and damage to the central nervous system of humans, leading to organ damage;5–7 in addition, excess Fe2+ and Mn2+ in water can lead to mass problems in some aspects of industrial production. In industrial production, groundwater containing Fe2+ and Mn2+ should not be used as boiler water. Fe2+ and Mn2+ will form scales, which will affect the energy transfer, reduce the production efficiency, and even block the cooling pipe. In the textile industry, the use of untreated water containing Fe2+ and Mn2+ leads to the fixation of these ions to the fiber; this leaves rust on the fabric; during dyeing operations, Fe2+ and Mn2+ can bind to dyes and affect the dyeing process; in bleaching, Fe2+ and Mn2+ catalyze the decomposition of bleach; this makes bleaching difficult. During papermaking, the pulp turns yellow because of the adsorption of Fe2+ and Mn2+ between cellulose.8 Both Fe2+ and Mn2+ are transition elements and have the same valence electron configuration; therefore, Fe2+ and Mn2+ always co-exist in groundwater;9 the conventional methods for Fe2+ and Mn2+ processing include oxidation (biological oxidation, contact oxidation, and chemical oxidation), ion exchange, adsorption and so on;10–14 moreover, different treatment measures can be applied to treat various wastewaters; among these methods, adsorption is commonly used because of its simple operation, better removal effect, ease in recovery after adsorption and no secondary pollution. The selection of a proper adsorbent is crucial in the removal of heavy metals by adsorption; therefore, the selection of an excellent adsorbent has become a hot topic of research in the scientific community. At present, the main adsorbents used are activated carbon, zeolite, fly ash and so on.15–17
Red mud produced by the alumina industry generates significant waste.18,19 Red mud is easily available and can function as an efficient filtration material through a simple treatment. Numerous studies have shown that red mud has a good treatment effect on the adsorption of heavy metals (e.g., arsenic, lead, and cadmium), various salts (e.g., sulfate and nitrate) and organic pollutants due to its sustainable use, porous surface structure, and easy separation from muddy water;20–22 this solves the problem of disposal of excessive red mud, and the resource utilization of waste can be achieved; therefore, the use of pulverized coal and bentonite-prepared red mud ball for the filtration of drinking water has significant benefits. In previous studies, red mud has been used as a functional filter material to remove pollutants from water.23 Based on the abovementioned facts, herein, the synthesis of a new material via impregnation of Ca2+ and γ-MnOOH on RMG was carried out, and the resultant material could effectively remove excess Fe2+ and Mn2+ from water; moreover, the RMG filter material could be recycled and retreated; herein, the Fe2+ and Mn2+ contents of the water sample were adjusted according to those in the underground drinking water in small towns to simulate the actual groundwater conditions.24,25 A series of batch experiments for the optimization of several parameters, including adsorption time, solution pH and adsorbent addition dosage, were designed. The surface properties of the DLRMG and the mechanism of Fe2+ and Mn2+ removal have been discussed using various testing methods. The impregnation of Ca2+ and γ-MnOOH onto RMG is a new research topic, which has not been reported to date. In addition, it was of vital importance to retreat the filter material after saturation adsorption. There was also a small amount of excess F− in groundwater, and excessive intake of F− could cause a series of adverse effects on people such as on teeth and bones;26 finally, to achieve recycling of the filter media, saturated adsorptions of Fe2+ and Mn2+ filter media were conducted during the treatment of F− in water.
2. Material and methods
2.1 Chemicals and materials
The red mud raw materials used in this experiment were obtained from China Shandong Aluminum Industry Company. Polyvinyl alcohol (PVA), bentonite, hydrochloric acid, acetic acid, concentrated sulfuric acid, polyethylene glycol-400, hydroxylamine hydrochloride, 1,10-phenanthroline monohydrate, potassium, pyrophosphate, potassium periodate, ammonia water, sodium salt, potassium permanganate, sodium hydrogen sulfite, sodium fluoride, sodium nitrate, and calcium chloride were obtained from Tianjin Kermel Reagent Co. and were of analytical grade; all the solutions in the experiments were prepared using deionized water.2.2 Characterization methods
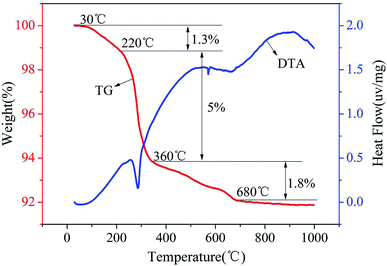
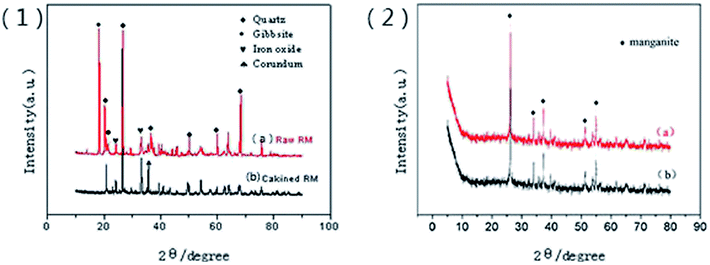
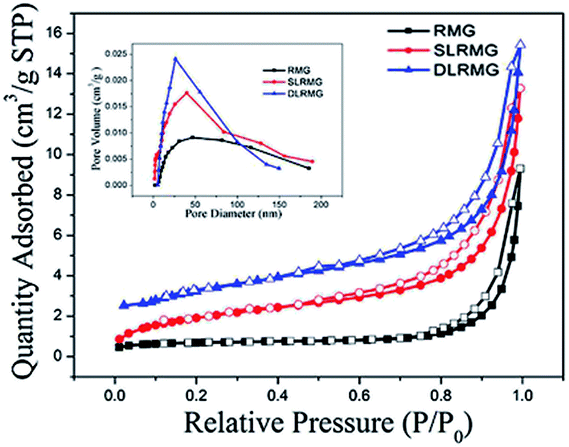
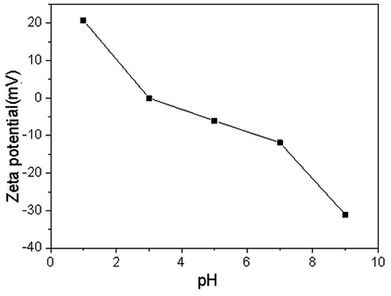
The composition of red mud was investigated using X-ray fluorescence analysis (PANalytical, AXIOS-PW4400, The Netherlands), and the results are shown in Table 1. The X-ray diffraction (XRD) patterns of the samples were obtained using the Rigaku D/max-IIIB X-ray diffractometer with Cu Kα radiation (λ = 1.5406 Å) generated at 40 kV and 20 mA. The Brunauer–Emmett–Teller (BET) surface areas of the samples were determined using the N2 adsorption isotherms obtained via the Micromeritics ASAP 2420 instrument, and the plot of the pore-diameter distribution was determined using the Barrett–Joyner–Halenda (BJH) method from the desorption branch of the isotherm. Micromorphological characteristics of the samples were characterized using the Hitachi S-4800 scanning electron microscope (SEM) with an accelerating voltage of 5.0 kV. The TG/DTA analysis was conducted using the Setaram-Labsys thermal analyzer. The surface charges of the supported sample were determined using a zeta-potential analyzer (Horiba, SZ-100Z, France). The amount of Fe was determined using a phenanthroline spectrophotometric method. The manganese ion content was measured using potassium periodate spectrophotometry. Fluorine was measured using an ion selective electrode method.| Composition | SiO2 | Fe2O3 | Al2O3 | Na2O | TiO2 | CaO | SO3 | K2O | P2O5 |
|---|---|---|---|---|---|---|---|---|---|
| Red mud | 36.338 | 28.030 | 22.846 | 8.864 | 1.781 | 1.078 | 0.399 | 0.121 | 0.168 |
2.3 Sample preparation
![[thin space (1/6-em)]](https://www.rsc.org/images/entities/char_2009.gif) :
:![[thin space (1/6-em)]](https://www.rsc.org/images/entities/char_2009.gif) 4
4![[thin space (1/6-em)]](https://www.rsc.org/images/entities/char_2009.gif) :
:![[thin space (1/6-em)]](https://www.rsc.org/images/entities/char_2009.gif) 6. A certain amount of the abovementioned mixture powder and polyvinyl alcohol were mixed and stirred at 70 °C until they were muddy and attained a shape like a sieve ball, which was about 1 mm in size.27 After drying, the spherical particles were placed in a muffle furnace, calcined at 1030 °C and then acquired.
6. A certain amount of the abovementioned mixture powder and polyvinyl alcohol were mixed and stirred at 70 °C until they were muddy and attained a shape like a sieve ball, which was about 1 mm in size.27 After drying, the spherical particles were placed in a muffle furnace, calcined at 1030 °C and then acquired.3. Results and discussion
3.1 Characterization of the sample
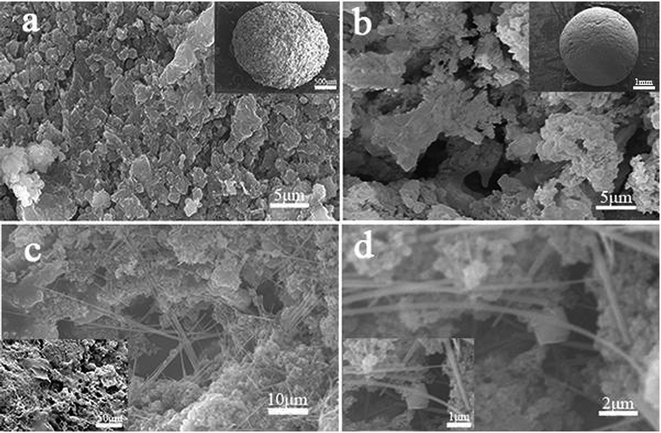 | ||
| Fig. 3 SEM images of (a) raw RMG, (b) sintered RMG, (c) γ-MnOOH single loaded on RMG, and (d) Ca2+ loaded on γ-MnOOH/RMG. | ||
| Name | BET surface area (m2 g−1) | Average pore width (nm) | Pore volume (cm3 g−) |
|---|---|---|---|
| RMG | 2.2529 | 26.2184 | 0.007 |
| SLRMG | 9.2422 | 12.4348 | 0.015 |
| DLRMG | 14.0702 | 9.6244 | 0.023 |
| RMG | DLRMG | After adsorption | |
|---|---|---|---|
| Zeta potentials | −10.97 | −13.51 | −8.99 |
3.2 Characteristics of the modified RMG in the Fe2+ and Mn2+ removal process
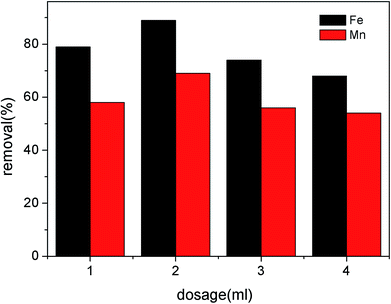
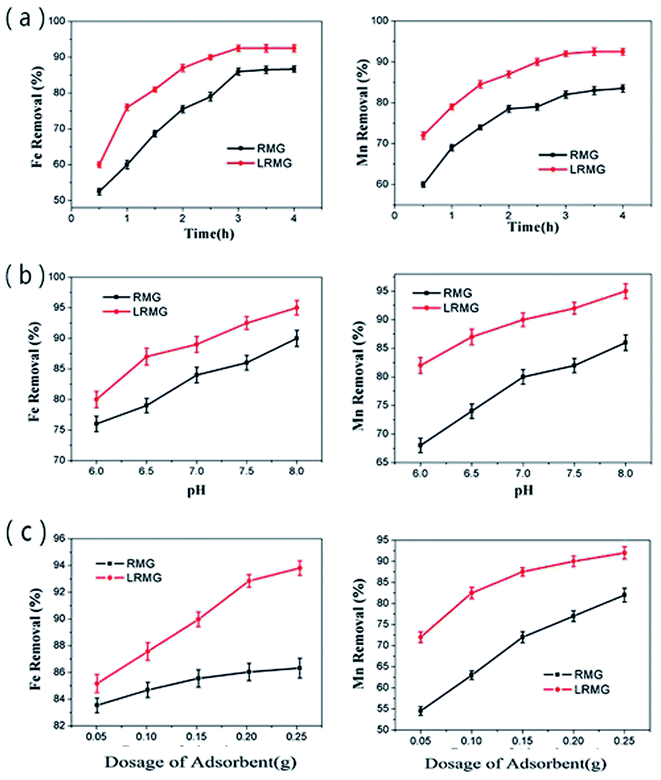
3.3 Fe2+ and Mn2+ removal process and mechanism
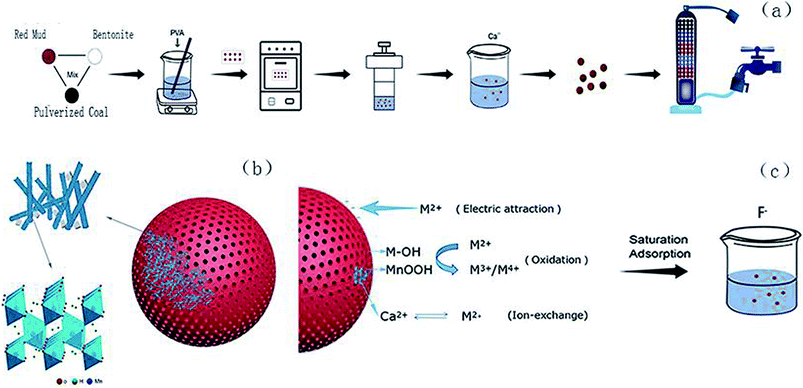
3.4 Reuse of DLRMG
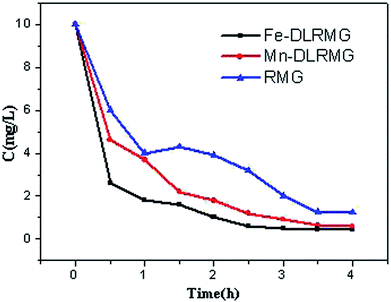
The reuse of adsorbents is very critical in practical applications. Traditional methods of elution using acid or alkali work well, but they are prone to additional contamination.42 In this study, the DLRMG adsorbent that was saturated with Fe2+ and Mn2+ was proposed to be reused for continuous removal of excessive F−. The two adsorbents RMG, and DLRMG after the adsorption of Fe2+ and Mn2+ were compared for the removal of F−. As Fig. 9 showed that the removal rate is better which utilized after adsorption. By comparing the results of the adsorbed material with those of the reported literature,43,44 it was found that the reused adsorbent had a good treatment effect and reached the standard after the treatment. The iron-adsorbed particles were stronger than the manganese-adsorbed particles because the amount of Fe2+ adsorbed on the particles was greater than that of Mn2+. By comparing the effect of RMG, Fe-DLRMG, and Mn-DLRMG on the removal of F− in water (Fig. 9), we concluded that Fe-DLRMG was best for removal possibly due to the higher amount of Fe2+ on DLRMG.4. Conclusion
Herein, a granular filter material was prepared with red mud as the carrier of Ca2+ and γ-MnOOH. The results showed that γ-MnOOH well dispersed in the macroporous structure of RMG, and Ca2+ added to the loaded granular filtration material further improved the removal capacity. Compared with RMG, DLRMG had higher surface area and uneven surface morphology and exhibited a better effect in Fe2+ and Mn2+ removal. The adsorbent obtained after the saturated adsorption of Fe2+ and Mn2+ was used to remove F− instead of the traditional elution process, and good removal efficiency was achieved. This shows that red mud is a promising material for heavy metal adsorption.Conflicts of interest
There are no conflicts to declare.Acknowledgements
This work was supported by a special fund project of Harbin Science and Technology Innovation Talents Research (2016RQQXJ109), Heilongjiang Provincial Institutions of Higher Learning Basic Research Funds Basic Research Projects (KJCX201812), Heilongjiang College Student Innovation and Entrepreneurship Training Program Project (201810212141), Harbin Jixin International Environmental Protection Creative Technology Training Project, and Natural Science Foundation of Heilongjiang Province (E201456).References
- F. A. Bertoni, J. C. González, S. I. García, L. F. Sala and S. E. Bellú, Carbohydr. Polym., 2018, 180, 55–62 CrossRef CAS PubMed.
- M. L. Lima, A. Romanelli and H. E. Massone, Sci. Total Environ., 2015, 530–531, 333–346 CrossRef CAS PubMed.
- Q. F. Cheng, L. C. Nengzi, L. L. Bao, Y. Huang, S. Y. Liu, X. W. Cheng, B. Li and J. Zhang, Chemosphere, 2017, 182, 450–457 CrossRef CAS PubMed.
- C. Y. Li, S. T. Wang, X. P. Du, X. S. Cheng, M. Fu, N. Hou and D. P. Li, Bioresour. Technol., 2016, 220, 76–84 CrossRef CAS PubMed.
- S. Mirlohi, A. M. Dietrich and S. E. Duncan, Environ. Sci. Technol., 2011, 45, 6575–6583 CrossRef CAS PubMed.
- S. M. Rahman, M. Kippler, S. Ahmed, B. Palm, S. E. Arifeen and M. Vahter, Reprod. Toxicol., 2015, 53, 68–74 CrossRef CAS PubMed.
- Q. Tang, G. J. Liu, C. C. Zhou, H. Zhang and R. Y. Sun, Chemosphere, 2013, 93, 2473–2479 CrossRef CAS PubMed.
- S. Y. Qina, F. Ma, P. Huang and J. X. Yang, Desalination, 2009, 245, 183–193 CrossRef.
- Y. H. Bai, Y. Y. Chang, J. S. Liang, C. Chen and J. H. Qu, Water Res., 2016, 106, 126–134 CrossRef CAS PubMed.
- S. L. D. Kenari and B. Barbeau, Water Res., 2017, 113, 50–61 CrossRef PubMed.
- X. Du, G. Y. Liu, F. S. Qu, K. Li, S. L. Shao, G. B. Li and H. Liang, Desalination, 2017, 403, 97–106 CrossRef CAS.
- A. G. Tekerlekopoulou, S. Pavloub and D. V. Vayenasa, J. Chem. Technol. Biotechnol., 2013, 88, 751–773 CrossRef CAS.
- D. Vries, C. Bertelkamp, F. S. Kegel, B. Hofs, J. Dusseldorp, J. H. Bruins, W. de Vet and B. van den Akker, Water Res., 2017, 109, 35–45 CrossRef CAS PubMed.
- K. S. Nitzsche, P. Weigold, T. Lösekann-Behrens, A. Kappler and S. Behrens, Chemosphere, 2015, 138, 47–59 CrossRef CAS PubMed.
- D. I. Cifci and S. Meric, Colloids Surf., A, 2017, 522, 279–286 CrossRef CAS.
- A. Ates and G. Akgül, Powder Technol., 2016, 287, 285–291 CrossRef CAS.
- C. Dalaia, R. Jhab and V. R. Desaic, Aquatic Procedia, 2016, 4, 1126–1133 CrossRef.
- Q. S. Si, Q. Zhu and Z. P. Xing, ACS Sustainable Chem. Eng., 2017, 5, 11422–11432 CrossRef CAS.
- Z. Guo, Q. Zhu, C. C. T. Liu and Z. P. Xing, Constr. Build. Mater., 2018, 172, 263–271 CrossRef CAS.
- I. B. Natálya, P. S. C. Santos, T. E. de Souza, L. C. A. Oliveira and C. S. Castro, J. Hazard. Mater., 2016, 314, 304–311 CrossRef PubMed.
- N. Deihimi, M. Irannajad and B. Rezaim, J. Environ. Manage., 2018, 206, 266–275 CrossRef CAS PubMed.
- Y. Zhao, J. Wang, Z. K. Luan, X. j. Peng, Z. Liang and L. Shi, J. Hazard. Mater., 2009, 165, 1193–1199 CrossRef CAS PubMed.
- L. Li, Q. Zhu, K. X. Man and Z. P. Xing, J. Mol. Liq., 2017, 237, 164–172 CrossRef CAS.
- D. M. Han, M. J. Currell and G. L. Cao, Environ. Pollut., 2016, 218, 1222–1233 CrossRef CAS PubMed.
- B. Huang, Z. W. Li, Z. L. Chen, G. Q. Chen, C. Zhang, J. Q. Huang, X. D. Nie, W. P. Xiong and G. M. Zeng, Environ. Sci. Pollut. Res., 2015, 22, 19912–19921 CrossRef CAS PubMed.
- C. M. Kanno, R. L. Sanders, S. M. Flynn, G. Lessard and S. C. B. Myneni, Environ. Sci. Technol., 2014, 48, 5798–5807 CrossRef CAS PubMed.
- S. C. Chen, L. Fang, Q. Zhu, L. Li and Z. P. Xing, RSC Adv., 2016, 6, 28257–28262 RSC.
- L. Y. Shao, Q. Zhao and J. Chen, Chem. Commun., 2017, 23, 2435–2438 RSC.
- K. X. Man, Q. Zhu, L. Li, C. T. Liu and Z. P. Xing, Ceram. Int., 2017, 43, 7565–7572 CrossRef CAS.
- Z. C. Li, H. L. Bao, X. Y. Miao and X. H. Chen, J. Colloid Interface Sci., 2011, 357, 286–291 CrossRef CAS PubMed.
- M. Sun, B. Lan, T. Lin, G. Cheng, F. Ye, L. Yu, X. L. Cheng and X. Y. Zheng, CrystEngComm, 2013, 15, 7010–7018 RSC.
- L. L. Lan, G. R. Gu, Q. J. Li, H. F. Zhang, K. Xu, B. Liu and B. B. Liu, RSC Adv., 2015, 5, 25250–25257 RSC.
- H. Yan, H. J. Li, X. Tao, K. Li, H. Yang, A. M. Li, S. J. Xiao and R. S. Cheng, ACS Appl. Mater. Interfaces, 2014, 6, 9871–9880 CrossRef CAS PubMed.
- T. Hens, J. Brugger, S. A. Cumberland, B. Etschmann and A. J. Frierdich, Environ. Sci. Technol., 2018, 52, 1311–1319 CrossRef CAS PubMed.
- P. F. Smith, B. J. Deibert, S. Kaushik, G. Gardner, S. H. Wang, J. F. Al-Sharab, E. Garfunkel, L. Fabris, J. Li and G. C. Dismukes, ACS Catal., 2016, 6, 567–579 Search PubMed.
- S. Guo, W. Z. Sun, W. Y. Yang, Q. Li and J. K. Shang, RSC Adv., 2015, 5, 53280–53288 RSC.
- S. Lan, H. Ying, X. M. Wang, F. Liu, W. F. Tan, Q. Y. Huang, J. Zhang and X. H. Feng, Water Res., 2015, 128, 92–101 CrossRef PubMed.
- A. J. Frierdich, M. l J. Spicuzza and M. M. Scherer, Environ. Sci. Technol., 2016, 50, 6374–6380 CrossRef CAS PubMed.
- C. O. Dennis, S. M. B. Pingul-Ong, C. C. Kan and M. D. G. de Luna, J. Cleaner Prod., 2018, 190, 443–451 CrossRef.
- M. E. kady, H. Shokryc and H. Hamad, RSC Adv., 2016, 6, 82244–82259 RSC.
- P. Chand and Y. B. Pakade, Environ. Sci. Pollut. Res., 2015, 22, 10919–10929 CrossRef CAS PubMed.
- O. Krüger, U. Kalbe, W. Berger, K. Nordhauβ, G. Christoph and H.-P. Walzel, Environ. Sci. Technol., 2012, 46, 13085–13092 CrossRef PubMed.
- V. Sivasankar, T. Ramachandramoorthy and A. Darchen, Desalination, 2011, 272, 179–186 CrossRef CAS.
- K. Biswas, K. Gupta, A. Goswami and U. C. Ghosh, Desalination, 2010, 255, 44–51 CrossRef CAS.
| This journal is © The Royal Society of Chemistry 2019 |

