 Open Access Article
Detection of miRNA cancer biomarkers using light activated Molecular Beacons†
Odete Sofia Lopes Gonçalves a,
Guy Wheelerb,
Tamas Dalmayb,
Houquan Daic,
Miguel Castroc,
Patrick Castroc,
Jaime García-Rupérezd,
Ángela Ruiz-Tórtolad,
Amadeu Griold,
Juan Hurtadod,
Laurent Bellieresd,
María José Bañuls
 e,
Daniel González
 e,
José Antonio López-Guerrerof and
Maria Teresa Neves-Petersen
 *gh
*gh
aMedical Photonics Lab, Department of Health Science and Technology, Faculty of Medicine, Aalborg University, Fredrik Bajers Vej 7, DK-9220, Aalborg, Denmark
bSchool of Biological Sciences, University of East Anglia, Norwich Research Park, Norwich, NR4 7TJ, UK
cBiosynthesis, 612 East Main Street, Lewisville, TX 75057-4052, USA
dNanophotonics Technology Center, Universitat Politècnica de València, Camino de Vera S/N, 46022 Valencia, Spain
eIDM, Instituto Interuniversitario de Investigación de Reconocimiento Molecular y Desarrollo Tecnológico, Departamento de Química, Universitat Politècnica de València, Camino de Vera S/N, 46022 Valencia, Spain
fBiología Molecular, Fundación Instituto Valenciano de Oncología, Valencia, Spain
gDepartment of Clinical Medicine, Aalborg University Hospital, Hobrovej 18-22, 9000 Aalborg, Denmark. E-mail: nevespetersen@gmail.com; Tel: +45 2252 2475
hDepartment of Biomedical Sciences and Medicine, Centre for Biomedical Research (CBMR), University of Algarve, Campus de Gambelas, 8005-139 Faro, Portugal
First published on 25th April 2019
Abstract
Early detection of cancer biomarkers can reduce cancer mortality rate. miRNAs are small non-coding RNAs whose expression changes upon the onset of various types of cancer. Biosensors that specifically detect such biomarkers can be engineered and integrated into point-of-care devices (POC) using label-free detection, high sensibility and compactness. In this paper, a new engineered Molecular Beacon (MB) construct used to detect miRNAs is presented. Such a construct is immobilized onto biosensor surfaces in a covalent and spatially oriented way using the photonic technology Light Assisted Molecular Immobilization (LAMI). The construct consists of a Cy3 labelled MB covalently attached to a light-switchable peptide. One MB construct contains a poly-A sequence in its loop region while the other contains a sequence complementary to the cancer biomarker miRNA-21. The constructs have been characterized by UV-Vis spectroscopy, mass spectrometry and HPLC. LAMI led to the successful immobilization of the engineered constructs onto thiol functionalized optically flat quartz slides and Silicon on Insulator (SOI) sensor surfaces. The immobilized Cy3 labelled MB construct has been imaged using confocal fluorescence microscopy (CFM). The bioavailability of the immobilized engineered MB biosensors was confirmed through specific hybridization with the Cy5 labelled complementary sequence and imaged by CFM and FRET. Hybridization kinetics have been monitored using steady state fluorescence spectroscopy. The label-free detection of miRNA-21 was also achieved by using integrated photonic sensing structures. The engineered light sensitive constructs can be immobilized onto thiol reactive surfaces and are currently being integrated in a POC device for the detection of cancer biomarkers.
1 Introduction
The Globocan report pinpoints that in 2018 there were 18.1 million new cancer cases and 9.6 million cancer related deaths worldwide were registered despite advances in current therapies.1,2 The number of new cases is expected to rise by 70% over the next two decades.3 However, the WHO states that most cancer types have high cure rates when detected early and treated according to the best practices. Therefore, early and trustful detection tools for the implementation of preventive screening programs are crucial for reducing mortality rates.Nanotechnology allows the engineering of biosensors with improved performances and functionalities. In particular, nanophotonic technology enables the creation of the core transduction elements of future high-performance biosensors providing high sensitivity, compactness and high integration level, shorter time to result, label-free detection, and reduced sample volumes. In today's point-of-care (POC) market, there is an ever-increasing demand for novel and more efficient devices for the early diagnosis of diseases, such as cancer.
New analysis devices for the detection of novel microRNA (miRNA) biomarkers are most useful and needed. miRNAs are a class of small non-coding RNAs (≈22 nucleotides) whose dysregulation has been correlated with a growing number of ≈400 human diseases,4 including cancer, Alzheimer's, Parkinson's, diabetes, osteoporosis and cardiovascular diseases. Therefore, the use of miRNA biomarkers will allow the minimally invasive early diagnosis of almost 400 diseases. The technologies might be adapted to the diagnosis of any other disease associated with miRNA dysregulation by changing the probe immobilized on the sensor's surface.
Since the discovery of the loss of miRNA-15a and miRNA-16-1 in B-cell chronic lymphocytic leukaemia,5 several studies reported changes of miRNA expression in several cancers.6,7 Volinia et al. performed a large-scale miRNome analysis and identified a large portion of overexpressed miRNAs in solid tumours,8 being miRNA-21, miRNA-191 and miRNA-17-5p significantly overexpressed in all the considered tumour types. However, they also validated particular miRNA signatures for each tumour. In recent years, miRNA expression profiling has been able to classify between healthy and tumour tissues and even between different tumour grades.7,9–11 miRNAs have been found to be extraordinarily stable in plasma and serum samples.12 Consequently, circulating miRNAs became potential candidates for blood-based biomarkers. Mitchell et al. showed that serum levels of miRNA-141 significantly discriminated patients with prostate cancer and healthy controls.13 Moreover, other studies demonstrated the up-regulation of miRNA-21, miRNA-141, miRNA-200, miRNA-200c, miRNA-200b, miRNA-203, miRNA-205 and miRNA-214 in circulating cancer exosomes.4 Some other miRNAs have also been found in extracellular fluids such as plasma serum, saliva and urine.14
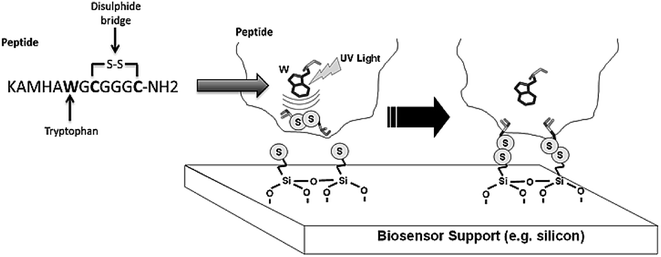
The four varieties of cancer with higher incidence and mortality (≈2.7 million deaths worldwide) are: breast, prostate, lung and colorectal cancers.15 miRNA-21 is overexpressed in most human tumours, including the above mentioned cancers. Our main goal is the detection of miRNA-21 using an engineered Molecular Beacon (MB) probe immobilized on a sensor surface using Light Assisted Molecular Immobilization (LAMI) technology.16 Two MBs have been engineered: a model MB comprising a poly-A sequence in its loop region and a MB with a sequence complementary to miRNA-21 in its loop region. Crucial to the success of this work has been the conjugation of a light activated peptide (KAMHAWGCGGGC-NH2) to the MB, with tryptophan in close spatial proximity to a disulphide bridge (Fig. 1). The peptide enables the immobilization of MB-peptide constructs with LAMI technology onto surfaces. LAMI is a photonic technology that allows for covalent and oriented immobilization of biomolecules onto thiol reactive surfaces, with μm and sub-μm spatial resolution.17–23 This photonic technology presents some advantages over other immobilization techniques24–28 as it does not require chemical or thermal steps to achieve covalent immobilization and it allows for spatially oriented immobilization. LAMI makes use of a conserved motif in proteins, i.e., the close spatial proximity between aromatic residues (tryptophan, tyrosine and phenylalanine) and disulphide bridges.16,29,30 UV excitation (275–295 nm) of aromatic residue's side chain induces electron ejection, which may react with the nearby disulphide bridge forming of a disulphide electron adduct.31 Such short lived adduct will dissociate, leading to the formation of free thiol groups that will covalently bind peptides/proteins to thiol reactive surfaces. Any molecule can be immobilized with LAMI, even if they do not display aromatic residues or disulphide bridges, by tagging the molecule with a small peptide containing such motif.
The present paper shows that LAMI has successfully immobilized MB-peptide constructs onto sensor surfaces which have successfully hybridized with their respective complementary oligonucleotide. Non-complementary oligonucleotides have been used as controls. Hybridization kinetics have been monitored using steady state fluorescence spectroscopy. Detection of the immobilized MB construct's hybridization with the respective targets was visualised with confocal fluorescence microscopy (CFM) and using photonic bandgap (PBG) sensing structures. The use of these PBG structures allows for specific recognition of the target oligonucleotides through hybridization with the immobilized MB constructs on the surface of the PBG structures in a label-free and highly sensitive manner. The engineered light sensitive MB construct can be immobilized onto any thiol reactive surface and is being integrated in a photonic sensor device using the PBG structures for detection. The newly engineered MBs, their immobilization and bioavailability are hereby presented. We hereby demonstrate a proof-of-concept of the feasibility of the new integrated technology used to detect cancer biomarkers. Further studies are in progress in order to optimise the sensitivity of the newly engineered biosensor.
2 Materials and methods
2.1 Materials
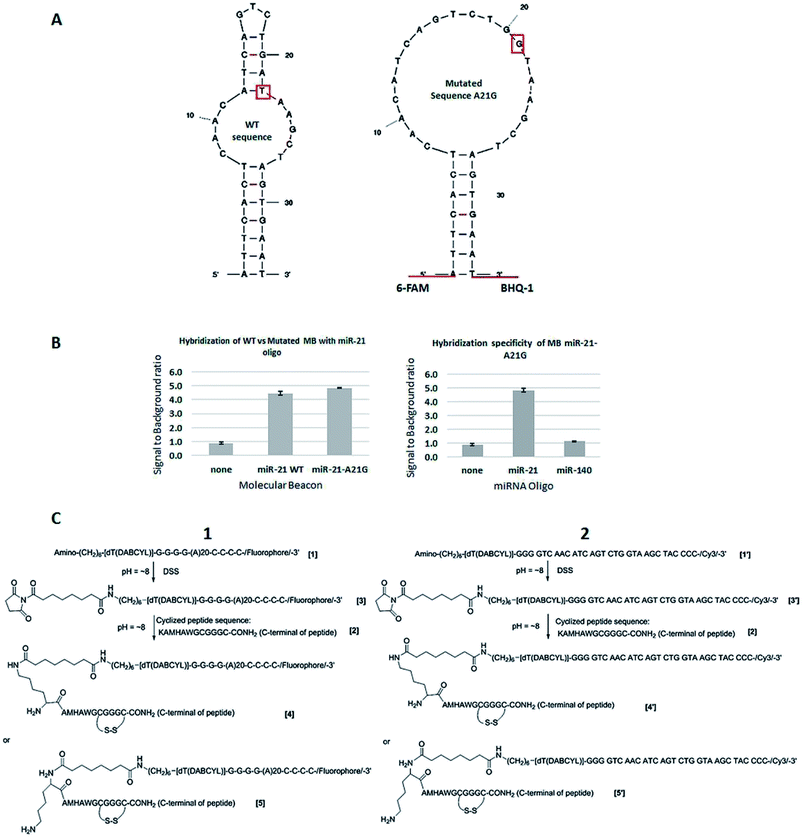
The MBs and miRNA-21 oligonucleotide were purchased from Sigma-Aldrich, UK. KCl, MgCl2 and Tris–HCl were also purchased from Sigma-Aldrich, UK. The MBs have a 5′ 6-FAM fluorophore and 3′ Black Hole Quencher-1 (BHQ-1),32 which quenches 6-FAM fluorescence. The structure of the designed MBs is depicted in Fig. 2A.The two engineered MB constructs (Cy3 labelled), their complementary and control sequences and the peptide KAMHAWGCGGGC-NH2 have been purchased from Biosynthesis (Texas, USA). The salts used to make PBS (sodium chloride, potassium chloride, sodium phosphate dibasic heptahydrate and potassium phosphate monobasic) were purchased from Sigma-Aldrich (Missouri, USA).
2.2 MB design and validation
MBs were designed with the mFold folding prediction software.33 Fluorescence based assays using the MBs displayed in Fig. 2A were performed in white 96-well plates (Fisher, UK) in buffer consisting of 10 mM KCl, 5 mM MgCl2 and 10 mM Tris–HCl pH 7.5.34 Exposure to light was minimised to reduce fluorophore photobleaching and the samples were incubated at room temperature for 10 min before fluorescence readings were taken. Three wells for each condition were used and average readings were performed to calculate the fluorescence ratio (see, e.g., Fig. 2B), which was calculated using the readings between wells containing the MB and the target miRNA oligo UACCACAGGGUAGAACCACGG and the MB alone.2.3 Engineered MB construct structure
![[thin space (1/6-em)]](https://www.rsc.org/images/entities/char_2009.gif) :
:![[thin space (1/6-em)]](https://www.rsc.org/images/entities/char_2009.gif) 2, v/v) and extra Disuccinimidyl Suberate (DSS) in DMSO was added. The mixture was incubated for several minutes at room temperature, precipitated by 30% of NaClO4 in acetone, cooled down at −20 °C, and separated by centrifugation. After washing with acetone and drying, the precipitated products [3] or [3′] were dissolved into a mixture solution of DMSO–H2O and extra peptide [2] in DMSO was added. The reaction mixture was incubated for 1–2 hours at 37 °C and precipitated by 30% of NaClO4. After separation, the crude products [4], [5], or [4′] and [5′] were purified by RP-HPLC. The final product was characterized by Maldi-Tof Mass Spectrometry (MS) on Applied Biosystem (Model: Voyager DE-Pro; matrix solution: 10 mg mL−1 3-hydroxypicolinic acid and 1 mg mL−1 diammonium hydrogen citrate in water) and the purity was assayed by RP-HPLC on Beckman (System Gold) and column (Phenomenex, Jupiter, C18, 300 Å, 10 μ, 150 × 3.0 mm). The assayed condition was wavelength: 260; flow rate: 0.8 mL min−1; solvent A: 50 mM of triethylammonium acetate in water and solvent B
2, v/v) and extra Disuccinimidyl Suberate (DSS) in DMSO was added. The mixture was incubated for several minutes at room temperature, precipitated by 30% of NaClO4 in acetone, cooled down at −20 °C, and separated by centrifugation. After washing with acetone and drying, the precipitated products [3] or [3′] were dissolved into a mixture solution of DMSO–H2O and extra peptide [2] in DMSO was added. The reaction mixture was incubated for 1–2 hours at 37 °C and precipitated by 30% of NaClO4. After separation, the crude products [4], [5], or [4′] and [5′] were purified by RP-HPLC. The final product was characterized by Maldi-Tof Mass Spectrometry (MS) on Applied Biosystem (Model: Voyager DE-Pro; matrix solution: 10 mg mL−1 3-hydroxypicolinic acid and 1 mg mL−1 diammonium hydrogen citrate in water) and the purity was assayed by RP-HPLC on Beckman (System Gold) and column (Phenomenex, Jupiter, C18, 300 Å, 10 μ, 150 × 3.0 mm). The assayed condition was wavelength: 260; flow rate: 0.8 mL min−1; solvent A: 50 mM of triethylammonium acetate in water and solvent B![[thin space (1/6-em)]](https://www.rsc.org/images/entities/char_2009.gif) :
:![[thin space (1/6-em)]](https://www.rsc.org/images/entities/char_2009.gif) acetonitrile; with a gradient from 20% to 70% of solvent B in 20 minutes. The theoretical molecular weight (MW) was also calculated according to:
acetonitrile; with a gradient from 20% to 70% of solvent B in 20 minutes. The theoretical molecular weight (MW) was also calculated according to:| Theoretical Mw = Mw(oligonucleotide sequence) + Mw(DSS linker residue) + Mw(peptide) | (1) |
The calculated MW was correlated to the MW obtained through MS.
2.4 Preparation of MB constructs stock solutions
The poly-A MB and the miRNA-21 specific MB constructs were received in lyophilized form and resuspended in PBS 1× to a concentration of 10 μM. MB solutions were aliquoted and stored at −20 °C until use.2.5 Preparation of oligonucleotide stock solutions for the engineered MB constructs
Three different oligonucleotide sequences were used in this study: two sequences are the complementary sequences to poly-A MB and to miRNA-21 specific MB. The third sequence is a non-complementary sequence to neither MBs (Table 1). The oligonucleotides were received in lyophilized form, and with and without a fluorescent label (Cy5), and resuspended in PBS 1× to a concentration of 10 μM. Oligonucleotide solutions were aliquoted and stored at −20 °C until use.| 5′ | Sequence (5′–3′) | Comments |
|---|---|---|
| Cy5 or unlabelled | GUAGCUUAUCAGACUGAUGUUGAC | RNA base, miRNA-21 sequence complementary to the miRNA21 specific MB sequence. |
| Cy5 or unlabelled | GAAAAAAAAAAAAAAAAAAAAAC | DNA base, sequence not complementary to the loop region of the model MB and of the miRNA-21 MB, this sequence is used as a hybridization negative control. |
| Cy5 or unlabelled | GTTTTTTTTTTTTTTTTTTTTC | DNA base, sequence complementary to the model MB sequence. |
| Cy5 or unlabelled | UACCACAGGGUAGAACCACGG | RNA base, miRNA-140 sequence non-complementary to the miRNA21 specific MB sequence (oligonucleotide used as a non-hybridization control on the section MB design and validation). |
2.6 Steady-state fluorescence spectroscopy studies – hybridization kinetics
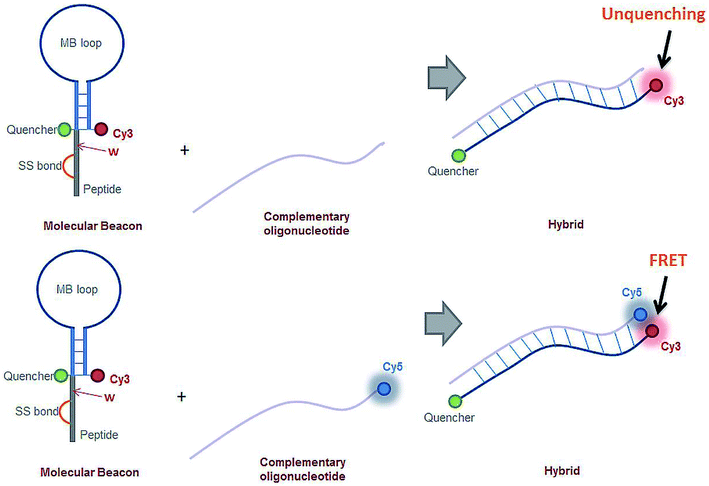
Hybridization between the miRNA-21 specific MB construct and the target sequence was monitored through FRET. Cy3 is present in the MB loop stem and the target oligonucleotides were Cy5 labelled. The emission spectra of Cy3 (donor) partially overlaps the excitation spectra of Cy5 (acceptor). When in close spatial proximity, this spectral overlap allows for energy transfer from the donor to the acceptor to occur. The spatial proximity requirement is fulfilled when hybridization takes place, allowing for the detection of the specific binding between the MB and the target oligonucleotide (Fig. 3, bottom scheme). Hybridization experiments with the miRNA-21 specific MB were carried out using the Cy5 labelled synthesized oligonucleotide, 5′-CAG UUG UAG UCA GAC UAU UCG AUG-3′, complementary the MB's loop sequence. 300 μL of the miRNA-21 specific MB samples were prepared in a 0.5 μL quartz cuvette (0.1 mm optical pathway) at a concentration of 0.1 μM in PBS 1× and illuminated at 488 nm, monitoring the fluorescence emission intensity at 670 nm for 2 min, at room temperature. Cy5 absorption is non-existent at 488 nm, whereas for Cy3 is in the order of 17% of its maximum absorbance.35 Cy5 fluoresces maximally at 670 nm, the wavelength monitored during these experiments. Thus, the recorded fluorescence emission intensity results from energy transfer between Cy3 (donor) and Cy5 (acceptor).
The experiment was paused and 30 μL of a solution of Cy5 labelled oligonucleotide solution was added to the miRNA-21 specific MB solution (0.1 and 1 μM, respectively). Re-suspension was done with a pipette. Immediately after mixing, the solution was again continuously illuminated at 488 nm and the fluorescence emission intensity at 670 nm was monitored for 1 h, at room temperature. As a non-hybridization control, a 30 μL of a solution of Cy5 labelled non-complementary oligonucleotide poly-A was added and the fluorescence change was monitored.
2.7 Sensor surfaces
Two kinds of sensor surfaces were used to immobilize the light sensitive MB constructs: optically flat quartz slides and Silicon on Insulator (SOI) chips (with and without photonic bandgap (PBG) sensing structures). Optically flat quartz slides were purchased from ArrayIt (SuperClean 2, SCM2) and SOI chips (with and without PBG sensing structures) were provided by the Universitat Politècnica de València. The PBG structures present in some of the SOI chips used in this study are generated by introducing a periodic modulation in the refractive index of the photonic structure. In this type of PBG sensing structure, its periodicity gives rise to the presence of a spectral range where the propagation of the light is forbidden, the so-called photonic bandgap (PBG). When the refractive index of the surroundings of the PBG sensing structure will change due to the presence of the target analytes (the miRNA target in our case), the PBG spectral position will shift depending on the target analyte concentration.The photonic chips used in the experiments comprised several PBG sensing structures of dimensions width w = 460 nm, height h = 220 nm, period a = 380 nm and length of the transversal elements we = 1500 nm. The PBG sensing structures where organized in pairs, where two different widths of the transversal elements were used for each structure (wi = 120 nm and wi = 140 nm). Each chip contained 4 PBG sensor pairs. The photonic chips were fabricated using e-beam lithography and inductively coupled plasma etching to transfer the designs to the top silicon layer. An image of one of the fabricated PBG sensing structures is shown in Fig. 4. Shallow etch 1D grating couplers where fabricated at the accesses of the photonic structures in order to vertically couple the light to/from the chip inputs/outputs. Finally, a top 400 nm-thick SiO2 upper cladding is deposited over the photonic chip in order to increase the robustness of the photonic structures and to avoid their damage when the microfluidic cell required to flow the reagents over the chip is placed; a channel is opened in the SiO2 upper cladding in the positions where the PBG sensing structures are placed in order be in contact with the samples to be analysed.
2.8 Illumination setup
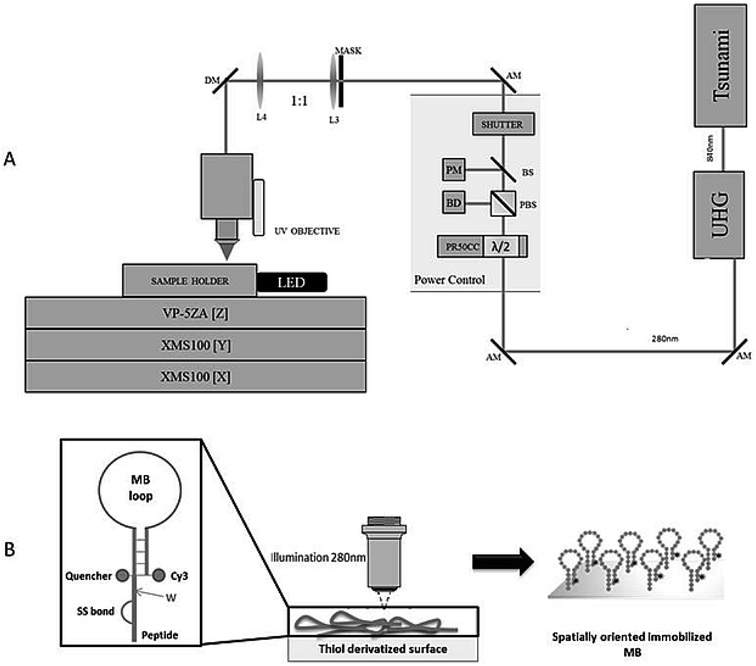
A scheme of the experimental system36 is shown in Fig. 5A. The femtosecond (fs) laser Tsunami XP (Spectra-Physics), is pumped by the Millennia eV (Spectra-Physics). Typical operation is around 840 nm with maximum average power of 4 W. The Tsunami output (∼100 fs pulses at 80 MHz) is frequency tripled in a harmonic generation module (Spectra-Physics) to produce ∼280 nm UV fs pulses with an efficiency of ∼10%. The fundamental at 840 nm and the third harmonic at 280 nm are routed via separate paths into the experimental system. Each beam passes through a computer controlled variable attenuator consisting of a half-wave plate, mounted in a motorized rotation stage (PR50CC, Newport) and followed by a polarizing beam cube. After each attenuator, a fused silica beam sampler is used to direct a portion of the beam onto a photodiode (PD-300R-3W and PD-300R-UV, OPHIR) for power monitoring. The beam then passes through safety shutters (LS6S2ZM1, VINCENT ASSOCIATES) to control exposure to the sample. Only the 280 nm beam has been used in the present study.2.9 Confocal fluorescence microscopy (CFM) studies – fluorescent label detection
The configuration for spectra acquisition was set to a range between 1520 nm and 1620 nm with a sweeping speed of 10 nm s−1 and a spectral resolution of 20 pm. Using a constant flow rate of 20 μl min−1, the target oligonucleotide solutions are flowed using a syringe pump working in withdraw mode.
2.10 Data analysis
All data analysis, plotting and fitting procedures were done using Origin 8.1 (OriginLab Corporation, Northampton, MA, USA) and MATLAB (MathWorks, Inc. Natick, MA, USA). Fluorescence emission intensity profiles and the 3D surface plot of the immobilized and hybridized MB patterns, imaged by CFM, were obtained using ImageJ 1.50i.2.11 Fitting procedures
| Y offset | Rate constant (s−1) | Fractional intensity (%) | Amplitude |
|---|---|---|---|
a Y offset (y0), amplitude (Ai), rate constants (ti), intensity fraction (fi) and average rate constant (〈t〉) for hybridization of poly-A and miRNA-21 specific MB constructs with the respective complementary oligonucleotides (ratios 1![[thin space (1/6-em)]](https://www.rsc.org/images/entities/char_2009.gif) : :![[thin space (1/6-em)]](https://www.rsc.org/images/entities/char_2009.gif) 1 and 1 1 and 1![[thin space (1/6-em)]](https://www.rsc.org/images/entities/char_2009.gif) : :![[thin space (1/6-em)]](https://www.rsc.org/images/entities/char_2009.gif) 10). 10). |
|||
| Poly-A MB (unquenching) | |||
Poly-A MB + poly-T oligo (1![[thin space (1/6-em)]](https://www.rsc.org/images/entities/char_2009.gif) : :![[thin space (1/6-em)]](https://www.rsc.org/images/entities/char_2009.gif) 1) 1) |
|||
| y0 = −19.323 ± 1.116 | t1 (slow phase) = 465.272 ± 6.453 | f1 = 6 | A1 = 0.081 ± 0.001 |
| t2 (fast phase) = 27.757 ± 0.326 | f2 = 94 | A2 = 20.240 ± 1.115 | |
| 〈t〉 = 55.262 | |||
![[thin space (1/6-em)]](https://www.rsc.org/images/entities/char_2009.gif) |
|||
| miRNA-21 MB (FRET) | |||
miRNA-21 MB + miRNA-21 oligo (1![[thin space (1/6-em)]](https://www.rsc.org/images/entities/char_2009.gif) : :![[thin space (1/6-em)]](https://www.rsc.org/images/entities/char_2009.gif) 1) 1) |
|||
| y0 = −0.021 ± 0.004 | t1 (slow phase) = 1120.800 ± 9.225 | f1 = 83 | A1 = 0.499 ± 0.003 |
| t2 (fast phase) = 210.142 ± 2.496 | f2 = 17 | A2 = 0.543 ± 0.003 | |
| 〈t〉 = 966.487 | |||
miRNA-21 MB + miRNA-21 oligo (1![[thin space (1/6-em)]](https://www.rsc.org/images/entities/char_2009.gif) : :![[thin space (1/6-em)]](https://www.rsc.org/images/entities/char_2009.gif) 10) 10) |
|||
| y0 = −13.896 ± 4.721 | t1 (slow phase) = 126.854 ± 1.374 | f1 = 22 | A1 = 0.784 ± 0.019 |
| t2 (fast phase) = 24.449 ± 1.750 | f2 = 78 | A2 = 14.111 ± 4.706 | |
| 〈t〉 = 47.366 | |||
2.12 Image treatment
An area of the CFM images was selected and analysed to obtain the accumulated average fluorescence emission intensity profiles. These profiles result in a 2D display of pixel intensity along a selected area of the image. For the 3D surface plot, a plot derived from the pixel intensity displayed in the selected area of the image was created and adjusted for lighting, perspective and smoothing.3 Results
3.1 MB selection and validation
MB design showed unwanted base pairing within the loop (Fig. 2A, left). A single base change was required to open the structure out into the desired loop to allow access by the target miRNA-21. As seen in Fig. 2A (right), a mutation of A at position 21 to a G removed this unwanted base pairing, whilst still retaining the hybridization potential with the T in the miRNA-21 sequence from G:T pairing. Specificity of the MB for miRNA-21 was tested by comparing the results using a MB containing the wild type loop sequence complementary to miRNA-21 against that with the A–G base change necessary to remove the unwanted base pairing, and a negative control using an RNA oligo of the unrelated miRNA-140. The concentrations used were 25 nM of miRNA-21 specific MB and 50 nM of target miRNA (see paragraph ahead, justifying this choice of concentrations). As seen in Fig. 2B (left), opening of the loop with the single base change makes the MB more able to hybridize with the target miRNA, with an increase in fluorescence ratio of ≈8.6%, compared with the MB containing the wild type sequence. No increase in fluorescence ratio was observed when hybridizing the miRNA-21 specific MB with miRNA-140 (Fig. 2B, right).Optimization experiments were performed to find the concentration of the MB necessary for fluorescence detection of target miRNA. The fluorescence emission intensity of different concentrations of miRNA-21 specific MB (labelled with 6FAM but without quencher) was monitored and the fluorescence ratio calculated as the fluorescence reading of the MB against that of the assay buffer (Fig. S1A†). For further optimizations, 25 nM of 6-FAM labelled miRNA-21 specific MB was used since the fluorophore emission intensity was clearly detectable. To optimize the concentration of miRNA oligo in the assay, 25 nM of MB and a range of miRNA concentrations from 25–1000 nM were used. As shown in Fig. S1B† miRNA oligo at 50 nM and above produced fluorescence ratios clearly detectable above those of the MB or assay buffer alone. For further experiments, 25 nM MB and 50 nM miRNA oligo were used (Fig. 1, scheme 3).
3.2 Engineered MB constructs: synthesis and characterization
The purity level of the MB coupled to the peptide obtained by HPLC was >96% for the poly-A MB construct and >97% for the miRNA-21 MB construct (Fig. S2†). The MW of the MB constructs was determined by MS (Fig. S3†). Data obtained for the poly-A MB construct (Fig. S3,† upper panel) shows a clearly defined peak corresponding to a MW of 11![[thin space (1/6-em)]](https://www.rsc.org/images/entities/char_2009.gif) 384.78 Da, matches the theoretical MW (11
384.78 Da, matches the theoretical MW (11![[thin space (1/6-em)]](https://www.rsc.org/images/entities/char_2009.gif) 384.84 Da). The same was observed for the MS data obtained for the miRNA-21 construct (Fig. S3,† lower panel), where a sharp peak shows a MW of 12
384.84 Da). The same was observed for the MS data obtained for the miRNA-21 construct (Fig. S3,† lower panel), where a sharp peak shows a MW of 12![[thin space (1/6-em)]](https://www.rsc.org/images/entities/char_2009.gif) 001.09 Da, which matches the calculated MW (12
001.09 Da, which matches the calculated MW (12![[thin space (1/6-em)]](https://www.rsc.org/images/entities/char_2009.gif) 000.16 Da).
000.16 Da).
3.3 Steady state fluorescence studies – hybridization kinetics
![[thin space (1/6-em)]](https://www.rsc.org/images/entities/char_2009.gif) :
:![[thin space (1/6-em)]](https://www.rsc.org/images/entities/char_2009.gif) 1 and 1
1 and 1![[thin space (1/6-em)]](https://www.rsc.org/images/entities/char_2009.gif) :
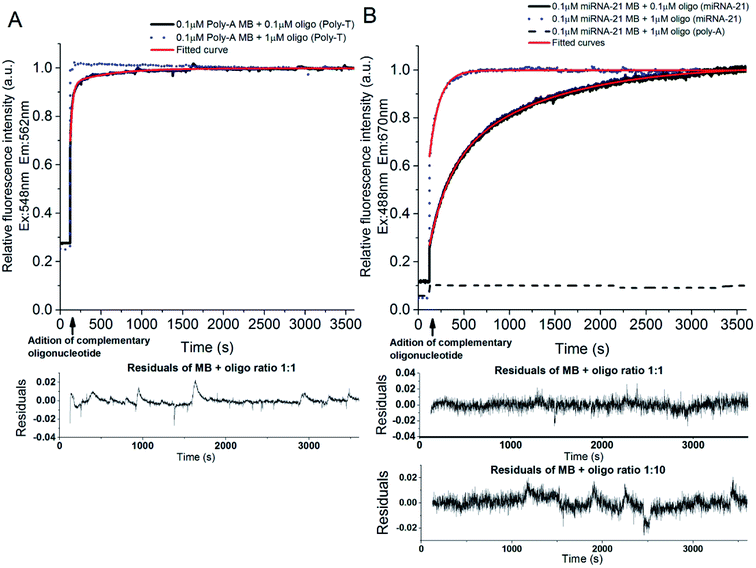
:![[thin space (1/6-em)]](https://www.rsc.org/images/entities/char_2009.gif) 10, respectively). The binding kinetics were monitored following the increase of fluorescence emission intensity as a function of time after adding the complementary oligonucleotide to the poly-A MB solution. The MB loop opens upon binding with the complementary oligonucleotide resulting in an increase of Cy3 emission due to separation between the fluorophore (Cy3) and the quencher (dtDABCYL), (Fig. 3A). In Fig. 6A are displayed the kinetic curves obtained upon monitoring the fluorescence emission intensity of Cy3 (λexcitation = 548 nm, λemission = 562 nm) and the respective fitted curve for the hybridization at a ratio of 1
10, respectively). The binding kinetics were monitored following the increase of fluorescence emission intensity as a function of time after adding the complementary oligonucleotide to the poly-A MB solution. The MB loop opens upon binding with the complementary oligonucleotide resulting in an increase of Cy3 emission due to separation between the fluorophore (Cy3) and the quencher (dtDABCYL), (Fig. 3A). In Fig. 6A are displayed the kinetic curves obtained upon monitoring the fluorescence emission intensity of Cy3 (λexcitation = 548 nm, λemission = 562 nm) and the respective fitted curve for the hybridization at a ratio of 1![[thin space (1/6-em)]](https://www.rsc.org/images/entities/char_2009.gif) :
:![[thin space (1/6-em)]](https://www.rsc.org/images/entities/char_2009.gif) 1. The fitting parameters are described in Table 2. The residual values for this fitting are randomly distributed around 0 (Fig. 6A, lower panel).
1. The fitting parameters are described in Table 2. The residual values for this fitting are randomly distributed around 0 (Fig. 6A, lower panel).The hybridization curve obtained for ratio 1![[thin space (1/6-em)]](https://www.rsc.org/images/entities/char_2009.gif) :
:![[thin space (1/6-em)]](https://www.rsc.org/images/entities/char_2009.gif) 1 demonstrates a fast phase with a rate constant of 27.757 ± 0.326 s−1 and an amplitude of 20.240 ± 1.115 followed by a slow phase with a rate constant of 465.272 ± 6.453 s−1 and an amplitude of 0.081 ± 0.001. The calculated fractional intensity for the fast rate constant was 94% and for the slow rate constant was 6%. Thus, the average rate constant obtained for this ratio was 55.3 s−1, indicating a reaction where the [MB · complementary oligonucleotide] equilibrium is reached fast. Increasing the ratio to 1
1 demonstrates a fast phase with a rate constant of 27.757 ± 0.326 s−1 and an amplitude of 20.240 ± 1.115 followed by a slow phase with a rate constant of 465.272 ± 6.453 s−1 and an amplitude of 0.081 ± 0.001. The calculated fractional intensity for the fast rate constant was 94% and for the slow rate constant was 6%. Thus, the average rate constant obtained for this ratio was 55.3 s−1, indicating a reaction where the [MB · complementary oligonucleotide] equilibrium is reached fast. Increasing the ratio to 1![[thin space (1/6-em)]](https://www.rsc.org/images/entities/char_2009.gif) :
:![[thin space (1/6-em)]](https://www.rsc.org/images/entities/char_2009.gif) 10, the reaction rate is much faster (Fig. 6A, blue dotted lines). A good fitting was not achieved for the hybridization curve obtained at the ratio 1
10, the reaction rate is much faster (Fig. 6A, blue dotted lines). A good fitting was not achieved for the hybridization curve obtained at the ratio 1![[thin space (1/6-em)]](https://www.rsc.org/images/entities/char_2009.gif) :
:![[thin space (1/6-em)]](https://www.rsc.org/images/entities/char_2009.gif) 10, however the curve shape shows a fast increase of fluorescence intensity reaching a plateau within ≈150 s.
10, however the curve shape shows a fast increase of fluorescence intensity reaching a plateau within ≈150 s.
The binding kinetics between the miRNA-21 specific MB and its respective complementary oligonucleotide were monitored through FRET between Cy3 (stem of the MB loop) and Cy5 (complementary oligonucleotide) (Fig. 3B). In Fig. 6B is depicted the binding curve between the miRNA-21 specific MB and the oligonucleotide at different concentrations: 0.1 and 1 μM of oligonucleotide miRNA-21 were added to 0.1 μM of miRNA-21 specific MB (ratios 1![[thin space (1/6-em)]](https://www.rsc.org/images/entities/char_2009.gif) :
:![[thin space (1/6-em)]](https://www.rsc.org/images/entities/char_2009.gif) 1 and 1
1 and 1![[thin space (1/6-em)]](https://www.rsc.org/images/entities/char_2009.gif) :
:![[thin space (1/6-em)]](https://www.rsc.org/images/entities/char_2009.gif) 10, respectively). The increase of fluorescence emission intensity of Cy5 is monitored as a function of time (λexcitation = 488 nm, λemission = 670 nm) before and after adding the oligonucleotide. The respective fitted curves are also depicted in Fig. 6B and the derived fitting parameters can be found in Table 2. The residual values for these fitting are randomly distributed around 0 (Fig. 6B, lower panels).
10, respectively). The increase of fluorescence emission intensity of Cy5 is monitored as a function of time (λexcitation = 488 nm, λemission = 670 nm) before and after adding the oligonucleotide. The respective fitted curves are also depicted in Fig. 6B and the derived fitting parameters can be found in Table 2. The residual values for these fitting are randomly distributed around 0 (Fig. 6B, lower panels).
The curve obtained for the hybridization of the miRNA-21 specific MB with the complementary oligonucleotide at a ratio of 1![[thin space (1/6-em)]](https://www.rsc.org/images/entities/char_2009.gif) :
:![[thin space (1/6-em)]](https://www.rsc.org/images/entities/char_2009.gif) 1 shows an initial fast phase with a rate constant of 210.142 ± 2.496 s−1 and an amplitude of 0.543 ± 0.003 followed by a slower phase with a rate constant of 1120.800 ± 9.225 s−1 and an amplitude of 0.499 ± 0.003. However, at a ratio of 1
1 shows an initial fast phase with a rate constant of 210.142 ± 2.496 s−1 and an amplitude of 0.543 ± 0.003 followed by a slower phase with a rate constant of 1120.800 ± 9.225 s−1 and an amplitude of 0.499 ± 0.003. However, at a ratio of 1![[thin space (1/6-em)]](https://www.rsc.org/images/entities/char_2009.gif) :
:![[thin space (1/6-em)]](https://www.rsc.org/images/entities/char_2009.gif) 10, the obtained fast rate constant was 24.449 ± 1.75 s−1 with an amplitude of 14.111 ± 4.71 and the slower rate constant was 126.854 ± 1.37 s−1 with an amplitude of 0.784 ± 0.02. At ratio (1
10, the obtained fast rate constant was 24.449 ± 1.75 s−1 with an amplitude of 14.111 ± 4.71 and the slower rate constant was 126.854 ± 1.37 s−1 with an amplitude of 0.784 ± 0.02. At ratio (1![[thin space (1/6-em)]](https://www.rsc.org/images/entities/char_2009.gif) :
:![[thin space (1/6-em)]](https://www.rsc.org/images/entities/char_2009.gif) 1), the calculated fractional intensity is higher for the slow rate constant (83%) whereas at a ratio of 1
1), the calculated fractional intensity is higher for the slow rate constant (83%) whereas at a ratio of 1![[thin space (1/6-em)]](https://www.rsc.org/images/entities/char_2009.gif) :
:![[thin space (1/6-em)]](https://www.rsc.org/images/entities/char_2009.gif) 10, the higher calculated fractional intensity was obtained for the fast rate constant (78%). Thus, the obtained average rate constants for ratios 1
10, the higher calculated fractional intensity was obtained for the fast rate constant (78%). Thus, the obtained average rate constants for ratios 1![[thin space (1/6-em)]](https://www.rsc.org/images/entities/char_2009.gif) :
:![[thin space (1/6-em)]](https://www.rsc.org/images/entities/char_2009.gif) 1 and 1
1 and 1![[thin space (1/6-em)]](https://www.rsc.org/images/entities/char_2009.gif) :
:![[thin space (1/6-em)]](https://www.rsc.org/images/entities/char_2009.gif) 10 were 966.5 s−1 and 47.4 s−1, respectively. This indicates that at the lower molar ratio of 1
10 were 966.5 s−1 and 47.4 s−1, respectively. This indicates that at the lower molar ratio of 1![[thin space (1/6-em)]](https://www.rsc.org/images/entities/char_2009.gif) :
:![[thin space (1/6-em)]](https://www.rsc.org/images/entities/char_2009.gif) 1, the [MB · complementary oligonucleotide] equilibrium (plateau region) is reached at a slower pace, as expected. However, the difference registered between ratios for the miRNA-21 specific MB (Fig. 6B) hybridization is much higher then what is observed for the poly-A MB (Fig. 6A). The fluorescence emission intensity of miRNA-21 specific MB upon addition of a non-complementary poly-A oligonucleotide was also monitored (Fig. 6B, black dashed line). No hybridization occurs, as expected.
1, the [MB · complementary oligonucleotide] equilibrium (plateau region) is reached at a slower pace, as expected. However, the difference registered between ratios for the miRNA-21 specific MB (Fig. 6B) hybridization is much higher then what is observed for the poly-A MB (Fig. 6A). The fluorescence emission intensity of miRNA-21 specific MB upon addition of a non-complementary poly-A oligonucleotide was also monitored (Fig. 6B, black dashed line). No hybridization occurs, as expected.
3.4 Photonic immobilization using LAMI and visual detection using CFM – fluorescent label detection
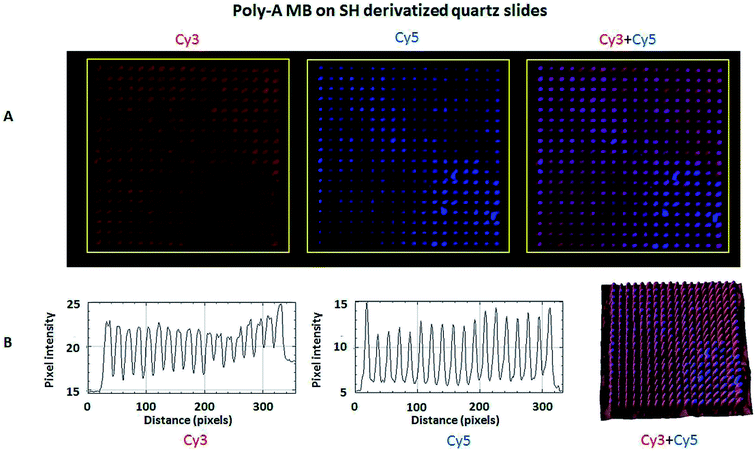
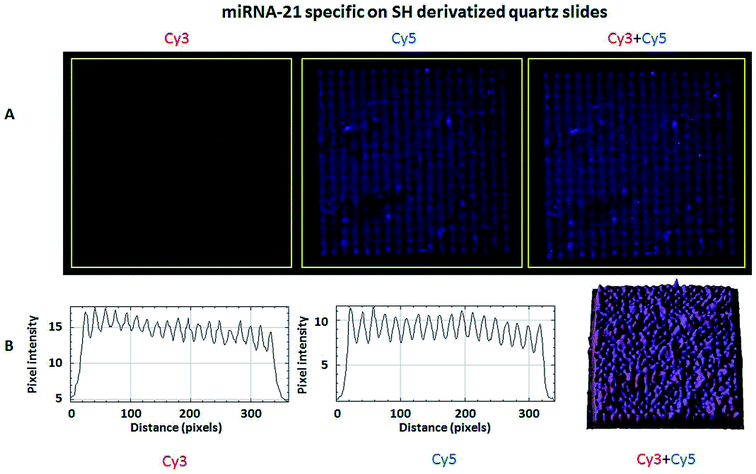
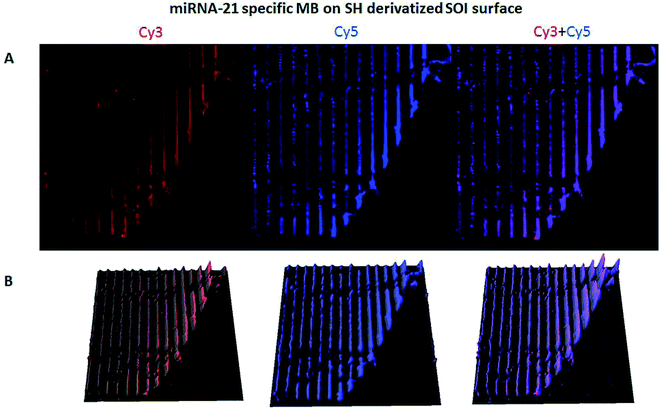
The hybridization of immobilized poly-A MB and mi-RNA specific MB constructs with their respective complementary oligonucleotides can be observed in Fig. 8A and 9A. The fluorescence intensity emission of both Cy3 (λem from ≈570 nm to 650 nm, present in the MBs) and Cy5 (λem from ≈700 nm to 780 nm, present in the complementary oligonucleotides) was monitored upon excitation at 543 nm (Cy3 excitation wavelength). In Fig. 8A and 9A are depicted Cy3 emission (left) for the immobilized poly-A MB and miRNA-21 MB constructs, respectively, and Cy5 emission (center) for the respective complementary oligonucleotides. Fig. 8A and 9A (right panels) were obtained through an overlap of the respective Cy3 and Cy5 emissions images. Both emissions are spatially overlapped, revealing co-localization of both fluorophores and thus, hybridization between the immobilized MB constructs and their respective complementary oligonucleotides. An average fluorescence emission intensity profile was obtained for each of the individual images as well as a 3D plot of the co-localization images (Fig. 8B and 9B). The confocal fluorescence images obtained for the immobilized poly-A MB array (Cy3 emission, Fig. 8A, left panel) and for the hybridization with the respective complementary poly-T oligonucleotide (Cy5 emission, Fig. 8A, center panel) show a clear profile with sharp and defined peaks (Fig. 8B, left and center panels). The 3D plot of the co-localized Cy3 and Cy5 emissions also shows a defined array pattern, with a homogeneous distribution of the spots inside the array (Fig. 8B, right panel). The array images obtained for the immobilized miRNA-21 specific MB construct (Cy3 emission) and for the hybridized complementary oligonucleotide (Cy5 emission) appear less defined (Fig. 9A, left and center panel, respectively) but the array pattern is still perceptible. The average fluorescence emission intensity profile analysis (Fig. 9B, left and center panel, respectively) reveals the presence of peaks periodically distributed, which location is correlated with each vertical line of the array pattern. These peaks are well defined but less spatially resolved than the peaks observed for the average intensity profile of the images obtained from both the immobilized poly-A MB constructs and the hybridized poly-A MB with its respective complementary oligonucleotide. The 3D plot of the overlapped Cy3 and Cy5 images (immobilized MB construct and complementary oligonucleotide, respectively) shows the co-localization between the immobilized miRNA-21 specific MB and the respective complementary oligonucleotide (Fig. 9B, right panel). However, as observed for the individual Cy3 and Cy5 emission images, the spots inside the array pattern are homogenously distributed but poorly resolved, with some background noise between spots.
An overlap of both images (Cy3 and Cy5 emissions) was also performed (Fig. 11A, right panel). The co-localization of the immobilized MB construct and the fluorescently labeled oligonucleotide is observed, proving successful hybridization. The 3D plot also shows the overlap, maintaining the resolution of the immobilized pattern and showing that both the immobilization and the hybridization took place in a spatially oriented manner (Fig. 11B).
3.5 Photonic immobilization with LAMI of miRNA-21 specific MB construct photonic-based detection on SOI surfaces with PBG sensing structures – label-free detection
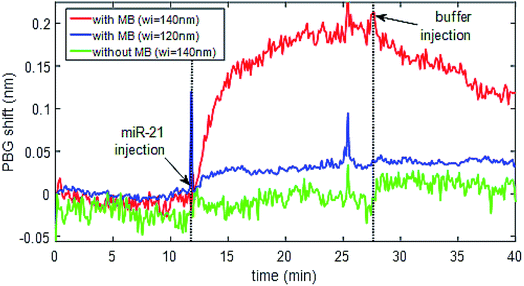
Once the immobilization of the MB probes was tested on SOI surfaces and the detection of their complementary miRNA targets was successfully validated by means of fluorescence-based measurements, a photonic-based detection experiment was performed using nanophotonic sensing structures fabricated on those SOI substrates. To this aim, a photonic chip having several photonic bandgap (PBG) sensing structures (Fig. 4) was used. The photonic sensing chips were biofunctionalised using the LAMI immobilization protocol with diffuse irradiation of the sample instead of focused light. The miRNA-21 specific MB construct was immobilized in two of the PBG sensors pairs while leaving another PBG sensors pair free (i.e., with the organosilane on the surface, but no irradiated miRNA-21 specific MB construct on it). Fig. 12 shows the sensing response for some representative PBG sensing structures on the chip. It can be observed that the PBG sensing structures having the MB construct immobilized are able to detect the presence of the specific target miRNA-21 (red and blue lines), while no sensing response was obtained for that PBG sensor where the MB probe has not been immobilized (green line). The signal obtained for miRNA-21 detection was higher (≈4×) for the structure with wider transversal elements (wi = 140 nm, red line) than the signal obtained for miRNA-21 detection from the narrower transversal elements (wi = 120 nm, blue line). Therefore, we can see that the physical parameters of the PBG sensing structure have a dramatic influence on the sensitivity, obtaining a sensing signal ∼4 times higher for the structure having wider transversal elements on the PGB sensing structure (red line), what highlights the importance of a proper design in order to obtain an optimized sensitivity.4 Discussion
4.1 Steady state fluorescence studies – hybridization kinetics
The presence of tryptophan in the peptide construct and its proximity to the disulphide bridge is crucial for LAMI. Upon 280 nm excitation, tryptophan undergoes photoionization. The resulting ejected electron is most likely to react with nearby disulphide bridges.31 A disulphide electron adduct is formed which dissociates, leading to the breakage of the disulphide bridge. As a result, free thiol group(s) will be formed, which covalently bind to thiol derivatized surfaces,17,30 enabling the spatially oriented immobilization of the MB constructs. The monitored emission spectra upon excitation at 295 nm (wavelength for selective excitation of Trp) displayed a maximum intensity peak at 353 nm. Tryptophan has an emission maximum in water close to 350 nm, being its emission highly dependent on solvent polarity and the surrounding environment.37 Thus, the presence of this amino acid residue in the peptide was confirmed (see Fig. S4†).The hybridization rate of poly-A MB (Fig. 6A) and miRNA-21 specific MB (Fig. 6B) constructs with their respective targets is concentration dependent. In general, an initial fast binding phase is observed at all ratios followed by a slower phase until equilibrium is reached. For higher concentrations of oligonucleotide (ratio 1![[thin space (1/6-em)]](https://www.rsc.org/images/entities/char_2009.gif) :
:![[thin space (1/6-em)]](https://www.rsc.org/images/entities/char_2009.gif) 10), this initial phase is almost immediate and equilibrium is reached within minutes (≈2.5 min for poly-A MB and ≈ 6 min for miRNA-21 specific MB). For lower MB/oligonucleotide ratio (1
10), this initial phase is almost immediate and equilibrium is reached within minutes (≈2.5 min for poly-A MB and ≈ 6 min for miRNA-21 specific MB). For lower MB/oligonucleotide ratio (1![[thin space (1/6-em)]](https://www.rsc.org/images/entities/char_2009.gif) :
:![[thin space (1/6-em)]](https://www.rsc.org/images/entities/char_2009.gif) 1), this equilibrium is reached at ≈25 min for poly-A MB but for the miRNA MB it can take up to 60 min. Hybridization consists of three steps which, in most cases, happens simultaneously: (a) the target binds to the MB probe domain which remains in a closed loop; (b) the loop opens as the number of bound base pairs increases; (c) binding of target base pairs to the remaining base pairs in the MB.34 It is reasonable to assume that the hybridization rate is faster in the presence of an excess of oligonucleotide as there is a higher probability for the target sequence to find the MB loop. As concentrations are lowered, steps (a) and (b) are dependent on target sequence/MB loop proximity which might reduce the speed at which these two events occur. Steps (a) and (b) are then the limiting steps for the hybridization reaction and the presence of Cy3 at the stem of the MB does not affect the hybridization rate.34
1), this equilibrium is reached at ≈25 min for poly-A MB but for the miRNA MB it can take up to 60 min. Hybridization consists of three steps which, in most cases, happens simultaneously: (a) the target binds to the MB probe domain which remains in a closed loop; (b) the loop opens as the number of bound base pairs increases; (c) binding of target base pairs to the remaining base pairs in the MB.34 It is reasonable to assume that the hybridization rate is faster in the presence of an excess of oligonucleotide as there is a higher probability for the target sequence to find the MB loop. As concentrations are lowered, steps (a) and (b) are dependent on target sequence/MB loop proximity which might reduce the speed at which these two events occur. Steps (a) and (b) are then the limiting steps for the hybridization reaction and the presence of Cy3 at the stem of the MB does not affect the hybridization rate.34
The length of the MB stem also influences the speed at which step (a) occurs. In this study, both poly-A MB and miRNA-21 specific MB have a stem composed of 4 GC base pairs. However, the miRNA-21 specific MB possesses an extra A–T pairing at the stem from the miRNA-21 specific loop. The observed binding kinetics is 17.5× faster for the poly-A MB and its target sequence at a ratio of 1![[thin space (1/6-em)]](https://www.rsc.org/images/entities/char_2009.gif) :
:![[thin space (1/6-em)]](https://www.rsc.org/images/entities/char_2009.gif) 1 (Table 2) when compared with the miRNA-21 MB and its target at a ratio of 1
1 (Table 2) when compared with the miRNA-21 MB and its target at a ratio of 1![[thin space (1/6-em)]](https://www.rsc.org/images/entities/char_2009.gif) :
:![[thin space (1/6-em)]](https://www.rsc.org/images/entities/char_2009.gif) 1. This might be due to the simplicity of the sequence as it is composed of a single nucleotide repetition, making it easier for binding to occur. Also, it might be due to the extra A–T pairing in the stem of the miRNA-21 specific MB. Nonetheless, the hybridization of the two MBs with their respective complementary oligonucleotide was monitored by two different fluorescence emission processes (unquenching and FRET), which might also influence the observed result.
1. This might be due to the simplicity of the sequence as it is composed of a single nucleotide repetition, making it easier for binding to occur. Also, it might be due to the extra A–T pairing in the stem of the miRNA-21 specific MB. Nonetheless, the hybridization of the two MBs with their respective complementary oligonucleotide was monitored by two different fluorescence emission processes (unquenching and FRET), which might also influence the observed result.
4.2 Photonic immobilization with LAMI and visual detection of hybridization by CFM
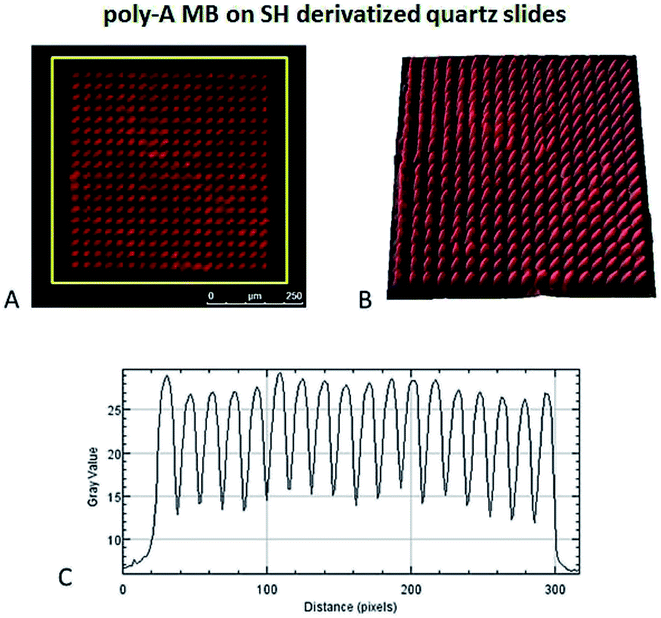
The poly-A MB construct immobilization was successful (Fig. 7) and a spatially oriented immobilization was achieved due to the spatially controlled illumination.The immobilized poly-A MB construct presents a closed loop conformation, as it has not been exposed to its target sequence. This means that the fluorescence emission of the MB in this state is less intense than when in the open form due to the close spatial proximity of DABCYL (quencher) to Cy3, both present in the stem of the loop (see Fig. 3). However, even in the quenched form, Cy3 fluoresces, allowing the visualization of the immobilized array (see Fig. 7). Such residual Cy3 fluorescence emission was also observed in the initial baseline monitored during the hybridization studies (Fig. 6).
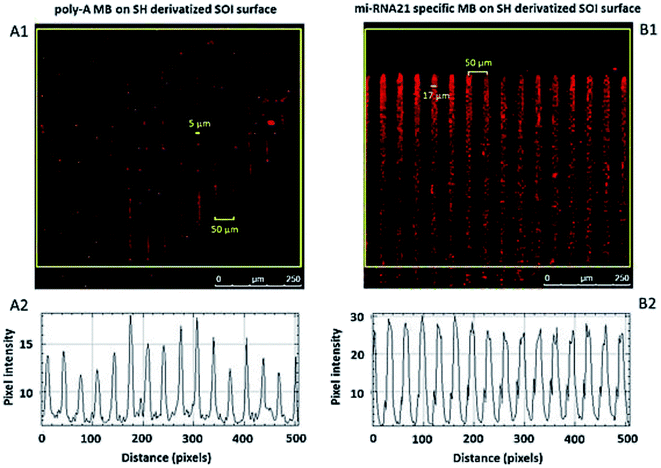
Even though the presence of background fluorescence has been a drawback in the past,38 data showed that there was a good signal-to-background ratio upon hybridization with the target sequence (S/N ratio below 14.5 for hybridization with miRNA-21 specific and below 3.8 for hybridization with poly-A MB). Furthermore, previous data of immobilized poly-A MB construct showed the increase in the array's fluorescence emission signal upon hybridization with the target sequence due to unquenching.36 Successful hybridization of the immobilized MB constructs with the target oligonucleotide sequences was also done using FRET (Fig. 8, 9, 10 and 11), both on optically flat thiol derivatized quartz and thiol derivatized SOI surfaces.
The SOI derivatized surfaces are to be integrated in a POC diagnostic device. LAMI presents some advantages over other traditional immobilization techniques. Conventional techniques cannot achieve spatially oriented immobilization of biosensors nor can they assure an immobilized homogeneous monolayer.39 LAMI is able to achieve covalent immobilization of biosensors in a spatially oriented manner, avoiding the crowding effect that hinders hybridization due to high density of the immobilized probes.39 Also, LAMI presents high reproducibility and allows for immobilization of proteins, antibodies and MB constructs without compromising the bioavailability of the immobilized biosensors. Furthermore, it does not require high temperatures for hybridization to occur39 as the hybridization results presented in this paper were obtained at room temperature. Although LAMI uses 280 nm light to achieve immobilization, it does not hinder the biosensors ability to recognize their analytes. UVB light (280–315 nm) has been reported to cause damage to DNA. Deamination of bases, depyrimidination and depurination as well as formation of free radicals or reactive oxygen species are some of the UV induced possible changes.40 However, both immobilized MBs were capable of recognizing the target sequences. Illumination time applied for the immobilization of MB patterns was very short (ms), as the velocity of the moving stage upon illumination was of 100 μm s−1. Thus, the hybridization between the target sequences and the immobilized MB constructs hereby reported was not hindered by the immobilization process.
The excitation wavelength chosen (laser line at 543 nm) for CFM imaging was close to the maximum excitation wavelength described for Cy3 (≈548 nm) and the monitored emission wavelengths correspond to intervals where both Cy3 and Cy5 emit, respectively. At 700 nm (approximate lower limit of the interval in which Cy5 fluorescence emission was monitored), there is almost no fluorescent emission for Cy3 (≈2% relative to its maximum absorption intensity) whereas for Cy5 the fluorescence emission intensity at this wavelength is ≈28%. Furthermore, at the excitation wavelength selected, Cy5 has only a residual absorption of 6% (compared to its maximum absorption intensity).35 As a consequence, the monitored fluorescence emission intensity is mainly due to FRET, even though some background fluorescence might be visible in the wavelength interval monitored for Cy5 emission. Control experiments where the immobilized Cy3 labelled poly-A MB construct was hybridized with a Cy5 labelled non-complementary oligonucleotides (poly-A oligonucleotide) show that there is no Cy5 emission (upon Cy3 excitation) (Fig. S5†). When using the miRNA-21 MB construct, a faint residual Cy5 signal can be observed (Fig. S6†).
The focal distance also influences the pattern spatial distribution. Fig. 10A1 and B1 show a difference in the thickness of the lines in the immobilized patterns. Although both arrays were designed under the same conditions, a small difference in the focal distance influences the immobilized pattern. The pattern immobilized with more focused light displays lines with ≈5 μm width whereas the pattern immobilized with less focused light displays lines with a width of ≈17 μm, even though both patterns present a distance between lines of 50 μm, as specified in the design. All MB constructs were immobilized with μm resolution.
4.3 Photonic immobilization with LAMI and photonic-based detection on SOI chips with PBG sensing structures – label-free detection
The detection of LAMI immobilized miRNA-21 specific MB using PBG structures was successful. However, it was observed that the sensitivity of detection is dependent on physical parameters such as the width of the transversal elements of the sensing structures and also the presence of SiO2 in these structures. As the PBG sensing structures need to be in contact with the medium to be analysed, windows are opened in the SiO2 upper cladding just in the positions where they are placed by UV lithography and etching of the SiO2. After opening these windows, a more robust photonic chip is obtained, but the presence of some SiO2 residues in the walls of the PBG sensing structures produces a decrease of its sensitivity. This trade-off between chip robustness and sensitivity needs to be overcome in future sensing chips developments. The physical parameters of the PBG sensing structure also have a dramatic influence on the sensitivity. The acquired sensing signal for the structure having wider transversal elements of the PGB sensing structure was ∼4 times higher (Fig. 12, red line) than the signal obtained for the narrower transversal elements of the PBG sensing structure (Fig. 12, blue line). This sensitivity difference is higher than what it might be expect (around 1.5× from previous experiments), possibly due to the non-uniform presence of the SiO2 residues from the upper cladding layer. Nanophotonic sensing technology is characterized by a very high sensitivity, which comes from the high interaction occurring between the light confined in the photonic structures and the target analytes in a reduced size structure. Additionally, the type of PBG sensing structures used in this work have demonstrated an even higher sensitivity,41 which is determined by the appearance of the so-called slow-wave behavior that induces a more effective interaction with the target analyte during a longer time.5 Conclusions
The new MB constructs presented in this paper were able to recognize target sequences in vitro. One of such sequences is a biomarker for colon and breast cancer. The recognition achieved by the two MB constructs was assessed by two different fluorescence recognition methods. These constructs were successfully immobilized onto thiol reactive surfaces using LAMI. LAMI presents some advantages over more conventional immobilization techniques as it allows for immobilization in spatially oriented and covalent manner and with μm resolution (sub-μm resolution can also be achieved).22,23 Biosensors bioavailability is not compromised by the UV light used for immobilization, making these biosensors and LAMI suitable to produce arrays for integration in POC diagnostic devices and used in this specific project for the detection of cancer biomarkers.Conflicts of interest
The authors declare no conflicts of interest.Acknowledgements
This work was supported by the European Commission through the project H2020-644242 – SAPHELY and the project H2020-634013-2-PHOCNOSIS.References
- New Global Cancer Data: GLOBOCAN 2018|UICC, https://www.uicc.org/new-global-cancer-data-globocan-2018, accessed 14 December 2018.
- WHO|Cancer, http://www.who.int/cancer/en/, accessed 14 December 2018.
- WHO|Cancer, http://www.who.int/mediacentre/factsheets/fs297/en/, accessed 16 August 2017.
- Y. Li, C. Qiu, J. Tu, B. Geng, J. Yang, T. Jiang and Q. Cui, HMDD v2.0: a database for experimentally supported human microRNA and disease associations, https://academic.oup.com/nar/article-lookup/doi/10.1093/nar/gkt1023, accessed 16 August 2017 Search PubMed.
- G. A. Calin, C. D. Dumitru, M. Shimizu, R. Bichi, S. Zupo, E. Noch, H. Aldler, S. Rattan, M. Keating, K. Rai, L. Rassenti, T. Kipps, M. Negrini, F. Bullrich and C. M. Croce, Proc. Natl. Acad. Sci. U. S. A., 2002, 99, 15524–15529 CrossRef CAS PubMed.
- M. D. Jansson and A. H. Lund, Mol. Oncol., 2012, 6, 590–610 CrossRef CAS PubMed.
- Y. S. Lee and A. Dutta, Annu. Rev. Pathol., 2009, 4, 199–227 CrossRef CAS PubMed.
- S. Volinia, G. A. Calin, C.-G. Liu, S. Ambs, A. Cimmino, F. Petrocca, R. Visone, M. Iorio, C. Roldo, M. Ferracin, R. L. Prueitt, N. Yanaihara, G. Lanza, A. Scarpa, A. Vecchione, M. Negrini, C. C. Harris and C. M. Croce, Proc. Natl. Acad. Sci. U. S. A., 2006, 103, 2257–2261 CrossRef CAS PubMed.
- J. Iqbal, Y. Shen, X. Huang, Y. Liu, L. Wake, C. Liu, K. Deffenbacher, C. M. Lachel, C. Wang, J. Rohr, S. Guo, L. M. Smith, G. Wright, S. Bhagavathi, K. Dybkaer, K. Fu, T. C. Greiner, J. M. Vose, E. Jaffe, L. Rimsza, A. Rosenwald, G. Ott, J. Delabie, E. Campo, R. M. Braziel, J. R. Cook, R. R. Tubbs, J. O. Armitage, D. D. Weisenburger, L. M. Staudt, R. D. Gascoyne, T. W. McKeithan and W. C. Chan, Blood, 2015, 125, 1137–1145 CrossRef CAS PubMed.
- S. Thakur, R. K. Grover, S. Gupta, A. K. Yadav and B. C. Das, PLoS One, 2016, 11, e0158946 CrossRef PubMed.
- A. Bunschoten, T. Buckle, J. Kuil, G. D. Luker, K. E. Luker, O. E. Nieweg and F. W. B. van Leeuwen, Biomaterials, 2012, 33, 867–875 CrossRef CAS PubMed.
- C. Glinge, S. Clauss, K. Boddum, R. Jabbari, J. Jabbari, B. Risgaard, P. Tomsits, B. Hildebrand, S. Kää, R. Wakili, T. Jespersen and J. Tfelt-Hansen, PLoS One, 2017, 12(2), e0167969 CrossRef PubMed.
- P. S. Mitchell, R. K. Parkin, E. M. Kroh, B. R. Fritz, S. K. Wyman, E. L. Pogosova-Agadjanyan, A. Peterson, J. Noteboom, K. C. O'Briant, A. Allen, D. W. Lin, N. Urban, C. W. Drescher, B. S. Knudsen, D. L. Stirewalt, R. Gentleman, R. L. Vessella, P. S. Nelson, D. B. Martin and M. Tewari, Proc. Natl. Acad. Sci. U. S. A., 2008, 105, 10513–10518 CrossRef CAS PubMed.
- J. A. Weber, D. H. Baxter, S. Zhang, D. Y. Huang, K. H. Huang, M. J. Lee, D. J. Galas and K. Wang, Clin. Chem., 2010, 56(11), 1733–1741 CrossRef CAS PubMed.
- Globocan 2012 – Home, http://globocan.iarc.fr/Default.aspx, accessed 16 August 2017.
- M. T. Neves-Petersen, T. Snabe, S. Klitgaard, M. Duroux and S. B. Petersen, Protein Sci., 2006, 15, 343–351 CrossRef CAS PubMed.
- M. T. Neves-Petersen, M. Duroux, E. Skovsen, L. Duroux and S. B. Petersen, J. Nanosci. Nanotechnol., 2009, 9, 3372–3381 CrossRef CAS PubMed.
- E. Skovsen, T. Neves-Petersen, L. Duroux and S. Petersen, Advanced Biomedical and Clinical Diagnostic Systems VI, Proc. of SPIE, 2008, vol. 6848, p. 68480O-1 Search PubMed.
- E. Skovsen, M. Duroux, M. T. Neves-Petersen, L. Duroux and S. B. Petersen, Int. J. Optomechatronics, 2007, 1, 383–391 CrossRef.
- M. Duroux, E. Skovsen, M. T. Neves-Petersen, L. Duroux, L. Gurevich and S. B. Petersen, Proteomics, 2007, 7, 3491–3499 CrossRef CAS PubMed.
- E. Skovsen, M. T. Neves-Petersen, A. Kold, L. Duroux and S. B. Petersen, J. Nanosci. Nanotechnol., 2009, 9, 4333–4337 CrossRef CAS PubMed.
- E. Skovsen, A. B. Kold, M. T. Neves-Petersen and S. B. Petersen, Proteomics, 2009, 9, 3945–3948 CrossRef CAS PubMed.
- S. B. Petersen, A. Kold di Gennaro, M. T. Neves-Petersen, E. Skovsen and A. Parracino, Appl. Opt., 2010, 49, 5344–5350 CrossRef CAS PubMed.
- P. Jonkheijm, D. Weinrich, H. Schröder, C. M. Niemeyer and H. Waldmann, Angew. Chem., Int. Ed., 2008, 47, 9618–9647 CrossRef CAS PubMed.
- D. S. Wilson and S. Nock, Curr. Opin. Chem. Biol., 2002, 6, 81–85 CrossRef CAS PubMed.
- B. Johnsson, Anal. Biochem., 1991, 277, 268–277 CrossRef.
- A. Collioud, J. F. Clémence, M. Sänger and H. Sigrist, Bioconjugate Chem., 1993, 4, 528–536 CrossRef CAS PubMed.
- R. Y. Sweeney, B. R. Kelemen, K. J. Woycechowsky and R. T. Raines, Anal. Biochem., 2000, 286, 312–314 CrossRef CAS PubMed.
- M. T. Petersen, P. H. Jonson and S. B. Petersen, Protein Eng., 1999, 12, 535–548 CrossRef CAS PubMed.
- M. T. Neves-Petersen, Z. Gryczynski, J. Lakowicz, P. Fojan, S. Pedersen, E. Petersen and S. B. Petersen, Protein Sci., 2002, 11, 588–600 CrossRef CAS PubMed.
- M. T. Neves-Petersen, S. Klitgaard, T. Pascher, E. Skovsen, T. Polivka, A. Yartsev, V. Sundström and S. B. Petersen, Biophys. J., 2009, 97, 211–226 CrossRef PubMed.
- Black Hole Quencher® Dyes|LGC Bioresearch Technologies, https://www.biosearchtech.com/support/education/fluorophores-and-quenchers/black-hole-quencher-dyes, accessed 12 December 2017 Search PubMed.
- M. Zuker, Nucleic Acids Res., 2003, 31, 3406–3415 CrossRef CAS PubMed.
- A. Tsourkas, M. A. Behlke, S. D. Rose and G. Bao, Nucleic Acids Res., 2003, 31, 1319–1330 CrossRef CAS PubMed.
- Thermo Fisher Scientific Inc., Fluorescence SpectraViewer, https://www.thermofisher.com/dk/en/home/life-science/cell-analysis/labeling-chemistry/fluorescence-spectraviewer.html, accessed 7 November 2017.
- O. Gonçalves, S. Snider, R. Zadoyan, Q.-T. Nguyen, H. Vorum, S. B. Petersen and M. T. Neves-Petersen, Reporters, Markers, Dyes, Nanoparticles, and Molecular Probes for Biomedical Applications IX, Proc. of SPIE, 2017, vol. 10079, p. 100790F-1 Search PubMed.
- J. R. Lakowicz, Principles of fluorescence spectroscopy, Academic/Plenum Publishers, New York, 2nd edn, 1999 Search PubMed.
- C. S. Wu, L. Peng, M. You, D. Han, T. Chen, K. R. Williams, C. J. Yang and W. Tan, Int. J. Mol. Imaging, 2012, 2012, 501579 Search PubMed.
- S. B. Nimse, K. Song, M. D. Sonawane, D. R. Sayyed and T. Kim, Sensors, 2014, 14, 22208–22229 CrossRef PubMed.
- R. P. Rastogi, A. K. Richa, M. B. Tyagi and R. P. Sinha, J. Nucleic Acids, 2010, 2010, 592980 CrossRef PubMed.
- Á. Ruiz-Tórtola, F. Prats-Quílez, D. González-Lucas, M.-J. Bañuls, Á. Maquieira, G. Wheeler, T. Dalmay, A. Griol, J. Hurtado and J. García-Rupérez, Biomed. Opt. Express, 2018, 9, 1717–1727 CrossRef PubMed.
Footnote |
| † Electronic supplementary information (ESI) available. See DOI: 10.1039/c9ra00081j |
| This journal is © The Royal Society of Chemistry 2019 |

