 Open Access Article
Fe substitution in urchin-like NiCo2O4 for energy storage devices†
Yuan Yuan,
Duanfu Long,
Zhong Li and
Jiliang Zhu *
*
College of Materials Science and Engineering, Sichuan University, Chengdu 610064, China. E-mail: jlzhu167@scu.edu.cn
First published on 5th March 2019
Abstract
A composite of NiCo2−xFexO4 was designed to investigate the effects of Fe substitution on its energy storage performance. Urchin-like products composed of nanowires were successfully synthesized through the hydrothermal method and calcinations. Scanning electron microscopy (SEM) images revealed that Fe substitution could reduce the diameter of the nanowires and hinder the urchin-like sphere construction. X-ray diffraction (XRD), energy dispersive X-ray mapping (EDS-mapping) and X-ray photoelectron spectroscopy (XPS) revealed the successful Fe substitution for Co. More importantly, the specific capacity could be largely improved from 359 C g−1 (826 F g−1) for x = 0 to 523 C g−1 (1188 F g−1) for x = 0.3 at 1 A g−1. Moreover, with x = 0.3, a specific capacity of 788 F g−1 could be maintained as the current density was increased to 20 A g−1. Asymmetric supercapacitors based on this compound exhibited an energy density of 26.6 W h kg−1 at a power density of 370 W kg−1.
1. Introduction
Due to the inevitable consumption of energy in modern life, energy storage devices with a higher energy density, a higher power density and a long cycle life, are in urgent need of development. Among all kinds of energy storage devices, supercapacitors, which possess a higher energy density than conventional capacitors and a higher power density than batteries, have emerged as promising candidates and have been largely developed in the past two decades.1–3 Basically, electrode materials for supercapacitors are often divided into two types based on different charge storage mechanisms: (i) materials exhibiting electrochemical double layer capacitance (EDLC), based on the charge accumulation at the interface of the electrode and the electrolyte; (ii) materials exhibiting pseudocapacitance, based on the faradaic redox reactions at the electrode surface.4 Conventional supercapacitor devices are symmetric and based on EDLC materials (usually carbon-based materials), such devices often provide a very limited potential window. Moreover, the specific capacitance of carbon-based materials is relatively small (usually less than 400 F g−1). To resolve this issue, asymmetric supercapacitors using activated carbon as a negative electrode and pseudocapacitive materials (e.g. Ni0.25Mn0.75O5 and polyaniline6) as positive electrodes have been built. Such constructions take advantage of the different stable potential windows of the negative and positive materials, thus providing a large potential window.7Recently, although categorized as battery-type materials,8 nickel and cobalt oxides,9–23 sulfides24–26 and hydroxides27–29 have aroused a great deal of research interest. Their combinations with a supercapacitor-type material (activated carbon for instance) could provide a large potential window and a high specific capacitance, resulting in a high energy density for the whole device. Spinel nickel cobaltite (NiCo2O4) possesses a much higher electronic conductivity and richer electrochemical activity than simple nickel oxides or cobalt oxides,10,12 making it a promising candidate for energy storage devices among these nickel- and cobalt-based materials. Lots of efforts have been made to improve the energy storage performance of NiCo2O4. Different microstructures of NiCo2O4 like nanosheets,11 nanowires,12,16 nanocages,23 hollow spheres13–15 and urchin-like structures20,21 have been synthesised in previous studies. Such fine microstructures could commonly provide a large contact area with the electrolyte and good channels for ionic transport, which can effectively enhance the specific capacity and rate ability of the electrode materials. Other ways to modify NiCo2O4, such as fabricating low-crystalline porous nanosheets30 combined with other materials (NiWO4 (ref. 31) for instance) and using NiCo2O4 itself as a template,32,33 were also reported to improve its energy storage properties. It was also reported that the electrochemical properties of NiCo2O4 can be optimized through an appropriate choice of the KOH electrolyte concentration.34
Moreover, other materials analogous to NiCo2O4, such as NiMn2O4 (ref. 35), ZnCo2O4 (ref. 36) and CuCo2O4 (ref. 37) were also investigated. However, few has been reported on how the energy storage properties of NiCo2O4 change when a third transition metal is doped. It is well-known that atoms of iron, nickel and cobalt have lots of similarities. Different ternary metal oxides, such as FeCo2O4 (ref. 38 and 39) and NiFe2O4,40–42 have been synthesized and used in lithium-ion batteries or supercapacitors. For example, Chenguo Hu et al. synthesized a NiFe2O4 nanocone forest through a hydrothermal method with the help of urea, and the resulting flexible supercapacitors showed a high energy density of 54.9 W h kg−1 and a long cycling life.42 Moreover, to the best of our knowledge, in the context of energy storage applications, little has been reported on the doping of Fe into NiCo2O4 crystals, particularly, when based on the formula of NiCo2−xFexO4. Thus, we think it would be interesting to find out what would happen by doping Fe into NiCo2O4.
In this study, urchin-like NiCo2O4 was successfully synthesized through a hydrothermal method and calcination. Based on which, the effects of Fe substitution were investigated through compounds or composites of NiCo2−xFexO4. It was found that both the microstructure and chemical environments were severely affected by Fe substitutions. More importantly, the energy storage performance can be effectively improved from 359 C g−1 (826 F g−1) for x = 0 to 523 C g−1 (1188 F g−1) for x = 0.3 at 1 A g−1. For x = 0.3, a retention of 788 F g−1 could be obtained when the current density was increased to 20 A g−1. Asymmetric cells based on NiCo1.7Fe0.3O4 (cathodes) and commercially activated carbon (anodes) were assembled, and an energy density of 26.6 W h kg−1 at a power density of 370 W kg−1 could be obtained.
2. Experimental
2.1 Materials synthesis
All reagents were of analytical grade and used without out further purification. Typically to synthesize NiCo2−xFexO4 (x = 0–0.6), 36 mmol urea (CO(NH2)2), 4 mmol NiCl2·6H2O, (8–4x) mmol CoCl2·6H2O and 4x mmol FeCl3·6H2O were dissolved in 60 mL H2O and mixed sufficiently to form a transparent solution. Then, the solution was transferred into a Teflon-lined stainless autoclave (100 mL) and maintained at 100 °C for 6 hours in an oven. After cooling down to room temperature, the precipitate was collected through filtration and washed with deionized water and ethanol thoroughly. The dried precursors were calcined at 300 °C in air for 1 hour with a heating rate of 1 °C min−1 to obtain resultant compounds in oxide form.2.2 Materials characterization
The microstructures of the as-prepared products were investigated using a field emission scanning electron microscope (FE-SEM, JSF-7500F, Japan). Energy-dispersive X-ray spectroscopy mapping (EDS-mapping) was also conducted to detect elemental distributions. Powder X-ray diffractions (XRD) were recorded using an X-ray diffractometer (DX-1000X) with Cu Kα (λ = 0.15406 nm). X-ray photoelectron spectroscopy (XPS) (XSAM 800, Kratos, UK) was performed to investigate the chemical environments of the materials. Nitrogen adsorption/desorption measurements were performed on a Micromeritics ASAP 2460 system.2.3 Electrochemical measurement
Measurements using cyclic voltammetry (CV), electrochemical impedance spectroscopy (EIS) and galvanostatic charge–discharge (GCD) were conducted to reveal the electrochemical performance on an electrochemical workstation (CHI 660E, Chenhua, China). To fabricate working electrodes, active materials, conducting carbon black and polyvinylidene difluoride (PVDF) were mixed with a weight ratio of 8![[thin space (1/6-em)]](https://www.rsc.org/images/entities/char_2009.gif) :
:![[thin space (1/6-em)]](https://www.rsc.org/images/entities/char_2009.gif) 1
1![[thin space (1/6-em)]](https://www.rsc.org/images/entities/char_2009.gif) :
:![[thin space (1/6-em)]](https://www.rsc.org/images/entities/char_2009.gif) 1 with the help of N-methyl-2-pyrrolidone (NMP) to form a homogeneous slurry, which was then pasted onto nickel foams and dried in an oven at 70 °C for 12 hours. For better conglutinations, the as-prepared electrodes were then pressed into a thin foil under a pressure of 6 MPa. Mass loadings of NiCo2−xFexO4 were controlled to 3–4 mg cm−1.
1 with the help of N-methyl-2-pyrrolidone (NMP) to form a homogeneous slurry, which was then pasted onto nickel foams and dried in an oven at 70 °C for 12 hours. For better conglutinations, the as-prepared electrodes were then pressed into a thin foil under a pressure of 6 MPa. Mass loadings of NiCo2−xFexO4 were controlled to 3–4 mg cm−1.
For tests in a three-electrode system, 2 M KOH was used as the electrolyte, a Pt sheet worked as the counter electrode and Ag/AgCl worked as the reference electrode. Specific capacity (Cs) was calculated based on the discharge curves of GCD according to the following formula:
 | (1) |
 in F g−1 was mainly used in this study and calculated based on the following formula:43,44
 | (2) |
Asymmetric cells were also assembled using electrodes of NiCo1.7Fe0.3O4 as positive electrodes and commercial activated carbon (YEC-8A, Fuzhou Yihuan Carbon. Ltd) as negative electrodes to investigate the potential of NiCo1.7Fe0.3O4 for practical applications. Particularly, an electrode of NiCo1.7Fe0.3O4 and an electrode of activated carbon, separated by a piece of cellulose paper, were sealed in 2032-coin cells. Drops of 2 M KOH was added as electrolyte simultaneously. The mass loadings of activated carbon (m−) were controlled in a certain ratio to the mass loadings of NiCo1.7Fe0.3O4 (m+) so as to balance the electric charge quantities stored on the negative electrode (q−) and the positive electrode (q+), namely, q− = q+. The energy density (E) and power density (P) were calculated based on the following formulas:43,44
 | (3) |
 | (4) |
3. Results and discussion
3.1 Microstructures and chemical environments
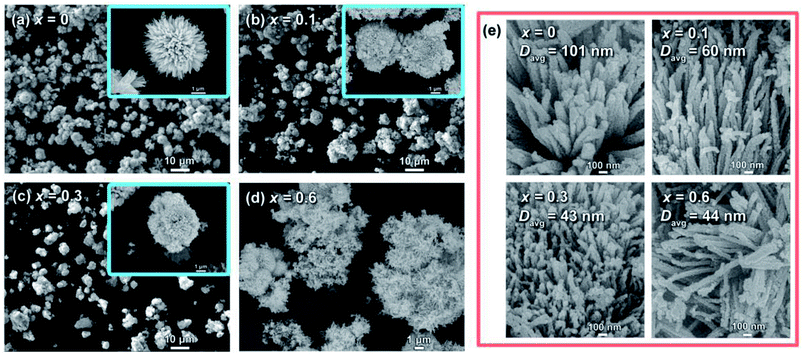
The morphological evolutions of the as-prepared NiCo2−xFexO4 were investigated using SEM as shown in Fig. 1. It can be seen that, without Fe substitution, the morphology shows a relatively uniform urchin-like structure. This “urchin” is spheroidal and composed of well-aligned nanowires, which is in accordance with former studies.20,21,25 However, as the content of Fe increased, deformations from the sphere could be observed clearly. Also, with x reaching 0.6, most of the nanowires simply stack on each other without any uniformity instead of forming a sphere. Moreover, changes in a single nanowire could be observed in enlarged views, as shown in Fig. 1e. Here, the average diameters (Davg) of these nanowires were measured to be 101 nm, 60 nm, 43 nm and 44 nm for x = 0, 0.1, 0.3 and 0.6, respectively. Thus, it could be concluded that Fe substitution affects the microstructures in two ways: (i) it hinders the spherical construction of the nanowires and more dopant means a larger disorder; (ii) a small amount of Fe substation could effectively restrict the growth of the nanowires, but further addition of Fe (x ≥ 0.3) can hardly lead to thinner nanowires.Commonly, it is thought that the electrochemical performance of active materials is strongly associated with the specific surface area (SSA) and pore size distributions.45,46 It has been revealed by SEM that Fe substitution importantly affects the microstructures. For investigation of the effects on the inner structures, nitrogen adsorption and desorption isotherms for x = 0 and x = 0.3 were recorded, as shown in Fig. 2a. Both curves show a steady increase in the medium relative pressure region and a sharp increase in the high relative pressure region. The increase in the medium region can be attributed to the capillary condensation and multilayer adsorption in the mesopores, and the increase in the high region is related to the adsorption in the interspace of the nanoparticles.45 Both curves show obvious hysteresis. Moreover, with P/P0 reaching approximately 1, an inflexion point could be seen for both as shown in the inset of Fig. 2a, implying that both curves belong to Type IV isotherms.47 Based on the Brunauer–Emmett–Teller (BET) method, the SSA of x = 0 and x = 0.3 were calculated to be 41.3 m2 g−1 and 64.8 m2 g−1, respectively. Also, through the Barrett–Joyner–Halenda (BJH) model, the pore size distributions were calculated based on the desorption data, as shown in Fig. 2b. It was revealed that the pores sizes were primarily distributed around 5.5 nm for both composites. However, the pores size distribution around 2–4 nm of x = 0.3 were largely improved compared to that of x = 0.
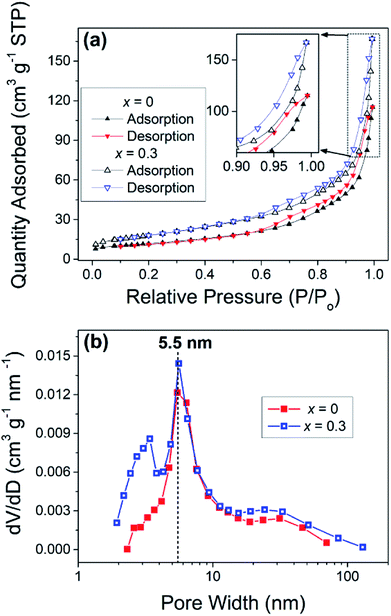 | ||
| Fig. 2 (a) Nitrogen adsorption–desorption isotherm of NiCo2−xFexO4 (x = 0 and 0.3) and (b) corresponding pore size distributions. | ||
To explore the exact phase structures of the as-prepared NiCo2−xFexO4, XRD experiments were performed and the results were shown in Fig. 3a. All the XRD patterns are in high agreement with JCPDF no. 20-0781, indicating that all the composites exhibit a pure spinel crystalline structure.11,48 Moreover, from the enlarged view of the (311) plane, as shown in Fig. 3b, with the increase in x, peaks of relatively low value can be seen shifting to a smaller angle. This could be attributed to the similar atomic structures of Fe and Co. Both the absence of a second phase and the small peak displacement imply the successful doping of Fe into the crystalline structure.
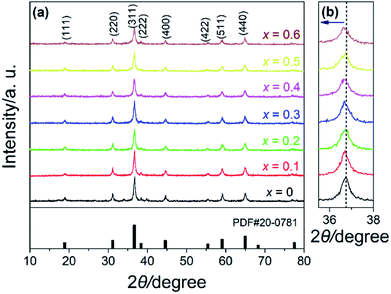 | ||
| Fig. 3 (a) XRD patterns of NiCo2−xFexO4 with x = 0–0.6 and values of JCPDF file no. 20-0781 and (b) enlarged view of (311) plane. | ||
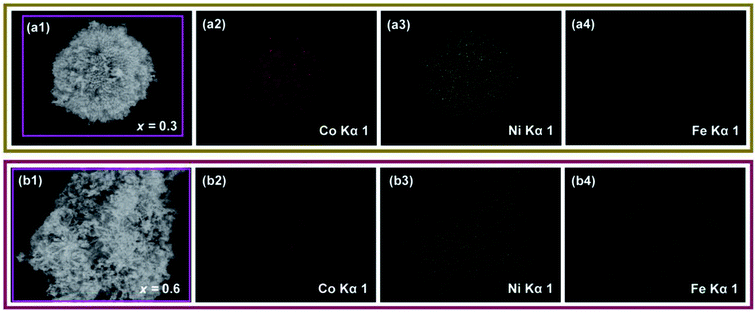
Successful Fe substitutions were further validated by EDS-mappings. Fig. 4a shows the EDS mapping of a single “urchin” with the composition of x = 0.3, and Fig. 4b shows the EDS-mappings of a stack of nanowires with the composition of x = 0.6. All the metal elements are homogenously distributed for both compositions. Obviously, the iron distribution of x = 0.6 is denser than that of x = 0.3, but in a homogeneous way as well. This indicates that iron distributes well regardless of morphologies, which is severely affected by the content of iron. This result also agrees well with the XRD patterns, which revealed that iron can be completely doped into the crystal even with a high content of x = 0.6.
To investigate how Fe substitution may affect the chemical environments, XPS measurements were performed. Fig. 5a gives the survey spectra of x = 0 and x = 0.3. Typical signals of Ni 2p, Co 2p and O 1s were detected for both spectra. Also, the XPS of x = 0.3 shows apparent peaks of Fe 2p, as shown in Fig. 5b. The peaks are relatively weak due to the comparatively small Fe content. However, the peaks are clearly separated and a distinct satellite (denoted as “Sat.”) peak of 2p3/2 is observed. Former studies have verified that such a distinct Sat. peak belongs to Fe 2p3/2 for Fe3+.49 This states that Fe in the NiCo1.7Fe0.3O4 is mostly in the form of Fe3+, indicating the successful substitution of Fe for Co. The spectra of Ni 2p and Co 2p for x = 0 and x = 0.3 were also plotted as shown in Fig. 5c–f. The binding energies of Ni 2p3/2 and Ni 2p1/2 are 855.0 eV and 872.7 eV for x = 0, and 856.9 eV and 874.4 eV for x = 0.3, respectively. Separations of Ni 2p3/2 and Ni 2p1/2 for both spectra of x = 0 and x = 0.3 are all close to 17.6 eV, which is thought to be the characteristic of Ni2+.24,27 Moreover, the very intense Sat. peaks of Ni 2p indicate the main form of Ni2+ for both x = 0 and x = 0.3. The spectra of Co 2p for x = 0 and 0.3 show larger difference in Fig. 5e and f. The Sat. peaks of Co 2p, which are the characteristic of Co2+,50 almost vanish with x increasing to 0.3. Based on the above discussions, fittings were done for these spectra. In conclusion, for NiCo2O4 (x = 0) in this study, nickel and cobalt mainly exist in the form of Ni2+ and Co3+, but there is a small amount of Ni3+ and Co2+. With Fe substitution (x reaching 0.3), Ni3+ and Co2+ would mainly convert to Ni2+ and Co3+, respectively.
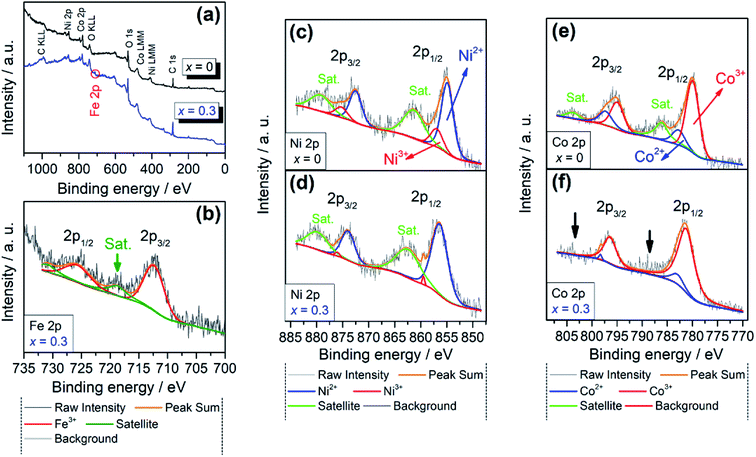 | ||
| Fig. 5 XPS spectra of NiCo2−xFexO4: (a) survey spectra of x = 0 and x = 0.3, (b) Fe 2p, x = 0.3, (c) Ni 2p, x = 0, (d) Ni 2p, x = 0.3, (e) Co 2p, x = 0, and (f) Co 2p, x = 0.3. | ||
3.2 Electrochemical measurements
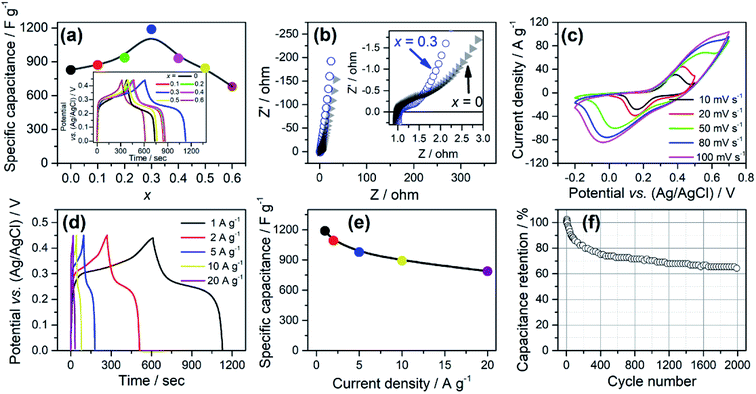
The energy storage properties of the as-prepared electrodes with varying x were evaluated in a three-electrode system using GCD tests at 1 A g−1, as shown in the inset of Fig. 6a. According to which, the specific capacitance was calculated (Fig. 6a).
  for simply NiCo2O4 (x = 0) is 826 F g−1 at 1 A g−1. Enhancement of
  could be seen along with the increase of Fe content, and the value is optimised to be 1188 F g−1 with x = 0.3. For better comparisons, the specific capacitance/capacities of NiCo2O4 from former studies and this work are listed in Table 1. A firm increase in
  can be seen when Fe was doped.
| Composite | Microstructure | Electrolyte | Specific capacitance/capacity | Ref. |
|---|---|---|---|---|
| NiCo2O4 | Flower-like | 6 M KOH | 122.5 C g−1@1 A g−1 | 34 |
| NiCo2O4 | Hollow-sphere | 3 M KOH | 183 C g−1@0.5 A g−1 | 13 |
| NiCo2O4 | Nanowires | 1 M KOH | 743 F g−1@1 A g−1 | 16 |
| NiCo2O4 | Nano-coral-like | 3 M KOH | 870.7 F g−1@1 A g−1 | 17 |
| NiCo2O4 | Urchin-like | 3 M KOH | 458 F g−1@1 A g−1 | 18 |
| NiCo2O4 | Nano-rod hollow sphere | 2 M KOH | 764 F g−1@2 A g−1 | 19 |
| NiCo2O4 | Urchin-like hollow microsphere | 2 M KOH | 942.2 F g−1@1 A g−1 | 20 |
| NiCo2O4 | Urchin-like | 2 M KOH | 826 F g−1 (359 C g−1)@1 A g−1 | This work |
| NiCo1.7Fe0.3O4 | Urchin-like | 2 M KOH | 1188 F g−1 (523 C g−1)@1 A g−1 |
Fig. 6b and S1† present the Nyquist plots of EIS in the frequency range from 0.01 Hz to 100 kHz with x = 0–0.6. All the plots give almost vertical curves in the low frequency range, indicating good capacitive behaviour.13,14 However, enlarged views of the high frequency range (inset of Fig. 6b) show obvious difference between x = 0 and 0.3. The plot of x = 0.3 shows a smaller depressed semicircle, indicating a smaller charge transfer resistance (Rct).21 For more specific data, we have fitted all the EIS curves using a Randle circuit (see in Fig. S1b†) and the fitted data are presented in Table S1.† Rct of x = 0 is 0.21 Ω, which is a very small value, indicating the favourable nature of NiCo2O4 for charge transfer. However, the Rct of x = 0.3 is only 0.09 Ω, less than half of that for x = 0, confirming that appropriate Fe substitutions can effectively improve its charge transfer properties. Fig. 6c shows CV curves for x = 0.3 at varying scan rates from 10 mV s−1 to 100 mV s−1. Apparent shifts of peaks could be seen as the scan rates increased. Meanwhile, current densities increase almost linearly along with the scan rates. Similar situations were found for all the compositions (x = 0–0.6, see in Fig. S2†). This is typical for energy storage based on a faradaic redox process and is commonly found in nickel cobalt oxides.11,13,14,20,21 Fig. 6d shows the GCD curves at varying current densities from 1 A g−1 to 20 A g−1. Based on which, the corresponding specific capacitance was calculated as shown in Fig. 6e. Retention of  for x = 0.3 is 788 F g−1 when increasing the current density to 20 A g−1, which is also the optimised value among all the composites (x = 0–0.6, see in Fig. S3†). The cycling life of NiCo1.7Fe0.3O4 electrodes were also tested under 2000 GCD curves at 5 A g−1, as shown in Fig. 6f. A slight increase in capacity is found in the initial several cycles, which can be a result of better contact between the electrode and electrolyte in the cycling process. About 65% of the capacity is retained after 2000 cycles, which is approximate to that of x = 0 (69%, see Fig. S4†), indicating that Fe substitution barely affects the cycling life.
The energy storage property improvements by Fe doping in this study can be ascribed to two possible reasons: (i) appropriate Fe substitutions can effectively decrease the size of the as-prepared nanowires (see Fig. 1e), and more mesopores are also provided (see Fig. 2), thus providing more effective contact sites between active materials and electrolyte. (ii) The electron environments are severely affected by Fe substitution as we can find from the XPS results (see Fig. 5), which may improve the conductivity. It was verified by EIS tests that with Fe content reaching an appropriate value, an obvious decrease in Rct could be seen (see Fig. 6b, S1 and Table S1†), indicating that better electron and ion transportation paths were provided.20 On the contrary, excess doping of Fe (x > 0.3 in this work) would cause the deterioration of energy storage properties, which is possibly due to Fe doping hindering the ordered sphere formations.
3.3 Asymmetric cells based on NiCo1.7Fe0.3O4
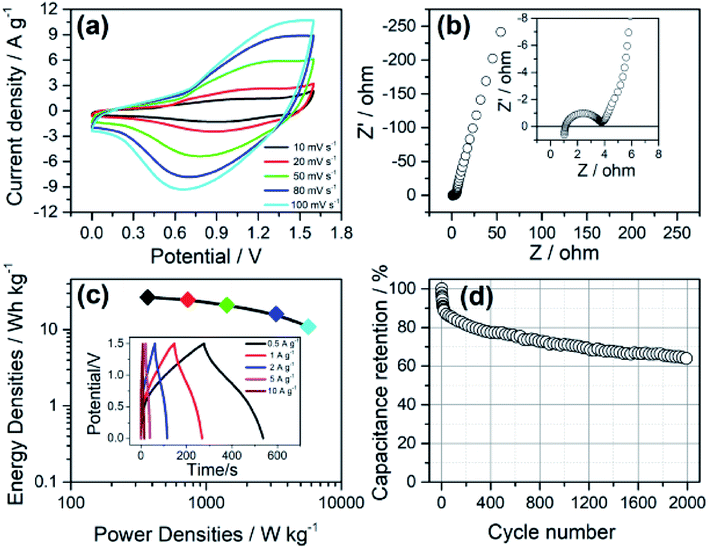
For practical applications, the optimised composite NiCo1.7Fe0.3O4 (x = 0.3) was used as a cathode to assemble asymmetric cells (abbreviated as ASC). Commercially activated carbon with a specific capacitance of ∼282 F g−1 in the potential range of −1 to 0 V (vs. Ag/AgCl, at GCD curves of 1 A g−1) was used as anodes (see Fig. S4†). Fig. 7 shows the electrochemical performance of one typical ASC. From Fig. 7a, showing the CV curves at scan rates from 10 to 100 mV s−1, it could be seen that the current densities increase along with an increase in the scan rates, indicating good rate capabilities for the cell. Fig. 7b shows the Nyquist plots of EIS. In the low frequency range, an almost vertical shape could be observed, indicating a still capacitive character for the device.13,14 The inset of Fig. 7b shows the enlarged view of the high frequency area. A semicircle could be obviously observed with a diameter of 2.6 Ω, which means the charge transfer resistance is small. Also, it could be seen that the Warburg portion, an area with a slope near 45°, is very short, indicating good ionic transport properties.44 For a more specific view of the ASC's energy storage properties, GCD tests with scan rates from 0.5 to 10 A g−1 were performed, as shown in the inset of Fig. 7c. Based on the discharge curves of which, the energy density and power density were calculated, and the ASC exhibited good properties of 26.6 W h kg−1 at 370 W kg−1 and 10.9 W h kg−1 at 5700 W kg−1. The ASC's stability in the GCD cycles was also tested at 2 A g−1. As shown in Fig. 7d, 64.6% of the initial capacitance was maintained after 2000 cycles. This resembles the cycling tests in the three-electrode configuration for NiCo1.7Fe0.3O4, indicating that the deterioration mainly originated from the cathode.4. Conclusion
In this study, through hydrothermal method and calcination, composites of NiCo2−xFexO4 were successfully synthesized. The successful Fe substitutions for Co were confirmed by XRD, EDS-mapping and XPS measurements. It was found that the microstructure was affected by Fe substitution in two ways: a variation from sphere “urchins” and a shrinkage of the nanowires' diameters. Also, the SSA and volume of mesopores can be effectively improved by increasing x from 0 to 0.3. Electrochemical measurements revealed that an optimized energy storage performance was obtained when x = 0.3, which is 523 C g−1 or 1188 F g−1 at 1 A g−1, a large improvement when compared with that of x = 0 (359 C g−1 or 826 F g−1). Thus, it has been proven that an effective way to improve the energy storage performance of NiCo2O4 is by Fe substitution in an appropriate content.Conflicts of interest
The authors declare no conflict of interest of any form.Acknowledgements
This work was supported by the National Natural Science Foundation of China (51472172). The authors acknowledge the help of Ms Hui Wang of the Analytical and Testing Center of Sichuan University for the SEM analysis.References
- J. R. Miller and P. Simon, Science, 2008, 321, 651–652 CrossRef CAS PubMed.
- J. Yan, Q. Wang, T. Wei and Z. Fan, Adv. Energy Mater., 2014, 4, 1300816 CrossRef.
- F. Wang, X. Wu, X. Yuan, Z. Liu, Y. Zhang, L. Fu, Y. Zhu, Q. Zhou, Y. Wu and W. Huang, Chem. Soc. Rev., 2017, 46, 6816–6854 RSC.
- L. Guan, L. Yu and G. Z. Chen, Electrochim. Acta, 2016, 206, 464–478 CrossRef CAS.
- W. Zuo, C. Xie, P. Xu, Y. Li and J. Liu, Adv. Mater., 2017, 29, 1703463 CrossRef PubMed.
- P. Yu, Z. Zhang, L. Zheng, F. Teng, L. Hu and X. Fang, Adv. Energy Mater., 2016, 6, 1601111 CrossRef.
- M. Yu, Y. Lu, H. Zheng and X. Lu, Chem.–Eur. J, 2018, 24, 3639–3649 CrossRef CAS PubMed.
- T. Brousse, D. Belanger and J. W. Long, J. Electrochem. Soc., 2015, 162, A5185–A5189 CrossRef CAS.
- C. Yuan, H. B. Wu, Y. Xie and X. W. Lou, Angew. Chem., Int. Ed., 2014, 53, 1488–1504 CrossRef CAS PubMed.
- T. Y. Wei, C. H. Chen, H. C. Chien, S. Y. Lu and C. C. Hu, Adv. Mater., 2010, 22, 347–351 CrossRef CAS PubMed.
- C. Yuan, J. Li, L. Hou, X. Zhang, L. Shen and X. W. D. Lou, Adv. Funct. Mater., 2012, 22, 4592–4597 CrossRef CAS.
- H. Wang, Q. Gao and L. Jiang, Small, 2011, 7, 2454–2459 CAS.
- A. Mondal, S. Maiti, S. Mahanty and A. Baran Panda, J. Mater. Chem. A, 2017, 5, 16854–16864 RSC.
- Y. Zhu, Z. Wu, M. Jing, X. Jia and X. Ji, Electrochim. Acta, 2015, 178, 153–162 CrossRef CAS.
- C. Yuan, J. Li, L. Hou, J. Lin, G. Pang, L. Zhang, L. Lian and X. Zhang, RSC Adv., 2013, 3, 18573 RSC.
- H. Jiang, J. Ma and C. Li, Chem. Commun., 2012, 48, 4465–4467 RSC.
- Y. Tao, L. Ruiyi, L. Zaijun and F. Yinjun, Electrochim. Acta, 2014, 134, 384–392 CrossRef CAS.
- Y. Zhang, Y. Zhang, D. Zhang and L. Sun, Dalton Trans., 2017, 46, 9457–9465 RSC.
- Y. Zhu, X. Ji, R. Yin, Z. Hu, X. Qiu, Z. Wu and Y. Liu, RSC Adv., 2017, 7, 11123–11128 RSC.
- C. Ji, F. Liu, L. Xu and S. Yang, J. Mater. Chem. A, 2017, 5, 5568–5576 RSC.
- Q. Wang, B. Liu, X. Wang, S. Ran, L. Wang, D. Chen and G. Shen, J. Mater. Chem., 2012, 22, 21647–21653 RSC.
- Z. Zeng, B. Xiao, X. Zhu, J. Zhu, D. Xiao and J. Zhu, Ceram. Int., 2017, 43, S633–S638 CrossRef CAS.
- H. Hu, B. Guan, B. Xia and X. W. Lou, J. Am. Chem. Soc., 2015, 137, 5590–5595 CrossRef CAS PubMed.
- D. Wang, W. Zhu, Y. Yuan, G. Du, J. Zhu, X. Zhu and G. Pezzotti, J. Alloys Compd., 2018, 735, 1505–1513 CrossRef CAS.
- H. Chen, J. Jiang, L. Zhang, H. Wan, T. Qi and D. Xia, Nanoscale, 2013, 5, 8879–8883 RSC.
- F. Zhao, W. Huang and D. Zhou, J. Alloys Compd., 2018, 755, 15–23 CrossRef CAS.
- T. Li, G. H. Li, L. H. Li, L. Liu, Y. Xu, H. Y. Ding and T. Zhang, ACS Appl. Mater. Interfaces, 2016, 8, 2562–2572 CrossRef CAS PubMed.
- H. Chen, L. Hu, M. Chen, Y. Yan and L. Wu, Adv. Funct. Mater., 2014, 24, 934–942 CrossRef CAS.
- H. Jin, D. Yuan, S. Zhu, X. Zhu and J. Zhu, Dalton Trans., 2018, 47, 8706–8715 RSC.
- L. Zhang, L. Dong, M. Li, P. Wang, J. Zhang and H. Lu, J. Mater. Chem. A, 2018, 6, 1412–1422 RSC.
- S. Chen, G. Yang, Y. Jia and H. Zheng, J. Mater. Chem. A, 2017, 5, 1028–1034 RSC.
- X. Liu, S. Shi, Q. Xiong, L. Li, Y. Zhang, H. Tang, C. Gu, X. Wang and J. Tu, ACS Appl. Mater. Interfaces, 2013, 5, 8790–8795 CrossRef CAS PubMed.
- L. Shen, L. Yu, X. Y. Yu, X. Zhang and X. W. Lou, Angew. Chem., Int. Ed., 2015, 54, 1868–1872 CrossRef CAS PubMed.
- W. Jiang, F. Hu, Q. Yan and X. Wu, Inorg. Chem. Front., 2017, 4, 1642–1648 RSC.
- M. Zhang, S. Guo, L. Zheng, G. Zhang, Z. Hao, L. Kang and Z.-H. Liu, Electrochim. Acta, 2013, 87, 546–553 CrossRef CAS.
- K. Qiu, Y. Lu, D. Zhang, J. Cheng, H. Yan, J. Xu, X. Liu, J.-K. Kim and Y. Luo, Nano Energy, 2015, 11, 687–696 CrossRef CAS.
- A. Pendashteh, S. E. Moosavifard, M. S. Rahmanifar, Y. Wang, M. F. El-Kady, R. B. Kaner and M. F. Mousavi, Chem. Mater., 2015, 27, 3919–3926 CrossRef CAS.
- S. G. Mohamed, C. J. Chen, C. K. Chen, S. F. Hu and R. S. Liu, ACS Appl. Mater. Interfaces, 2014, 6, 22701–22708 CrossRef CAS PubMed.
- L. Liu, H. Zhang, Y. Mu, J. Yang and Y. Wang, ACS Appl. Mater. Interfaces, 2016, 8, 1351–1359 CrossRef CAS PubMed.
- Z.-Y. Yu, L.-F. Chen and S.-H. Yu, J. Mater. Chem. A, 2014, 2, 10889 RSC.
- X. Zhang, Z. Zhang, S. Sun, Q. Sun and X. Liu, Dalton Trans., 2018, 47, 2266–2273 RSC.
- M. S. Javed, C. Zhang, L. Chen, Y. Xi and C. Hu, J. Mater. Chem. A, 2016, 4, 8851–8859 RSC.
- S. Zhang and N. Pan, Adv. Energy Mater., 2015, 5, 1401401 CrossRef.
- S. Sun, S. Wang, S. Li, Y. Li, Y. Zhang, J. Chen, Z. Zhang, S. Fang and P. Wang, J. Mater. Chem. A, 2016, 4, 18646–18653 RSC.
- C. An, Y. Wang, Y. Huang, Y. Xu, L. Jiao and H. Yuan, Nano Energy, 2014, 10, 125–134 CrossRef CAS.
- Y. Zhang, M. Ma, J. Yang, C. Sun, H. Su, W. Huang and X. Dong, Nanoscale, 2014, 6, 9824–9830 RSC.
- M. Thommes, K. Kaneko, A. V. Neimark, J. P. Olivier, F. Rodriguez-Reinoso, J. Rouquerol and K. S. W. Sing, Pure Appl. Chem., 2015, 87, 1051–1069 CAS.
- L. Shen, Q. Che, H. Li and X. Zhang, Adv. Funct. Mater., 2014, 24, 2630–2637 CrossRef CAS.
- T. Yamashita and P. Hayes, Appl. Surf. Sci., 2008, 254, 2441–2449 CrossRef CAS.
- J.-G. Kim, D. L. Pugmire, D. Battaglia and M. A. Langell, Appl. Surf. Sci., 2000, 165, 70–84 CrossRef CAS.
Footnote |
| † Electronic supplementary information (ESI) available. See DOI: 10.1039/c8ra10586c |
| This journal is © The Royal Society of Chemistry 2019 |

