DOI:
10.1039/C8RA10570G
(Paper)
RSC Adv., 2019,
9, 8290-8299
One-step hydrothermal synthesis and optical properties of self-quenching-resistant carbon dots towards fluorescent ink and as nanosensors for Fe3+ detection
Received
26th December 2018
, Accepted 25th February 2019
First published on 12th March 2019
Abstract
In our work, blue photoluminescent N-doped carbon dots (CDs) were developed via a green and simple hydrothermal method with citric acid and polyvinyl pyrrolidone (PVP K-30) as the carbon source and the nitrogen source, respectively. The as-prepared CDs have a high fluorescent quantum yield of 30.21% and considerable luminescence stability. The fluorescence intensity of the CDs was found to be effective quenched when adding Fe3+ ions to the CDs solution. The quenching phenomenon can be used to detect Fe3+ ions within a linear range of 0–300 μM with a detection limit of 45.5 nmol L−1, which suggested its potential application in the detection of Fe3+ ions. At the same time, we also noted the excellent self-quenching-resistant property of the as-prepared CDs in the solid state, and bright blue fluorescence was observed under UV excitation. What's more, the as-prepared CDs can also be used as fluorescent ink and were presented under UV excitation.
Introduction
In the past few years, as a new kind of carbon materials, carbon dots (CDs) have great prospects in the application of luminescence, biomedical and the ion detection filed. CDs usually refer to a new class of carbon nanomaterials with a size below 10 nm, which were firstly founded by Xu through the purification of single-walled carbon nanotubes in 2004.1 As the new member of the carbon nanomaterials family, CDs are comparable or even alternative materials to traditional semiconductor quantum dots (QDs), such as CdSe, PbS, and CdS, etc., which are widely used in bioimaging and biosensing,2–7 patterning,8,9 coding,10 and optoelectronics11–13 for their water solubility, good stability, low toxicity, superior resistance to photobleaching, and excellent biocompatibility.14,15 The wide application of CDs mainly comes from their luminescent properties. Although the PL mechanism of CDs is controversial, more and more evidence shows that the (photoluminescence) PL emission of CDs is due to the synergistic effect of the non-intrinsic PL of the CDs core and surface state. In addition, a large number of studies have shown that heteroatom doping can significantly tune their electronic properties, surface and local chemistry, as well as extend their applications. Currently, heteroatoms like nitrogen, phosphorus, sulphur, boron and fluorine have been confirmed to improve the PL quantum yield and PL intensity of the carbon dots. The doping of the heteroatom can introduce holes or electrons to the carbon dots, which distinctly improve the electronic structure and chemical activity, thus improving the optical and electrical properties for a more extensive application. Due to the N atom having a similar atomic radius to the C atom and the outer five valence electrons to bind carbon atoms, doping with nitrogen is widely used.16 For example, Wang et al. reported a kind of N-CDs synthesised by the hydrothermal method from streptomycin, which was used as fluorescent probes in cell imaging.17 Lu et al. used a mixture of oxalic acid and urea as a precursor to synthesize blue fluorescent N-doped carbon dots, which were used to detect Fe3+ and Ag+.18 Dong et al. used a mixture of citric and branched polyethyleneimines as a precursor for the one-step carbonization synthesis of carbon dots and used them for chemical sensing.19 However, the low-fluorescence quantum yield and self-quenching of solid-state CDs can be ascribed to excessive resonance energy transfer (RET) or the direct π–π interactions of organic molecules, which seriously limit the development of CDs.20
To our knowledge, there are few reports about the one-step preparation of CDs with solid-state luminescence.21,22 What's more, reports that mentioned the solid-state fluorescence (SSF) of CDs usually require the recombination of CDs and a solid matrix such as a polymer matrix to obtain the SSF. However, CDs as polymer materials generally have a fixed shape, which are inconvenient to apply in many fields compared with phosphors. Therefore, there is an urgent need to further research CDs-based phosphors with self-quenching-resistant property using environmentally friendly and widely available raw materials through a simple, low-cost, convenient method.
As we all know, Fe3+ ions, as one of the most essential metal ions in biological systems, plays a crucial role in the human body and the environment.23 However, excess amounts of Fe3+ ions in the human body and environment may cause some diseases and serious environmental pollution. In the past few years, many chemosensors based on organic dyes,24 semiconductor quantum dots,25 metal nanoparticles,26 and fluorescent meal organic frameworks27 have been widely used as a sensing probe of Fe3+. However, most chemosensors are poisonous, biologically incompatible and water-insoluble, which greatly limited their application in detection of Fe3+. So, the development of a new fluorescent Fe3+ sensing probe with photostability, high sensitivity and selectivity that permits naked-eye detection is truly meaningful. Carbon dots (CDs) have the advantages of water-solubility, low toxicity, good biocompatibility, and chemical stability.28,29 Additionally, Fe3+ could induce the photoluminescence quenching of carbon dots by the special coordinate interaction between Fe3+ and the surface groups of carbon dots. These phenomena enabled carbon dots to act as a nanosensor for Fe3+ detection.
In this paper, we prepared blue-emission N-CDs with a fluorescent quantum yield of 30.21% via a one-step hydrothermal method using citric acid and polyvinyl pyrrolidone (PVP K-30) as the carbon source and the nitrogen source. Citric acid and polyvinyl pyrrolidone (PVP K-30) are low-cost, widely available and environmentally friendly materials with excellent performance. Compared with previous reports,4,30 our method avoids using complicated raw materials and surface passivation, which is convenient for industrial production. During the experimental process, we found that the as-prepared CDs show great potential in the field of the detection of Fe3+ ions. There was a linear correlation between fluorescent intensity and the concentration of Fe3+ with a linear range from 0–300 μM and a detection limit of 45.5 nmol L−1, which indicates that the detection sensitivity in our work is higher than the limit of detection (LOD) data reported before.31,32 Furthermore, the as-prepared CDs demonstrate excellent blue fluorescence in the solid state after freeze-drying to a powder, which provides more possibilities for the application of CDs in ion detection and solid-state lighting devices. Additionally, the CDs can also be used as a fluorescent ink and are presented under UV excitation.
Experimental
Chemicals and materials
Citric acid (CA), polyvinyl pyrrolidone (PVP K-30), acetone, Cu(NO3)2, MnCl2·4H2O, CaCl2, ZnCl2, FeSO4·7H2O, Fe(NO3)3·9H2O, NaCl, MgCl2, Ni(NO3)2·6H2O, AgNO3, Pb(NO3)2, KNO3, Co(NO3)2·6H2O, Cd(NO3)2·4H2O, and Hg(NO3)2·H2O were all purchased from Sinopharm Chemical Reagent Co., Ltd. (Shanghai, China). Quinine sulfate was purchased from Aladdin Chemistry Co., Ltd. All the chemicals were of analytical grade and were used as received without any further purification. High-purity deionized water with a resistivity of greater than 18 MΩ cm−1 was obtained from the Millipore system and was used throughout the experiments.
Preparation of CDs
The CDs were prepared via a one-step hydrothermal method, 1.5 g of citric acid (CA) and 0.45 g of polyvinyl pyrrolidone (PVP K-30) were dissolved in 15 ml of deionized water to form a transparent viscous solution. Then, the mixture solution was transferred to a Teflon-lined autoclave (20 ml) and heated at 180 °C for 6 h. After cooling to room temperature gradually, the obtained reactor was precipitated with the addition of excess acetone. The suspension was then centrifuged twice at 8000 rpm for 20 min; a yellow solution was obtained after removing the insoluble substances. After being kept stationary for half a day to evaporate the acetone, the solution was put in a freezing chamber of the fridge and was then freeze-dried into a powder in the freeze drier. Finally, the as-prepared pale yellow CDs powder was obtained, and an aqueous solution of 3 mg ml−1 was also prepared for subsequent uses.
Measurements
The fluorescence spectra (PL) were obtained using an RF-5301PC fluorescence spectrophotometer (Shimadzu, Japan). Transmission electron microscopy (TEM) images were obtained on a Hitachi-7650 transmission electron microscope (Hitachi, Japan). X-ray photoelectron spectroscopic (XPS) analyses were performed on a Wscalab X-ray photoelectron spectrometer (ThermoFisher, UK). Fourier transform infrared spectra (FTIR) were recorded on a Nicolet iS10 FTIR spectrometer (Thermo Scientific, USA). Ultraviolet-visible (UV-vis) absorption spectra were performed on a UV-3600 UV-vis spectrophotometer (Shimadzu, Japan).
Fluorescent quantum yield (QY) measurement
The QY of the as-prepared CDs was measured by the slope method as done in previous research.33 A solution of quinine sulfate in 0.1 mol L−1 H2SO4 (QY of 54% at 360 nm, η = 1.33) was used as the standard. The value of the quantum yield was calculated according to the following equation:
| Qx = Qst(Kx/Kst)(ηx/ηst)2 |
where Q is QY, K is the slope, η is the refractive index with 1.33 as the default for both quinine sulfate and CDs. The subscript ‘st’ refers to the quinine sulfate, while the subscript ‘x’ refers to the samples.
Metal ion detection
The metal ion detection procedures were performed in an aqueous solution of the as-prepared CDs at RT. 50 ml of CDs solution was added to a colorimetric tube, a blank sample was set up, and the other samples were added into salt solutions (4 mM) separately containing different metal ions of Cu2+, Mn2+, Ca2+, Zn2+, Fe2+, Fe3+, Na+, Mg2+, Ni2+, Ag+, Pb2+, K+, Co2+, Cd2+, Hg2+ with full stirring. After stirring for 5 minutes, the fluorescence intensity was recorded at an excitation wavelength of 360 nm. The slit for the excitation was 1.5 nm, and the emission was 1.5 nm. All the experimental procedures were carried out under the same conditions. The detection of Fe3+ was examined using the same procedure by adding different concentrations of Fe3+ into aqueous solutions of CDs.
Fluorescent ink
A filter paper upon which the CDs adhered well (the paper showed no background under UV fluorescence) was chosen as the printing paper. Colorless CDs aqueous solutions were dipped with a brush pen to write different graphic patterns on the filter paper.
Results and discussion
Composition and structure of CDs
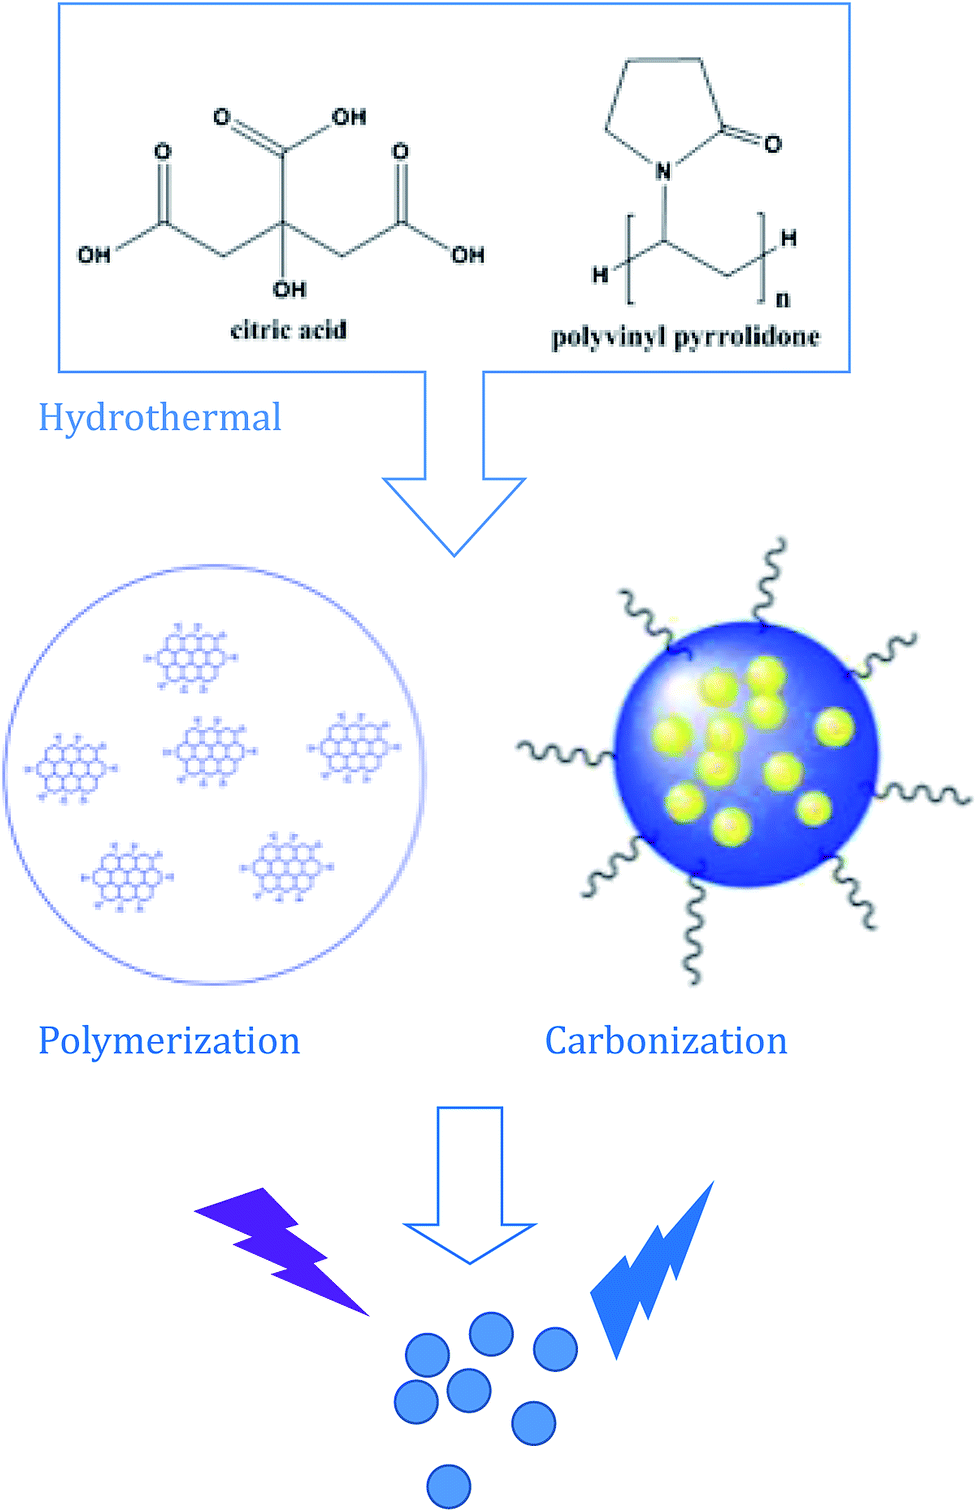
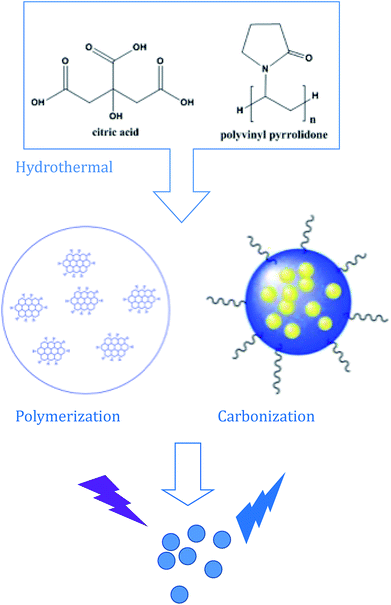
In this work, the CDs were synthesized by a hydrothermal reaction with the raw materials of citric and polyvinyl pyrrolidone at 180 °C for 6 hours. Under the hydrothermal environment of high temperature and high pressure, the water evaporation spurs the intermolecular dehydration of citric acid and polyvinyl pyrrolidone molecules to form “polymer-like” intermediates.34 The intermediates were further carbonized and capped by polyvinyl pyrrolidone molecules simultaneously to form the scattered carbon dots.
The morphology and microstructure of the as-prepared CDs were identified by TEM. As shown in Fig. 1a and b, the obtained CDs are spherical in structure, with a uniform dispersion without apparent aggregation. In the high-resolution TEM spectrum (Fig. 1c), no obvious lattice fringes were observed, indicating that the carbon quantum dots have poor crystallinity. Fig. 1d shows the size distribution histograms of the CDs, the distribution of the diameter size of the CDs within the range of 3.1–3.9 nm, and the average particle diameter size is 3.4 nm.
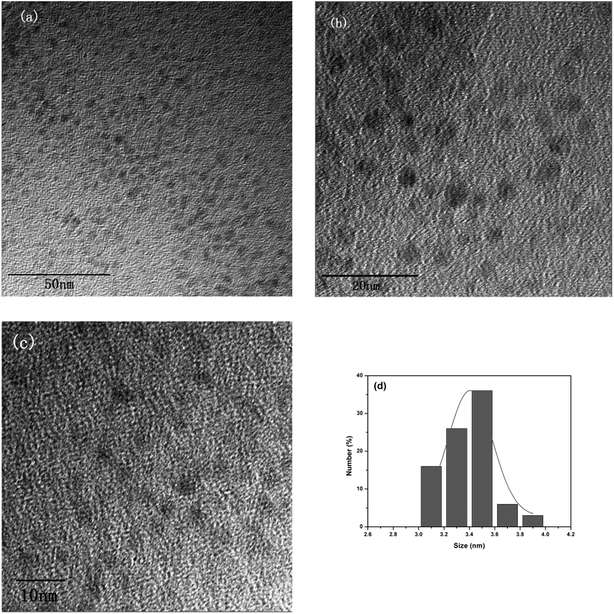 |
| | Fig. 1 (a) and (b) TEM images of the CDs; (c) high-resolution TEM images of the CDs; (d) and size distribution histograms of the CDs. | |
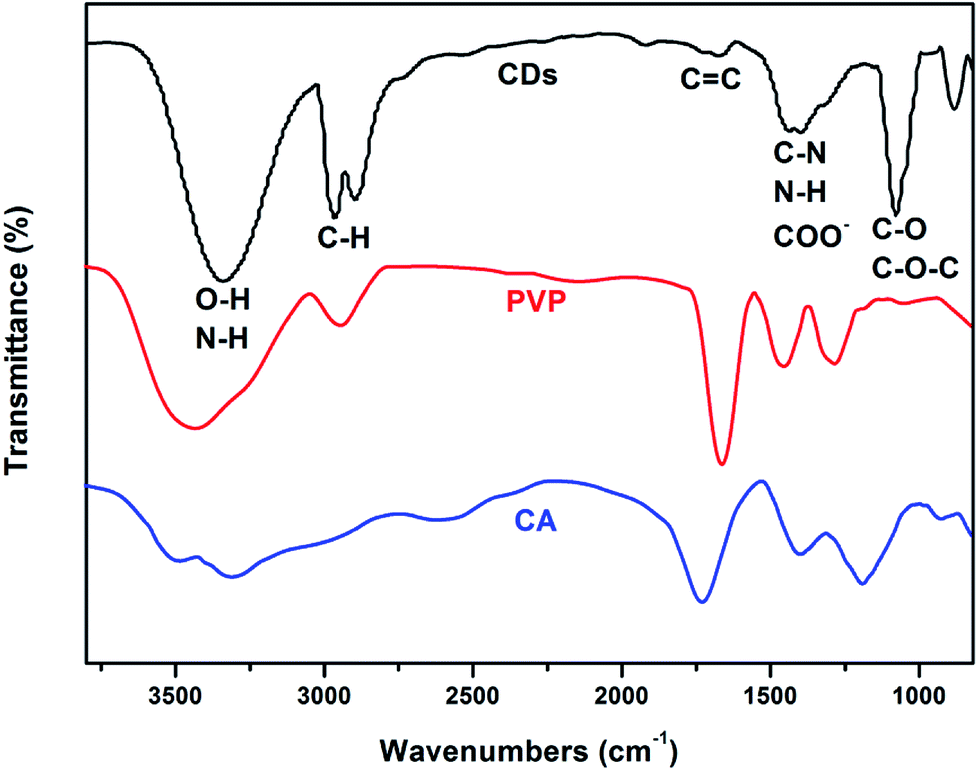
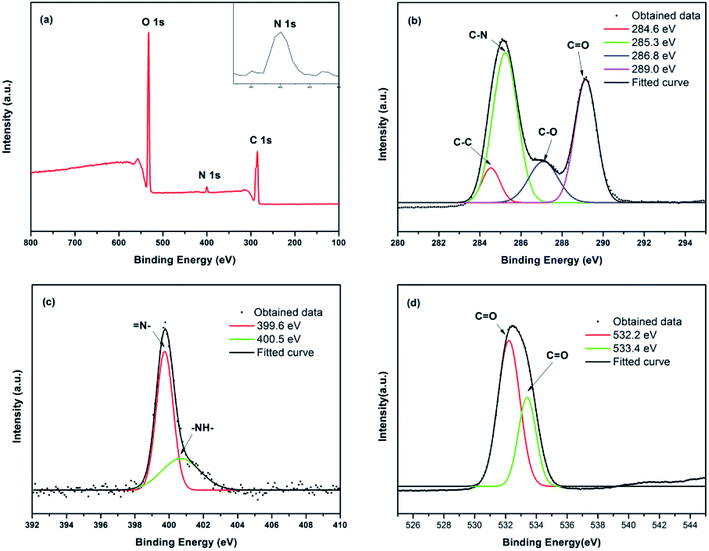
The surface functional groups and chemical composition of the CDs were identified by FTIR spectra and X-ray photoelectron spectroscopy (XPS). The FTIR spectra of the as-prepared CDs and its precursors are shown in Fig. 2, the wide band within the range of 3300 cm−1 to 3380 cm−1 can be attributed to O–H and N–H stretching vibrations.35 The characteristic peaks at 2970–2890 cm−1 and 1725–1680 cm−1 are the stretching vibrations of C–H and C![[double bond, length as m-dash]](https://www.rsc.org/images/entities/char_e001.gif) C, respectively. The characteristic peaks at 1450–1380 cm−1 and 1070 cm−1 were assigned to the bending vibrations of C–N, N–H, COO and the C–O, C–O–C groups, respectively. What's more, compared with the FTIR spectra of the as-prepared CDs and the raw materials of PVP and citric acid (Fig. 4), we can find that the FTIR spectrum of the as-prepared CDs is almost the same as that of PVP, which can be ascribed to how the surface of CDs may be wrapped with abundant PVP long chains. However, the characteristic absorption band at 1639 and 1274 cm−1 corresponding to the acid amides and the CH2 stretching vibration of PVP are absent in the FTIR spectrum of CDs, which suggests that the PVP units in CDs were changed. Similarly, the characteristic absorption peaks of citric acid also changed in the CDs, which further confirmed that a chemical reaction took place between the reactants, not just a simple physical interaction. The synthesis process of the CDs is schematically illustrated in Scheme 1. There are abundant active groups like carboxyl and hydroxyl on the surface of the citric acid, which are beneficial for improved water-solubility and also provide more reactivity sites. The polyvinyl pyrrolidone introduces different surface functional groups that would create new surface electronic energy levels and various characteristics. Meanwhile, the polyvinyl pyrrolidone provides abundant nitrogen-containing functional groups, which increases the fluorescence quantum yield (QY) and modifies the photoelectric properties.36
C, respectively. The characteristic peaks at 1450–1380 cm−1 and 1070 cm−1 were assigned to the bending vibrations of C–N, N–H, COO and the C–O, C–O–C groups, respectively. What's more, compared with the FTIR spectra of the as-prepared CDs and the raw materials of PVP and citric acid (Fig. 4), we can find that the FTIR spectrum of the as-prepared CDs is almost the same as that of PVP, which can be ascribed to how the surface of CDs may be wrapped with abundant PVP long chains. However, the characteristic absorption band at 1639 and 1274 cm−1 corresponding to the acid amides and the CH2 stretching vibration of PVP are absent in the FTIR spectrum of CDs, which suggests that the PVP units in CDs were changed. Similarly, the characteristic absorption peaks of citric acid also changed in the CDs, which further confirmed that a chemical reaction took place between the reactants, not just a simple physical interaction. The synthesis process of the CDs is schematically illustrated in Scheme 1. There are abundant active groups like carboxyl and hydroxyl on the surface of the citric acid, which are beneficial for improved water-solubility and also provide more reactivity sites. The polyvinyl pyrrolidone introduces different surface functional groups that would create new surface electronic energy levels and various characteristics. Meanwhile, the polyvinyl pyrrolidone provides abundant nitrogen-containing functional groups, which increases the fluorescence quantum yield (QY) and modifies the photoelectric properties.36
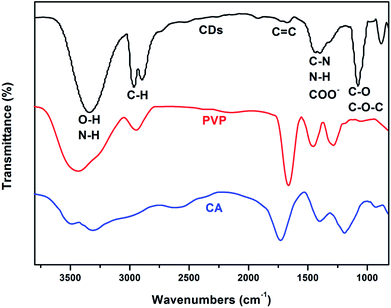 |
| | Fig. 2 FTIR spectra of the as-prepared CDs, PVP and citric acid, respectively. | |
 |
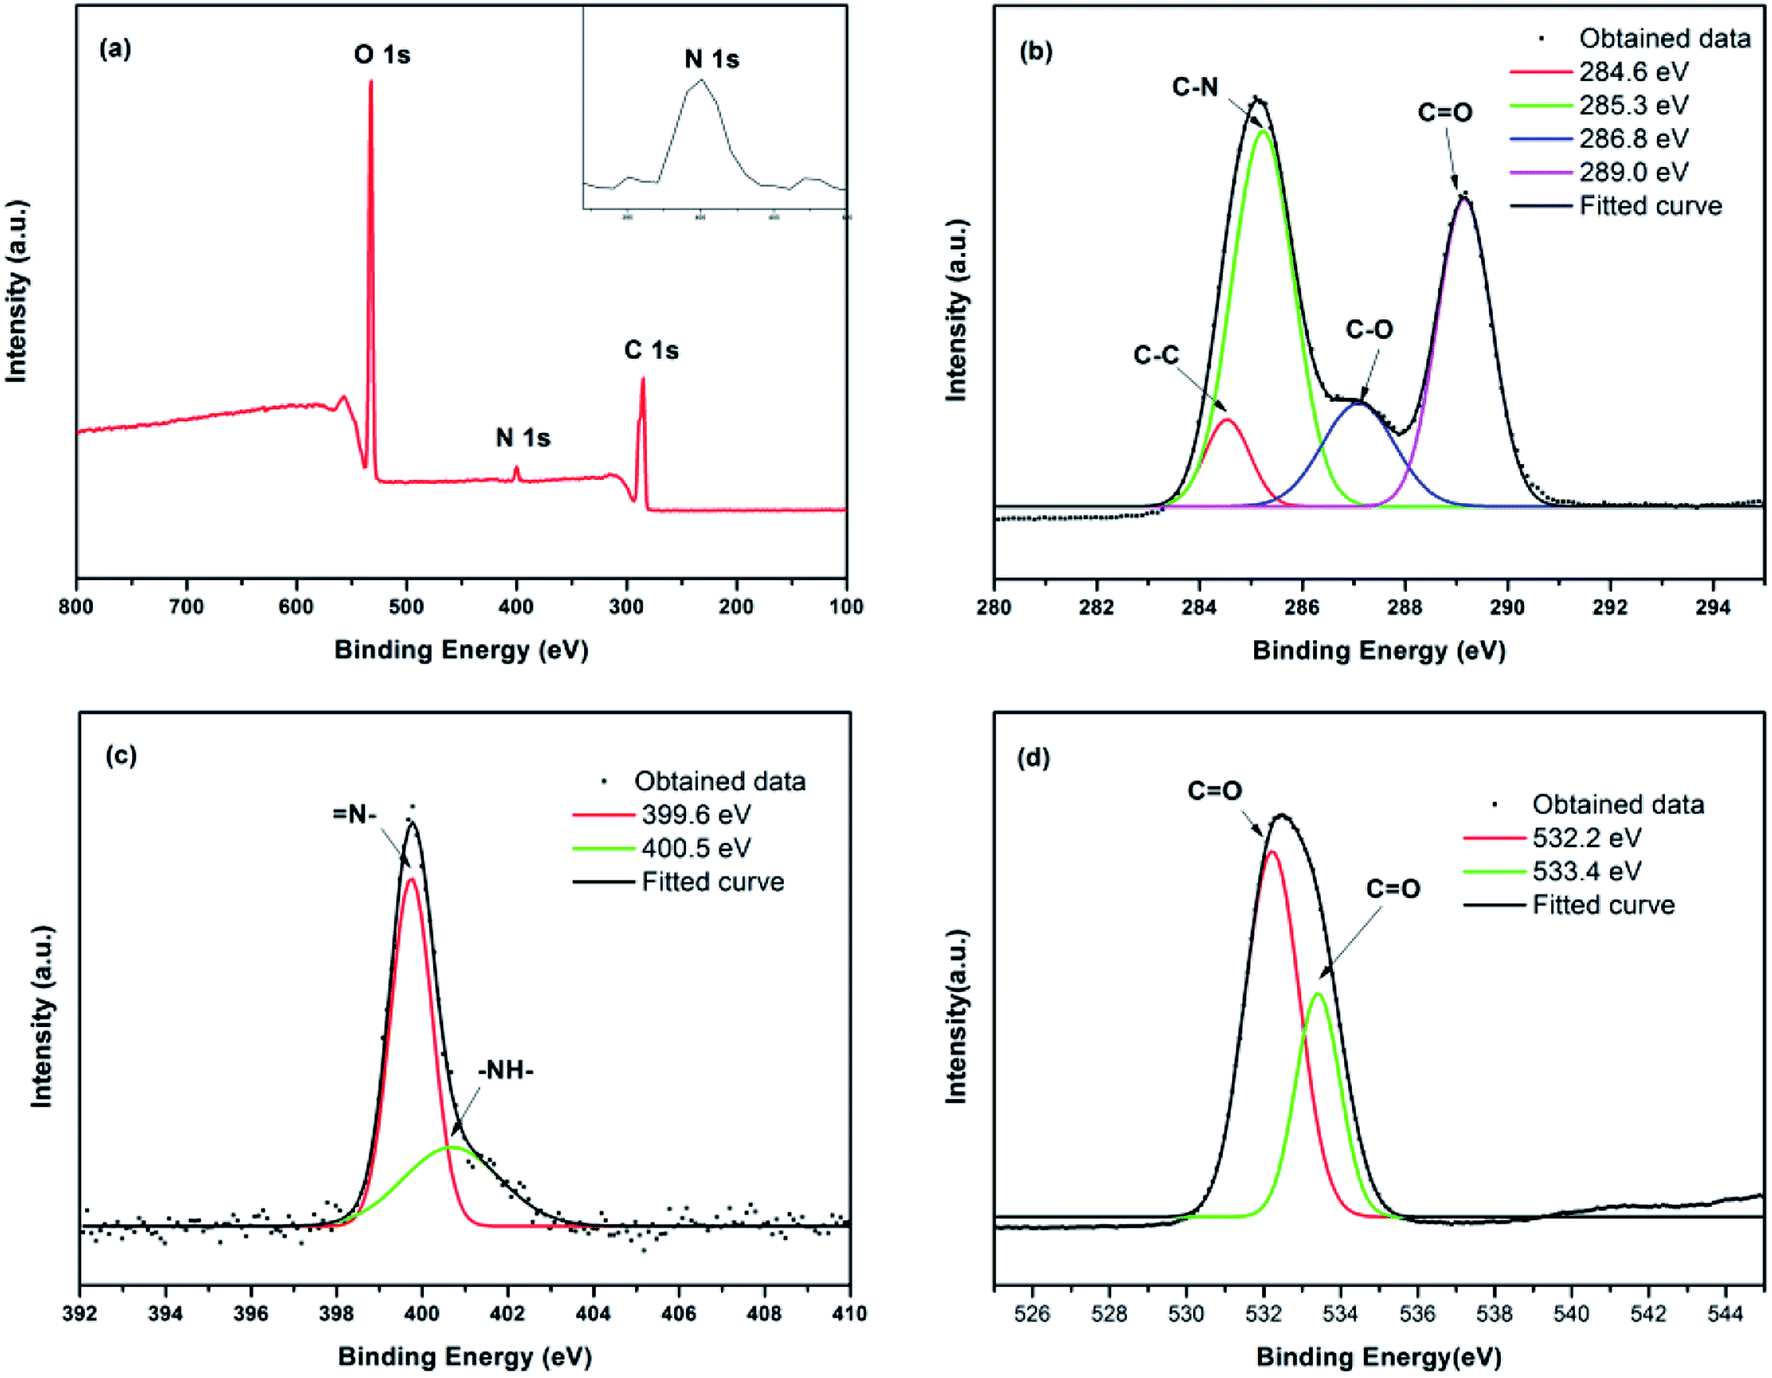
| | Fig. 3 (a) XPS survey spectrum, magnification and fitting curves of (b) the C1s peak, (c) the N1s peak, and (d) the O1s peak for the prepared CDs. | |
 |
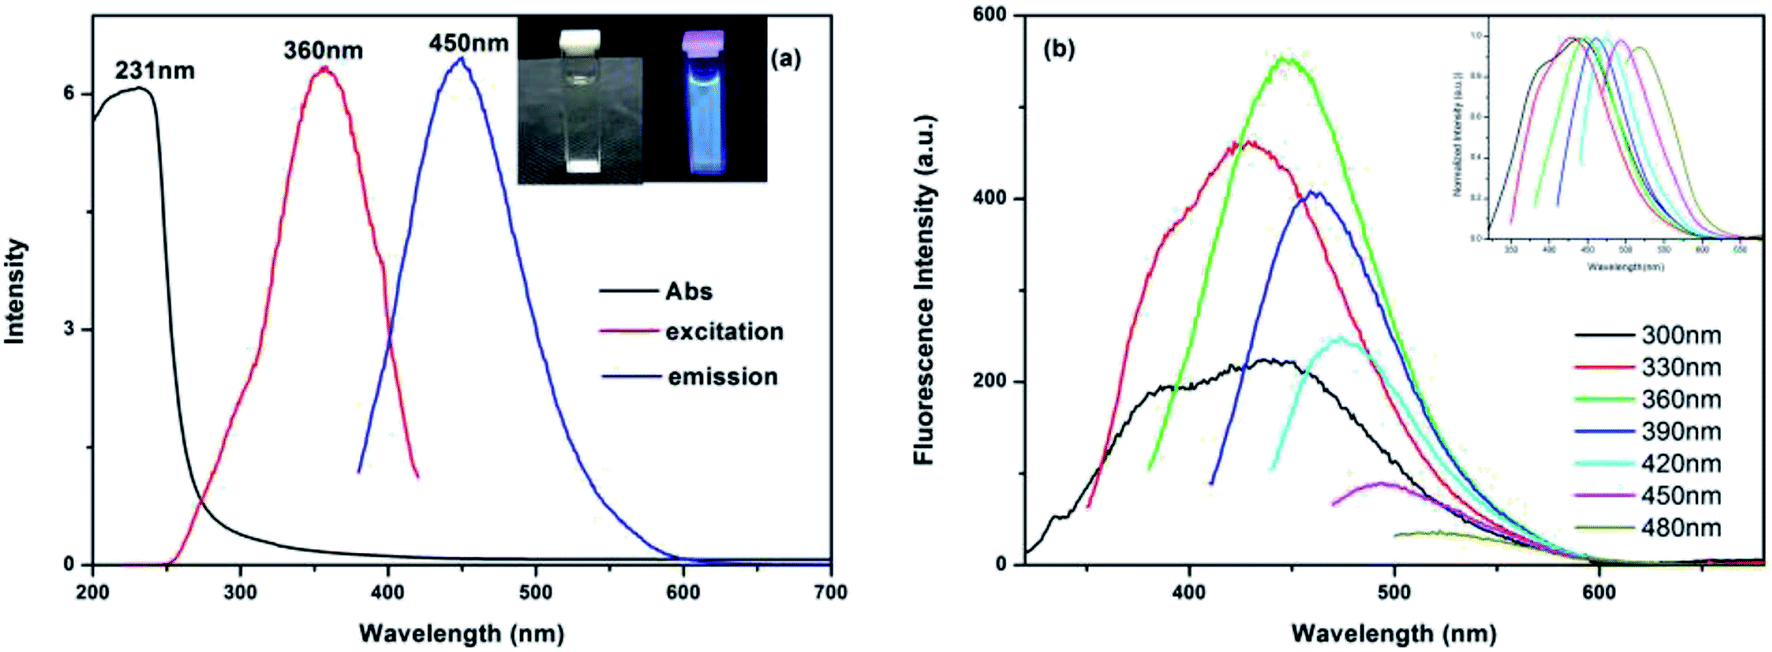
| | Fig. 4 (a) Absorbance, excitation and emission spectra of the CDs aqueous solution (the inset displays the fluorescent photo under a 365 nm UV lamp); (b) emission spectra of the CDs aqueous solution at different excitation wavelengths from 200 to 480 nm (the inset displays the corresponding normalized spectra). | |
 |
| | Scheme 1 A synthetic route using citric acid and polyvinyl pyrrolidone (PVP K-30): from ionization to condensation, polymerization, and carbonization. | |
The surface composition of the synthesized CDs was examined with X-ray photoelectron spectroscopy (XPS) spectra, which are shown in Fig. 3. The XPS spectrum includes three peaks at 533.1, 400.1 and 285.1 eV,37,38 which correspond to C1s, N1s and O1s, respectively (Fig. 3a). The sample contains 69.88 at% of carbon, 7.80 at% of nitrogen and 22.32 at% of oxygen. The corresponding binding energies were given in Fig. 3a, which indicated the existence of large amounts of carbon and oxygen elements and small amounts of nitrogen elements on the surface of the CDs. The appearance of the N1s peak indicates that the N elements had successfully entered the carbon skeleton. Fig. 3b shows the C1s spectrum of CDs; the four peaks at 284.6 eV, 285.3 eV, 286.8 eV and 289.0 eV should be attributed to C–C, C–N, C–O and CO.39 The high-resolution N1s spectra (Fig. 3c) of the obtained CDs present two kinds of main peaks associated with nitrogen atoms located at 399.6 eV and 400.5 eV, which correspond to the pyridinic N of N– and the pyrrolic N of –NH–, respectively. As previously reported, the pyrrolic N exposes the edge of the plane and the defect position, and the pyridinic N replace C atoms at the edge or plane of the defective parts.40,41 The defects and planes caused by N doping can significantly improve the surface chemical activity and electrical properties of CDs and then improve the QY of the CDs. The O1s spectrum of the CDs is shown in Fig. 3d. The two main peaks at 532.2 eV and 533.4 eV could be assigned to C–O and CO. The XPS results agreed with FTIR analysis. In other words, there may be hydrophilic groups such as –OH, –NH2 and –COOH on the surface of the obtained CDs.
Optical properties of CDs
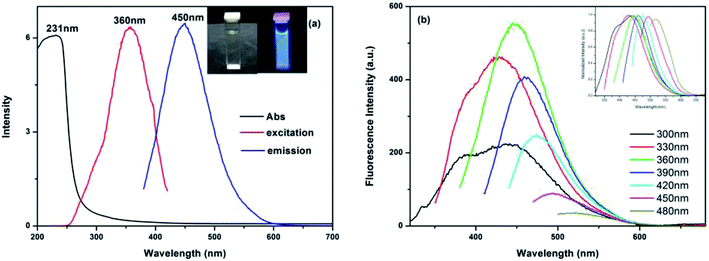
We used the slope method to measure the QY of the as-prepared CDs. The relative fluorescence QY of the CDs was calculated to be 30.21% using quinine sulfate in 0.1 mol L−1 H2SO4 (QY of 54% at 360 nm, η = 1.33) as the reference. The UV-vis absorption spectrum is shown in Fig. 4a. The absorption band ranged from 200 to 280 nm with a peak at 231 nm, which can be assigned to the π–π* transition of CC sp2. The obtained CDs have the strongest blue emission band at 450 nm with an excitation at 360 nm (the inset picture of Fig. 4a). The PL emission wavelength of the CDs aqueous solution has a typical excitation-dependent property upon changing the excited wavelength as shown in Fig. 4b, which is common in fluorescent carbon materials.42 As the excitation wavelength increases from 300 to 480 nm, the position of the emission peak shifts to long wavelengths from 425 to 520 nm. Meanwhile, the PL intensity of the CDs reaches a maximum at 450 nm when excited at 360 nm. The red shift of the emission band may be attributed to the surface state of the CDs that affect the band gap43 or the effects of different emissive sites on the different sized nanoparticles within the sample.44 Nevertheless, the PL intensity reduces as the half-peak width increases, which may be associated with the quantum effect and surface energy trap.45 Furthermore, the quantum yield of the obtained CDs is as high as 32.1% (excited at 360 nm and using quinine sulfate as a reference), which is higher than in many previous reports.46,47
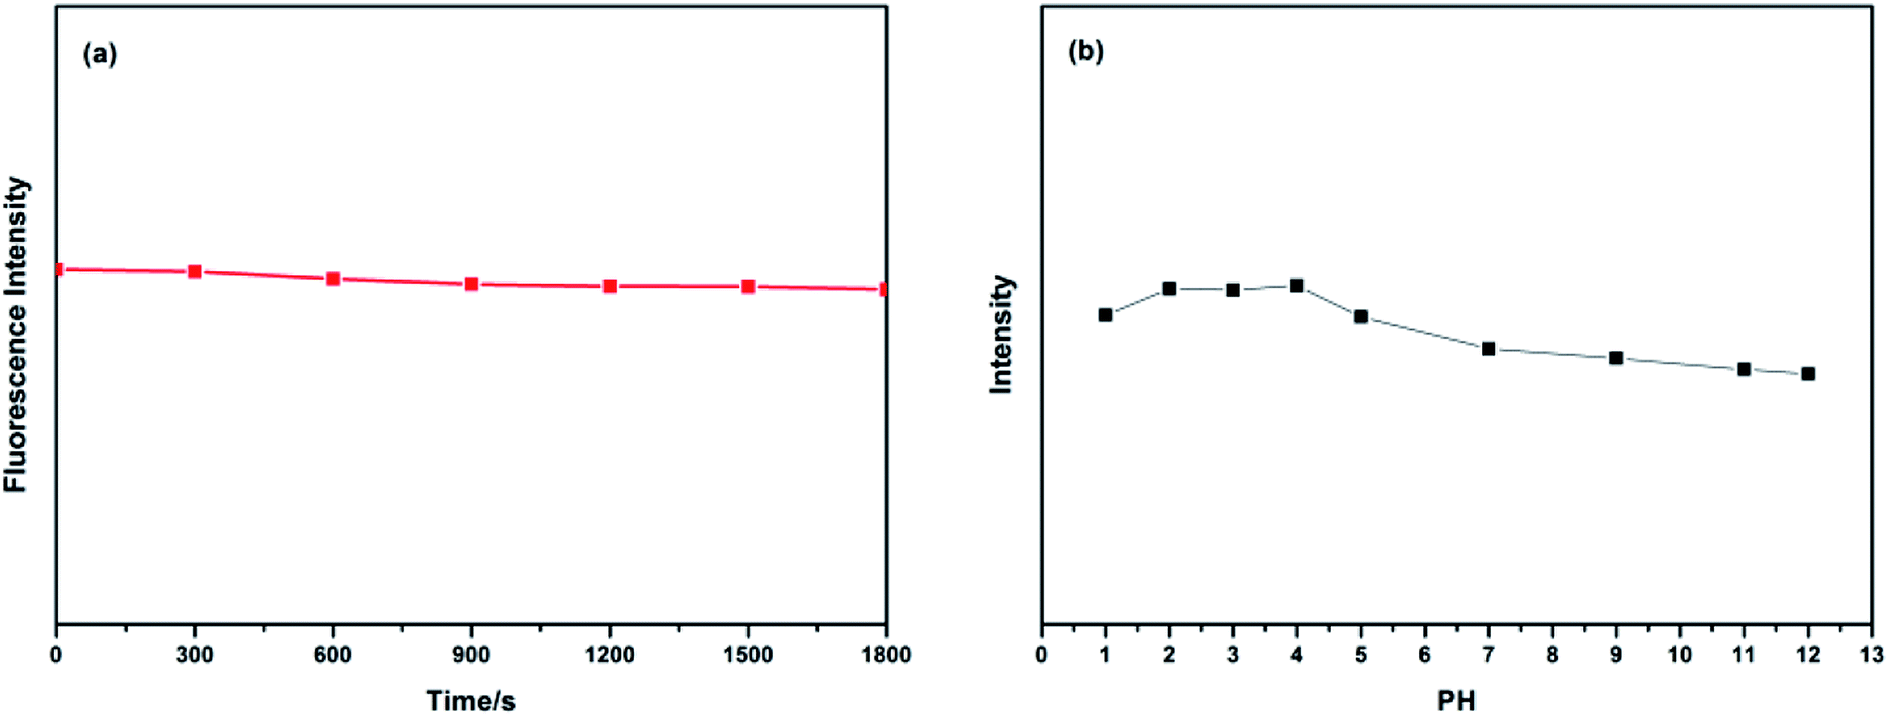
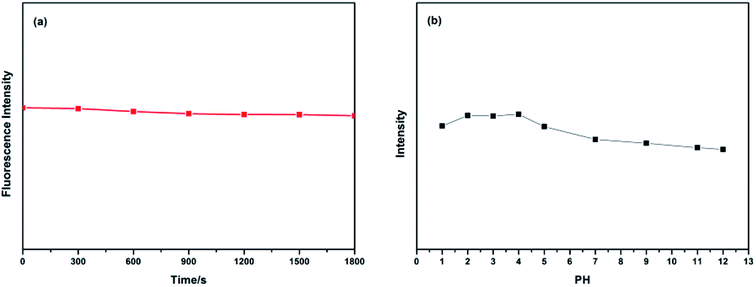
As we all know, the fluorescence stability of CDs is a key factor in its application in various fields. Therefore, the PL stability of the CDs was also studied (Fig. 5). As shown in Fig. 5a, after irradiation under a UV lamp (365 nm) for 1800 s, the PL intensity of the CDs aqueous solution did not obviously change, which indicates that the CDs has good PL stability and have a potential application in biological detection, which may be needed for long-term radiation. What's more, in order to investigate the effect of pH on the PL intensity of CDs, we characterized the PL intensity of CDs aqueous solution with a pH value of 1, 2, 3, 4, 5, 7, 9, 11 and 12, respectively. As shown in Fig. 5b, with the increase of pH value, the PL intensity first increases and then decreases. That is, the PL intensity of the CDs dispersing in the acid medium is stronger than that in the alkaline medium, and the PL intensity reaches a maximum near the pH value of 4. By adjusting the pH value of the CDs solution, we found that the PL intensity changes with the pH value, which demonstrates that the as-prepared CDs has pH-dependence. The result is common in the previous reports, which is relevant to the protonation/non-protonation of the surface groups (–NH2, –COOH, –CO–).48
 |
| | Fig. 5 (a) Irradiation time on the PL intensity of CDs and (b) the value on the PL intensity of CDs (λex = 360 nm). | |
Applications of CDs in ions detection
The influence of the quenching of different ions on the fluorescence of CDs indicates the as-prepared CDs as a promising fluorescent probe for metal ion detection. The emission spectra of the CDs under 360 nm excitation with different metal ions were recorded after incubation for 10 min, as shown in Fig. 6a. The detection solution included Cu2+, Mn2+, Ca2+, Zn2+, Fe2+, Fe3+, Na+, Mg2+, Ni2+, Ag+, Pb2+, K+, Co2+, Cd2+, and Hg2+ ions; the emission spectra of all the metal ions did not significant changed except for the Fe3+ ions. Fig. 6b shows the different PL intensity ratios (F/F0) of the CDs solutions in the presence and absence of various metal ions. From this figure, we can observe that the PL intensity ratio (F/F0) of Fe3+ ions is the lowest and that other metal ions show slight changes of PL intensity, which indicated that Fe3+ has the largest quenching effect on the fluorescence of CDs and that the quenching effect is may be due to the strong affinity of Fe3+ ions to CDs. The results of FTIR and XPS confirmed that part of the –COOH, –OH and –NH2 groups exists on the surface of the as-prepared CDs, which can react with Fe3+ ions to form a complex and effectively prevents the hydrolyzing of Fe3+ in solution, finally leading to the fluorescence quenching of CDs. Moreover, variations on the surface of CDs may cause the aggregation of CDs, leading to fluorescence quenching. This phenomenon is agreed with the reported work, which had revealed that after the addition of Fe3+ to the CDs solution, the surface of CDs might be changed, which would result in poor luminescence efficiency.49,50
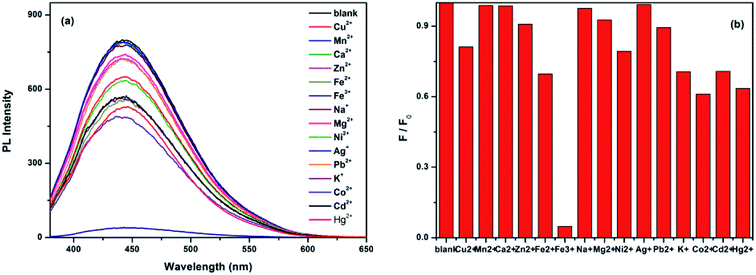 |
| | Fig. 6 (a) Emissions spectra of CDs with different ions; (b) the different PL intensity ratios (F/F0) of the CDs solutions in the presence and absence of various metal ions (F0 is the blank value, F is the fluorescence intensity of CDs with different ion, excitation = 360 nm, emission = 450 nm, [Mn+] = 4 mmol L−1). | |
At room temperature, the emission spectra of the CDs in the presence of different concentrations of Fe3+ ions were recorded after incubation for 10 min. As shown in Fig. 7a, after excitation at 360 nm, CDs solutions with different concentrations of Fe3+ ions show a broad band with a peak at 450 nm, ranging from 380 to 600 nm with an increasing concentration of Fe3+ ions. The fluorescence intensity at 450 nm decreases gradually without any red or blue shift in position, which indicates that the quenching effect is related to the concentration of Fe3+; CDs, therefore, can be used as the probe of Fe3+ ions. The Fe3+ quenching effect can be described with the Stern–Volmer equation:
where
Ksv is the Stern–Volmer quenching constant and the bimolecular quenching constant,
C is the concentration of Fe
3+, and
F0 and
F are the fluorescence intensity of CDs without Fe
3+ and with different concentration of Fe
3+, respectively.
Fig. 7b shows the standard curve of
F0/
F to the concentration of Fe
3+; the range of linearity is 0–300 μmol, the corresponding regression coefficient
R2 = 0.991, and the detection limit (LOD) for Fe
3+ is 45.5 nmol L
−1 based on 3
σ/
k (
σ represents the standard deviation for the corrected blank signals with 10 parallel measurements, and
k is the slope of the calibration curve). Moreover, on/off fluorescence was achieved by oxidizing Fe
2+ to Fe
3+ in such an imaging system (
Fig. 7c and d).
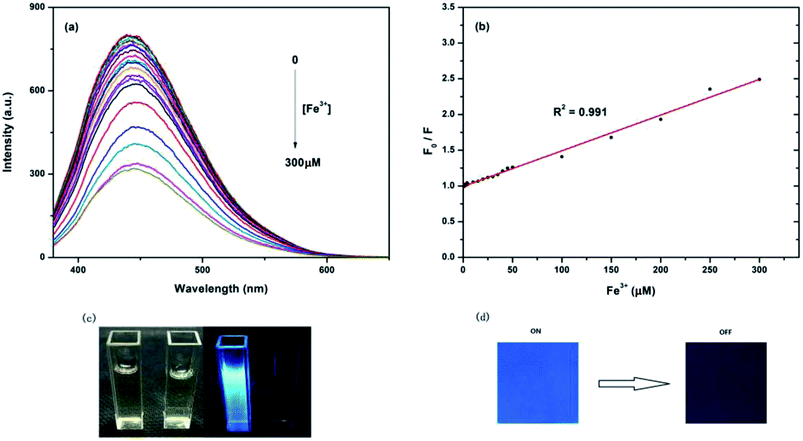 |
| | Fig. 7 (a) Quenching curves of CDs upon exposure to different concentration of Fe3+; (b) the linear region of the CDs-Fe3+ sensing response ([Fe3+]: 0.0, 1.0, 2.0, 3.0, 4.0, 5.0, 10, 15, 20, 25, 30, 35, 40, 45, 50, 100, 150, 200, 250 and 300 μmol L−1, respectively); (c) images of the CDs before (left) and after (right) treatment with Fe3+ under sunlight and UV light, respectively; (d) fluorescence images of aqueous CDs after adding Fe2+ and Fe3+ ions; the on/off fluorescence was achieved by oxidation. | |
Solid-state fluorescence of CDs
Furthermore, the self-quenching-resistant property of the as-prepared CDs was founded after the freeze-drying process. Excited by UV light (365 nm), the CDs powder exhibits strong blue solid-state fluorescence (SSF), as shown in Fig. 8. The SSF is attributed to the space steric hindrance caused by the PVP chains on the surface of the CDs particles, which was confirmed by FTIR spectroscopy. The long chains prevent the graphitized carbon cores from directly contacting each other, such that keeping a certain distance among the CDs particles allows for the avoidance of the self-quenching effect generated by π–π stacking (one kind of efficient energy transfer mode), which shows as the solid-state fluorescence.21
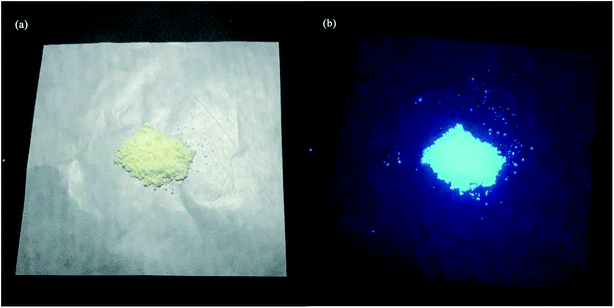 |
| | Fig. 8 Photographs of CDs were taken under (a) daylight and (b) 365 nm UV light. | |
Furthermore, the emission spectra of the CDs powder are shown in Fig. 9. The PL emission wavelength of the CDs powder has an excitation-dependent property when changing the excitation wavelength from 330 to 600 nm, similar to the CDs aqueous solution. As the excitation wavelength increases, the position of the emission peak of the CDs powder shifts to longer wavelengths from 451 to 600 nm, while the PL intensity of the CDs reaches the maximum at 482 nm when excited at 420 nm. The self-quenching-resistance property of the CDs powder may provide an opportunity for the achievement of efficient SSF nanomaterials without being supported by solid matrices.
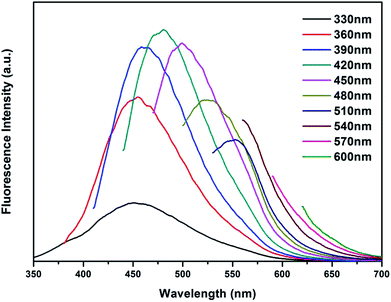 |
| | Fig. 9 SSF spectra of CDs powder at different excitation wavelengths from 330 to 600 nm. | |
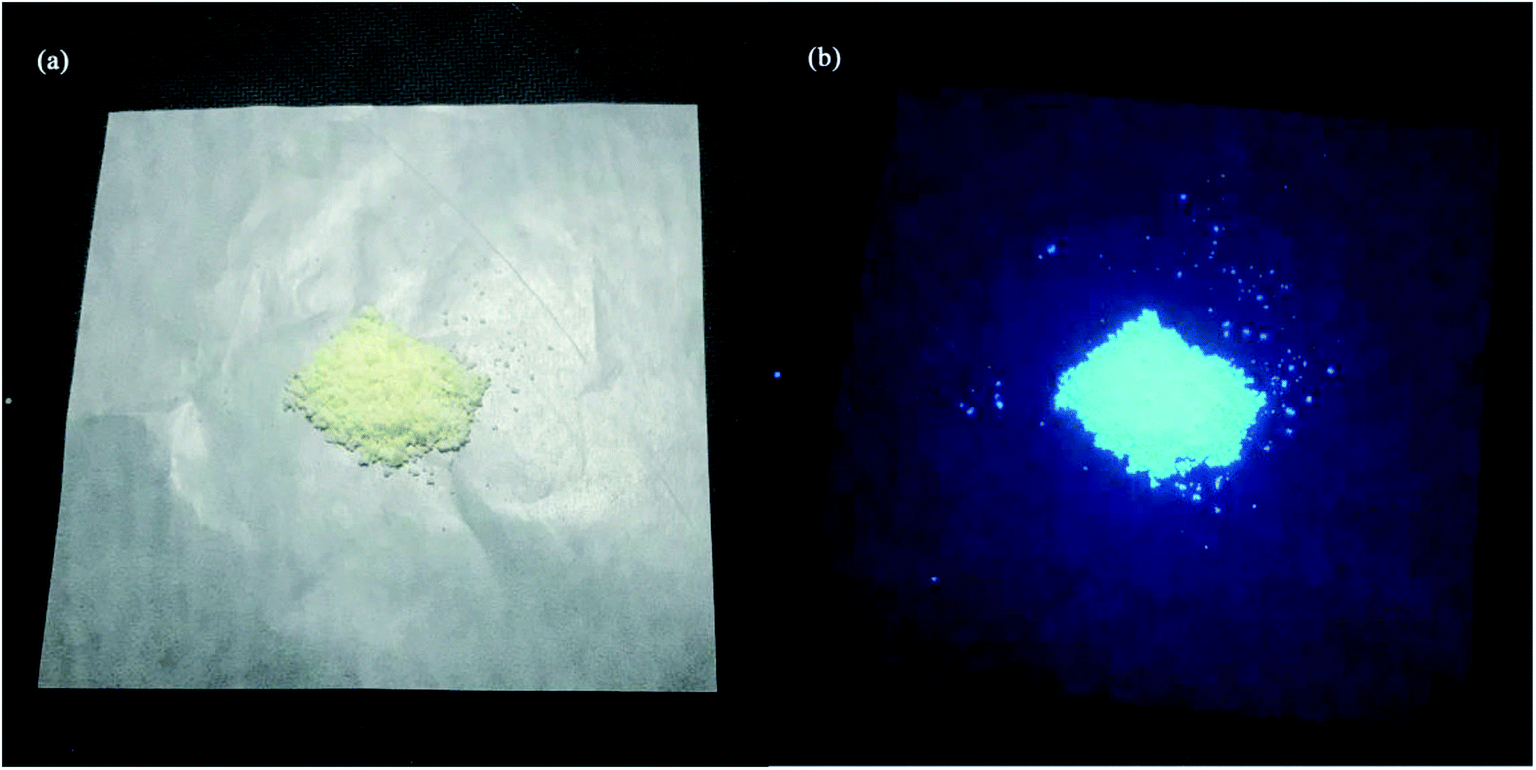
Application of CDs in fluorescent ink
For its excellent fluorescence, photobleaching resistance, good PL stability and good dispersibility, aqueous CDs can be used as fluorescent ink. The fluorescent characters written on paper by using CDs ink are not visible, except when excited under a UV lamp. As shown in Fig. 10a, “Shanghai University” CDs blue fluorescent characters can be observed under a UV light. A month later, the characters still emit a clear and intense blue light under 365 nm UV excitation. When the concentration of the CDs in aqueous solution changed, the CDs ink showed different shades of blue under the UV lamp (Fig. 10b). High-quality fluorescent graphics and text characters can be obtained by using CDs fluorescent ink, which can replace traditional ink for anti-counterfeiting, information encryption, information storage and so on. In the near future, the CDs fluorescent ink may have great application in flexible displays.
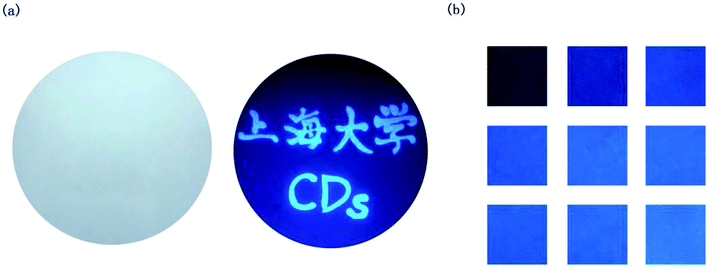 |
| | Fig. 10 (a) Different graphic patterns on paper (illuminated by the 365 nm UV lamp) and (b) ink in multiple colors, tuned by the CDs concentration in aqueous solution (illuminated by the 365 nm UV lamp). | |
Conclusion
In summary, the blue CDs were successfully synthesized by a simple one-pot hydrothermal treatment by using citric acid (carbon source) and polyvinyl pyrrolidone (PVP K-30) (nitrogen source) as the raw materials. The QY of the as-prepared CDs is 30.21%, and it has remarkable water-dispensability and excellent fluorescence stability. The obtained CDs have the strongest blue emission band at 450 nm with an excitation at 360 nm. The emission spectra of the obtained CDs exhibited an excitation-dependent fluorescence behavior with a center of broad range shifts from 425 to 520 nm. The CDs could be used to detect the Fe3+ ions within a linear range of 0–300 μM, with a detection limit of 45.5 nmol L−1, which suggested that the new CDs has great potential toward the detection of Fe3+ ions. What's more, the excellent self-quenching-resistant property of the as-prepared CDs was showed in the solid state, with bright blue fluorescence being observed under a 365 nm UV lamp, providing more possibilities for the solid application of CDs. Besides, the CDs could be applied as a fluorescent ink that could potentially be a substitute for commercial dyes. All of the results suggest the as-prepared CDs as a new class of luminescent carbon nanomaterials with great potential in environmental and commercial applications in the near future.
Conflicts of interest
There are no conflicts to declare.
Acknowledgements
The author is grateful to the National Natural Science Foundation (Grant 21301115), and the project is supported by the Key Laboratory for Advanced Displays and System Application, Ministry of Education, Shanghai University (Grant P201602).
References
- X. Xu, R. Ray and Y. Gu, et al., Electrophoretic Analysis and Purification of Fluorescent Single-Walled Carbon Nanotube Fragments, J. Am. Chem. Soc., 2004, 126(40), 12736–12737 CrossRef CAS PubMed.
- C. Zhao, Y. Jiao and F. Hu, et al., Green synthesis of carbon dots from pork and application as nanosensors for uric acid detection, Spectrochim. Acta, Part A, 2018, 190, 360–367 CrossRef CAS PubMed.
- P. G. Luo, S. Sahu and S.-T. Yang, et al., Carbon “quantum” dots for optical bioimaging, J. Mater. Chem. B, 2013, 1(16), 2116 RSC.
- Y. P. Sun, B. Zhou and Y. Lin, et al., Quantum-Sized Carbon Dots for Bright and Colorful Photoluminescence, J. Am. Chem. Soc., 2006, 128(24), 7756–7757 CrossRef CAS PubMed.
- G. E. LeCroy, S. K. Sonkar and F. Yang, et al., Toward Structurally Defined Carbon Dots as Ultracompact Fluorescent Probes, ACS Nano, 2014, 8(5), 4522–4529 CrossRef CAS PubMed.
- Y. Song, S. Zhu and B. Yang, Bioimaging based on fluorescent carbon dots, RSC Adv., 2014, 4(52), 27184–27200 RSC.
- H. Huang, Y. Xu and C. J. Tang, et al., Facile and green synthesis of photoluminescent carbon nanoparticles for cellular imaging, New J. Chem., 2014, 38(2), 784–789 RSC.
- S. Zhu, Q. Meng and L. Wang, et al., Highly photoluminescent carbon dots for multicolor patterning, sensors, and bioimaging, Angew. Chem., Int. Ed. Engl., 2013, 52(14), 3953–3957 CrossRef CAS PubMed.
- W. Wei, C. Xu and L. Wu, et al., Non-enzymatic-browning-reaction: a versatile route for production of nitrogen-doped carbon dots with tunable multicolor luminescent display, Sci. Rep., 2014, 4, 3564 CrossRef PubMed.
- S. Qu, X. Wang and Q. Lu, et al., A biocompatible fluorescent ink based on water-soluble luminescent carbon nanodots, Angew. Chem., Int. Ed. Engl., 2012, 51(49), 12215–12218 CrossRef CAS PubMed.
- Y. Chen, M. Zheng and Y. Xiao, et al., A Self-Quenching-Resistant Carbon-Dot Powder with Tunable Solid-State Fluorescence and Construction of Dual-Fluorescence Morphologies for White Light-Emission, Adv. Mater., 2016, 28(2), 312–318 CrossRef CAS PubMed.
- L.-H. Mao, W.-Q. Tang and Z.-Y. Deng, et al., Facile Access to White Fluorescent Carbon Dots toward Light-Emitting Devices, Ind. Eng. Chem. Res., 2014, 53(15), 6417–6425 CrossRef CAS.
- X. Guo, C. F. Wang and Z. Y. Yu, et al., Facile access to versatile fluorescent carbon dots toward light-emitting diodes, Chem. Commun., 2012, 48(21), 2692–2694 RSC.
- M. Shamsipur, A. Barati and S. Karami, Long-wavelength, multicolor, and white-light emitting carbon-based dots: achievements made, challenges remaining, and applications, Carbon, 2017, 124, 429–472 CrossRef CAS.
- H. Ali, S. K. Bhunia and C. Dalal, et al., Red Fluorescent Carbon Nanoparticle-Based Cell Imaging Probe, ACS Appl. Mater. Interfaces, 2016, 8(14), 9305–9313 CrossRef CAS PubMed.
- H. Huang, Y. C. Lu and A. J. Wang, et al., A facile, green, and solvent-free route to nitrogen–sulfur-codoped fluorescent carbon nanoparticles for cellular imaging, RSC Adv., 2014, 4(23), 11872–11875 RSC.
- W. P. Wang, Y. C. Lu and H. Huang, et al., Facile synthesis of water-soluble and biocompatible fluorescent nitrogen-doped carbon dots for cell imaging, Analyst, 2014, 139(7), 1692–1696 RSC.
- W. J. Lu, X. J. Gong and Z. H. Yang, et al., High-quality water-soluble luminescent carbon dots for multicolor patterning, sensors, and bioimaging, RSC Adv., 2015, 5(22), 16972–16979 RSC.
- Y. Q. Dong, R. X. Wang and H. Li, et al., Polyamine-functionalized carbon quantum dots for chemical sensing, Carbon, 2012, 50(8), 2810–2815 CrossRef CAS.
- M. Xu, G. He and Z. Li, et al., A green heterogeneous synthesis of N-doped carbon dots and their photoluminescence applications in solid and aqueous states, Nanoscale, 2014, 6(17), 10307–10315 RSC.
- J. Zhu, X. Bai and Y. Zhai, et al., Carbon dots with efficient solid-state photoluminescence towards white light-emitting diodes, J. Mater. Chem. C, 2017, 5(44), 11416–11420 RSC.
- H. M. Zidan, E. M. Abdelrazek and A. M. Abdelghany, et al., Characterization and some physical studies of PVA/PVP filled with MWCNTs, J. Mater. Res. Technol., 2018 DOI:10.1016/j.jmrt.2018.04.023.
- X. Cui, Y. Wang and J. Liu, et al., Dual functional N- and S-co-doped carbon dots as the sensor for temperature and Fe3+ ions, Sens. Actuators, B, 2017, 242, 1272–1280 CrossRef CAS.
- X. Qu, Q. Liu and X. Ji, et al., Enhancing the Stokes' shift of BODIPY dyes via through-bond energy transfer and its application for Fe3+-detection in live cell imaging, Chem. Commun., 2012, 48(38), 4600–4602 RSC.
- P. Wu, Y. Li and X. P. Yan, et al., CdTe Quantum Dots (QDs) Based Kinetic Discrimination of Fe2+ and Fe3+, and CdTe QDs-Fenton Hybrid System for Sensitive Photoluminescent Detection of Fe2+, Anal. Chem., 2009, 81(15), 6252–6257 CrossRef CAS.
- L. Shang, L. Yang and F. Stockmar, et al., Microwave-assisted rapid synthesis of luminescent gold nanoclusters for sensing Hg2+ in living cells using fluorescence imaging, Nanoscale, 2012, 4(14), 4155–4160 RSC.
- C. X. Yang, H. B. Ren and X. P. Yan, et al., Fluorescent Metal–Organic Framework MIL-53(Al) for Highly Selective and Sensitive Detection of Fe3+ in Aqueous Solution, Anal. Chem., 2013, 85(15), 7441–7446 CrossRef CAS PubMed.
- B. Shi, Y. Su and L. Zhang, et al., Nitrogen and Phosphorus Co-Doped Carbon Nanodots as a Novel Fluorescent Probe for Highly Sensitive Detection of Fe(3+) in Human Serum and Living Cells, ACS Appl. Mater. Interfaces, 2016, 8(17), 10717–10725 CrossRef CAS PubMed.
- W. P. Wang, Y. H. Lu and H. Huang, et al., Solvent-free synthesis of sulfur- and nitrogen-co-doped fluorescent carbon nanoparticles from glutathione for highly selective and sensitive detection of mercury(II) ions, Sens. Actuators, B, 2014, 202, 741–747 CrossRef CAS.
- H. Zhu, X. Wang and Y. Li, et al., Microwave synthesis of fluorescent carbon nanoparticles with electrochemiluminescence properties, Chem. Commun., 2009, 34, 5118–5120 RSC.
- F. S. Niu, Y. L. Ying and X. Hua, et al., Electrochemically generated green-fluorescent N-doped carbon quantum dots for facile monitoring alkaline phosphatase activity based on the Fe3+-mediating ON-OFF-ON-OFF fluorescence principle, Carbon, 2018, 127, 340–348 CrossRef CAS.
- Q. Xu, P. Pu and J. G. Zhao, et al., Preparation of highly photoluminescent sulfur-doped carbon dots for Fe(iii) detection, J. Mater. Chem. A, 2015, 3(2), 542–546 RSC.
- M. Asha Jhonsi and S. Thulasi, A novel fluorescent carbon dots derived from tamarind, Chem. Phys. Lett., 2016, 661, 179–184 CrossRef CAS.
- W. Kwon, G. Lee and S. Do, et al., Size-controlled soft-template synthesis of carbon nanodots toward versatile photoactive materials, Small, 2014, 10(3), 506–513 CrossRef CAS PubMed.
- L. Wu, X. Cai and K. Nelson, et al., A Green Synthesis of Carbon Nanoparticle from Honey for Real-Time Photoacoustic Imaging, Nano Res., 2013, 6(5), 312–325 CrossRef CAS PubMed.
- Y. A. Wang, J. J. Li and H. Chen, et al., Stabilization of Inorganic Nanocrystals by Organic Dendrons, J. Am. Chem. Soc., 2002, 124(10), 2293–2298 CrossRef CAS PubMed.
- Y. Kuai, R. Fang and C. Zhang, et al., A convenient way of activating carbon quantum dots and the efficient isolation, Mater. Res. Bull., 2018, 104, 119–123 CrossRef CAS.
- A. B. Bourlinos, G. Trivizas and M. A. Karakassides, et al., Green and simple route toward boron doped carbon dots with significantly enhanced non-linear optical properties, Carbon, 2015, 83, 173–179 CrossRef CAS.
- M. A. Patel, F. Luo and M. R. Khoshi, et al., P-Doped Porous Carbon as Metal Free Catalysts for Selective Aerobic Oxidation with an Unexpected Mechanism, ACS Nano, 2016, 10(2), 2305–2315 CrossRef CAS PubMed.
- Q. Liang, W. Ma and Y. Shi, et al., Easy synthesis of highly fluorescent carbon quantum dots from gelatin and their luminescent properties and applications, Carbon, 2013, 60, 421–428 CrossRef CAS.
- J. Liu, D. Li and K. Zhang, et al., One-Step Hydrothermal Synthesis of Nitrogen-Doped Conjugated Carbonized Polymer Dots with 31% Efficient Red Emission for In Vivo Imaging, Small, 2018, 14(15), 1703919 CrossRef PubMed.
- J. Wang, F. Peng and Y. Lu, et al., Large-Scale Green Synthesis of Fluorescent Carbon Nanodots and Their Use in Optics Applications, Adv. Opt. Mater., 2015, 3(1), 103–111 CrossRef CAS.
- J. Shang, L. Ma and J. Li, et al., The origin of fluorescence from graphene oxide, Sci. Rep., 2012, 2, 792 CrossRef PubMed.
- Y. Dong, N. Zhou and X. Lin, et al., Extraction of Electrochemiluminescent Oxidized Carbon Quantum Dots from Activated Carbon, Chem. Mater., 2010, 22(21), 5895–5899 CrossRef CAS.
- L. Cao, M. J. Meziani and S. Sahu, et al., Photoluminescence Properties of Graphene versus Other Carbon Nanomaterials, Acc. Chem. Res., 2013, 46(1), 171–180 CrossRef CAS PubMed.
- S. Sun, L. Zhang and K. Jiang, et al., Toward High-Efficient Red Emissive Carbon Dots: Facile Preparation, Unique Properties, and Applications as Multifunctional Theranostic Agents, Chem. Mater., 2016, 28(23), 8659–8668 CrossRef CAS.
- L. Shi, L. Li and X. Li, et al., Excitation-independent yellow-fluorescent nitrogen-doped carbon nanodots for biological imaging and paper-based sensing, Sens. Actuators, B, 2017, 251, 234–241 CrossRef CAS.
- D. Sun, R. Ban and P.-H. Zhang, et al., Hair fiber as a precursor for synthesizing of sulfur- and nitrogen-co-doped carbon dots with tunable luminescence properties, Carbon, 2013, 64, 424–434 CrossRef CAS.
- G. Gao, Y.-W. Jiang and H.-R. Jia, et al., On-off-on fluorescent nanosensor for Fe3+ detection and cancer/normal cell differentiation via silicon-doped carbon quantum dots, Carbon, 2018, 134, 232–243 CrossRef CAS.
- R. Yang, X. Guo and L. Jia, et al., Green preparation of carbon dots with mangosteen pulp for the selective detection of Fe3+ ions and cell imaging, Appl. Surf. Sci., 2017, 423, 426–432 CrossRef CAS.
|
| This journal is © The Royal Society of Chemistry 2019 |
Click here to see how this site uses Cookies. View our privacy policy here. 
 Open Access Article
 This Open Access Article is licensed under a Creative Commons Attribution-Non Commercial 3.0 Unported Licence
 *a,
Haohong Chenb,
Luqiao Yinc,
Ying Shi*a and
Jianjun Xiea
*a,
Haohong Chenb,
Luqiao Yinc,
Ying Shi*a and
Jianjun Xiea