 Open Access Article
Ochrasperfloroid, an ochratoxin–ergosteroid heterodimer with inhibition of IL-6 and NO production from Aspergillus flocculosus 16D-1†
Bin-Bin Gu,
Fu-Rong Jiao,
Wei Wu,
Lei Liu,
Wei-Hua Jiao ,
Fan Sun,
Shu-Ping Wang,
Fan Yang and
Hou-Wen Lin
 *
*
Key Laboratory for Marine Drugs, Department of Pharmacy, State Key Laboratory of Oncogenes and Related Genes, Renji Hospital School of Medicine, Shanghai Jiao Tong University, Shanghai 200127, China. E-mail: franklin67@126.com
First published on 4th March 2019
Abstract
A novel ochratoxin–ergosteroid heterodimer, ochrasperfloroid (1), together with a known mycotoxin, ochratoxin A (2), were isolated from the sponge-derived fungus Aspergillus flocculosus 16D-1. The structure of 1 was determined on the basis of 1D/2D NMR, HRESIMS/MS, and LC-UV/MS analysis of its alkaline hydrolyzates, quantum-chemical 13C NMR calculation, and comparison with literature data. Of note, the ergosteroid embedded in 1 is also a new structure. Ochrasperfloroid (1) showed potent inhibitory activity towards IL-6 production in lipopolysaccharide (LPS)-induced THP-1 cell line, with an IC50 value of 2.02 μM, and NO production in LPS-activated RAW264.7 macrophages, with an IC50 value of 1.11 μM.
Introduction
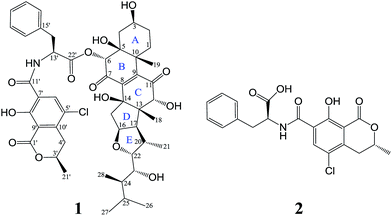
Inflammatory responses play critical roles in cancer development and progression, including tumor initiation, promotion, progression, and metastasis.1–6 Interleukin-6 (IL-6) and nitric oxide (NO) can be expressed at high levels in the tumor microenvironment and are now recognized as important mediators linking inflammation and cancer.1–10 Therefore, IL-6 and NO are promising therapeutic and preventive targets as well as prognostic factors for cancer.1–6,8–10In recent years, marine-derived fungi have been attracting ever-increasing attention as a promising reservoir for new biologically and pharmaceutically active marine natural products (MNPs) and have risen to the third-largest source of MNPs.11–15 Sponge-derived fungi, as fungi with unique habitat, represent an important fountainhead of novel bioactive MNPs for drug discovery.11–14,16 In our continuous endeavor to search for potential immunomodulatory MNPs,17–19 the metabolites produced by Aspergillus flocculosus 16D-1, a fungus isolated from the inner tissue of the sponge Phakellia fusca, were analyzed. The EtOAc extract displayed inhibitory activity against IL-6 production in lipopolysaccharide (LPS)-induced THP-1 cell line and NO production in LPS-activated RAW264.7 macrophage cells. Subsequent separation and purification of the extract resulted in the discovery of ochrasperfloroid (1), a novel ochratoxin–ergosteroid heterodimer, and ochratoxin A (2),20 one of the most-abundant food-contaminating mycotoxins (Fig. 1). It is noteworthy that the ergosteroid embedded in 1 is also a new structure. Herein, we report the isolation, structure elucidation, and biological evaluation of compounds 1 and 2.
Results and discussion
Ochrasperfloroid (1) was evidenced to have a molecular formula of C48H58NO14Cl with 20 degrees of unsaturation, based on its [M − H]− molecular ion at m/z 906.3483 in the HRESIMS. The IR spectrum displayed absorptions for hydroxy (3380 cm−1) and carbonyl (1751, 1679 cm−1) groups. The 1H NMR and HSQC spectra (Table 1) showed 18 methines, which include eight oxygenated/aminated methines (δH 5.62, 5.06, 4.85, 4.75, 4.01, 4.00, 3.47, 3.14) and six aromatic methines (δH 8.06, 7.36, 7.36, 7.29, 7.29, 7.22), six methylenes (δH 3.21, 3.36; 3.23, 2.91; 2.27; 2.18, 1.89; 1.32, 1.97; 1.33, 1.50), and seven methyls (δH 1.48, 1.47, 1.04, 0.93, 0.86, 0.70, 0.67). According to the molecular formula, the remaining seven hydrogens are due to the presence of seven exchangeable protons in the molecule, three of which are visible in the 1H NMR spectrum (δH 12.61, 8.65, 6.28). Its 13C NMR and DEPT spectra (Table 1) manifested a total of 48 carbon resonances divided into 19 sp2 carbon atoms [six methine carbons and 13 nonprotonated carbons, five of which are carbonyl carbons (δC 202.5, 193.7, 170.2, 168.3, 163.0)] and 29 sp3 carbon atoms (four nonprotonated carbon atoms, 12 methine, six methylene, and seven methyl carbon atoms), accounting for 12 degrees of double-bond equivalents. The remaining eight degrees of unsaturation are due to the presence of eight rings in the molecule.| Position | δC, type | δH (J in Hz) | Position | δC, type | δH (J in Hz) |
|---|---|---|---|---|---|
| a Overlapped with other signals. | |||||
| 1 | 23.1, CH2 | α2.18, brd (14.3) | 26 | 15.6, CH3 | 0.70, d (6.8) |
| β1.89, td (14.3, 3.2) | 27 | 21.8, CH3 | 0.86, d (6.9) | ||
| 2 | 29.2, CH2 | α1.33a, m | 28 | 10.0, CH3 | 0.67, d (6.9) |
| β1.50a, m | 12-OH | 6.28, d (4.3) | |||
| 3 | 64.4, CH | 4.01a, m | 1′ | 168.3, C | |
| 4 | 31.8, CH2 | α1.32, brd (14.1) | 3′ | 75.4, CH | 4.85, m |
| β1.97, brd (14.1) | 4′ | 31.6, CH2 | 3.23a, dd (17.3, 3.3) | ||
| 5 | 75.1, C | 2.91, dd (17.3, 11.7) | |||
| 6 | 78.5, CH | 5.62, s | 5′ | 121.5, C | |
| 7 | 193.7, C | 6′ | 136.0, CH | 8.06, s | |
| 8 | 145.5, C | 7′ | 120.1, C | ||
| 9 | 146.8, C | 8′ | 158.3, C | ||
| 10 | 44.2, C | 9′ | 111.3, C | ||
| 11 | 202.5, C | 10′ | 141.7, C | ||
| 12 | 82.1, CH | 3.47, d (4.3) | 11′ | 163.0, C | |
| 13 | 54.7, C | 12′-NH | 8.65, d (8.0) | ||
| 14 | 80.7, C | 13′ | 53.7, CH | 5.06, td (8.0, 5.0) | |
| 15 | 49.6, CH2 | 2.27, m | 14′ | 36.8, CH2 | 3.21a, dd (14.0, 8.4) |
| 16 | 85.0, CH | 4.75, td (7.4, 2.5) | 3.36, dd (14.0, 5.0) | ||
| 17 | 58.7, CH | 2.32, t (7.4) | 15′ | 136.6, C | |
| 18 | 15.14, CH3 | 0.93, s | 16′ | 129.4, CH | 7.36, d (7.4) |
| 19 | 22.7, CH3 | 1.48, s | 17′ | 128.3, CH | 7.29, t (7.4) |
| 20 | 38.7, CH | 2.64, m | 18′ | 126.7, CH | 7.22, t (7.4) |
| 21 | 15.08, CH3 | 1.04, d (6.9) | 19′ | 128.3, CH | 7.29, t (7.4) |
| 22 | 81.6, CH | 4.00a, dd (7.8, 1.7) | 20′ | 129.4, CH | 7.36, d (7.4) |
| 23 | 72.7, CH | 3.14, dd (9.1, 1.7) | 21′ | 20.1, CH3 | 1.47, d (6.3) |
| 24 | 40.3, CH | 1.56, m | 22′ | 170.2, C | |
| 25 | 25.5, CH | 2.10, m | 8′-OH | 12.61, s | |
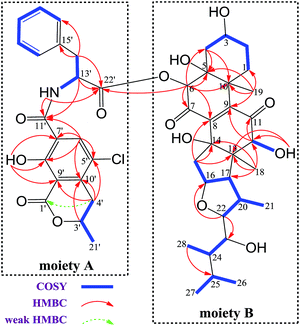
The 1H and 13C NMR spectroscopic data of 1 at positions 1′−22′ are almost the same as those of 2 (Tables 1 and S3†), indicating the presence of substructure A in 1 (Fig. 2), which was confirmed by analysis of the COSY and HMBC data.
Methine H-22 (δH 4.00) showed two-bond connectivity to C-23 (δC 72.7) and three-bond correlation to C-16 (δC 85.0). Methyl H3-28 (δH 0.67) exhibited three-bond coupling to C-25 (δC 25.5). These HMBC correlations together with COSY determined spin systems H2-15/H-16/H-17/H-20 (H-20/H3-21)/H-22, H-23/H-24/H3-28, and H3-26/H-25/H3-27 were sufficient in generating the E ring and its exocyclic C-22 alkanol side chain (Fig. 2). H3-18 (δH 0.93) showed three-bond correlations to C-12 (δC 82.1), C-14 (δC 80.7), and C-17 (δC 58.7) and two-bond correlation to C-13 (δC 54.7) and H2-15 (δH 2.27) showed three-bond correlations to C-13 and C-8 (δC 145.5) and two-bond correlation to C-14, constructing the D ring and its C-14-connected olefinic carbon C-8 and C-13-connected oxygenated methine carbon C-12. A consecutive COSY correlations, H2-1/H2-2/H-3/H2-4, coupled with HMBC correlations from H-4β (δH 1.97) to C-5 (δC 75.1) and C-10 (δC 44.2), from H3-19 (δH 1.48) to C-1 (δC 23.1), C-5, C-9 (δC 146.8), and C-10, and from H-6 (δH 5.62) to C-4 (δC 31.8), C-5, and C-10 corroborated the presence of ring A and its C-5-connected oxygenated methine carbon C-6 (δC 78.5) and C-10-connected olefinic carbon C-9 (Fig. 2). In addition, an HMBC correlation from H-6 to C-22′ (δC 170.2) indicated an ester linkage between moiety A and C-6.
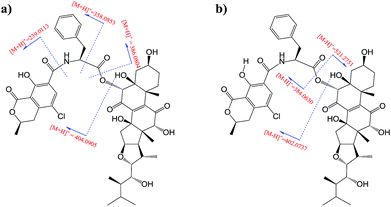
Moiety A accounts for two exchangeable protons, which leaves five exchangeable protons unassigned in substructure B. Accordingly, oxygenated carbons C-3 (δC 64.4), C-5, C-12, C-14, and C-23 in subunit B must be hydroxy-anchored carbons. Then it only remained to assign two carbonyls, C-7 (δC 193.7) and C-11 (δC 202.5), and to construct the last two rings in substructure B. As C-8 and C-9 are the only two olefinic carbons in compound 1, they must be connected directly. On the basis of geometric considerations and HMBC correlations of H-6/C-7, H-6/C-8, H-12 (δH 3.47)/C-9, and H-12/C-11, it could only be explained by inserting carbonyl C-7 between C-6 and C-8, generating ring B, and inserting carbonyl C-11 between C-9 and C-12, constructing ring C (Fig. 2). The assignments were further confirmed by the HRESIMS/MS fragment ion series at m/z 386.0804 [M + H]+, 404.0905 [M + H]+, 358.0853 [M + H]+, 239.0113 [M + H]+, 402.0737 [M − H]−, 521.2751 [M − H]−, and 384.0630 [M − H]− (Fig. 3).
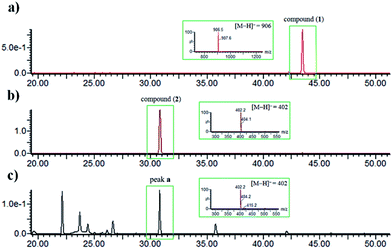
The identity of moiety A as shown (Fig. 1) was substantiated by LC-UV/MS analysis the base hydrolysates of 1 (Fig. 4), wherein peak a has the same retention time, m/z ratio, and M + 2 isotope pattern as 2, and by comparison the specific rotation of the re-purified compound “peak a” ([α]25D −58.0 (c 0.4, MeOH)) with that of 2 ([α]25D −60.0 (c 0.4, MeOH)).21
We then tried to establish the relative configurations of 13 stereogenic centers (C-3, C-5, C-6, C-10, C-12, C-13, C-14, C-16, C-17, C-20, C-22, C-23, and C-24) in moiety B (Fig. 2). Nevertheless, rings A/B and C/D/E are segregated by an unsaturated ketone segment (C-7/C-8/C-9/C-11), which means that the relaying of configurational assignment from A/B to C/D/E is cut off. Therefore, the relative configurations of rings A/B and C/D/E were assigned separately (Fig. 5).
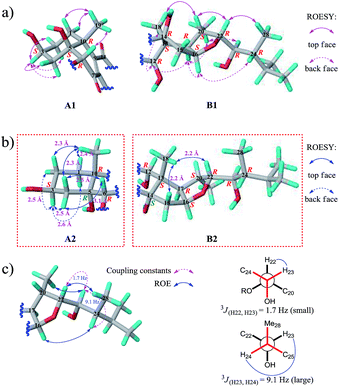
The ROESY correlation Me-19/H-6 revealed the relative configurations of C-6 and C-10 (6R* and 10R*; Fig. 5a, A1). However, no evidence existed from which the relative configurations of C-3 and C-5 could be determined directly. Regardless of the configuration of C-3, there have two candidate stereoisomers (A1 and A2) for unit A/B (Fig. 5a and b), and only A1 satisfied the ROESY correlations observed on rings A/B, as shown in the molecular modeling simulation, by which the relative configuration of C-5 (5S*) was revealed. Next, the ROESY cross-peaks of H-3/H-2α, H-3/H-2β, H-3/H-4α, and H-3/H-4β uncovered the 3S* configuration for C-3 (Fig. 5a, A1).
The relative configurations of C-12, C-13, C-16, C-17, C-20, and C-22 (12R*, 13S*, 16S*, 17R*, 20S*, and 22R*) in rings C/D/E were unmasked by “top face” correlations H-20/Me-18 and H-20/H-22 and “back face” correlations Me-18/H-12, H-17/H-12, H-17/H-16, and H-17/Me-21 (Fig. 5a, B1). As the situation described above, the remaining one stereogenic center C-14 in unit C/D/E led to two candidate stereoisomers B1 and B2 (Fig. 5a and b), and only B1 was in line with the ROESY correlations observed. Thus, the relative configuration of C-14 was ascertained to be 14R* (Fig. 5a, B1). The relative configurations of C-23 and C-24 on the alkanol side chain were determined to be 23R* and 24R* by conformational analysis, based on ROESY correlations Me-21/H-23, H-22/Me-28, and H-16/H-24 and coupling constants 3JH22-H23 and 3JH23-H24 (Fig. 5c), which can also be supported by the fact that the chemical shifts of the C-22 alkanol side chain of 1 are nearly the same as that of asperflosterol,19 which was previously isolated from the same fungus.
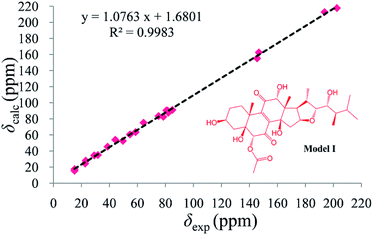
As compound 1 and asperflosterol19 are derived from the same fungus and they have the same relative configurations at C-3, C-5, C-10, C-12, C-13, C-14, C-16, C-17, C-20, C-22, C-23, and C-24, which was supported by 13C NMR chemical shifts calculation of the analogue of moiety B (model I, CMAE = 1.9 ppm, RMSD = 2.2 ppm, R2 = 0.9983; see Fig. 6 and Table S2†),22 we assigned the absolute configuration of moiety B as shown (Fig. 1). Thus, the structure of 1 was established with its absolute configuration. Since compound 1 is a heterodimer containing ochratoxin A (2), which is connected by an ester linkage to a new ergosteroid in 1, it is possible that 1 was formed as an artifact during the extraction and isolation procedure.
Compounds 1 and 2 were evaluated for their inhibitory effects on IL-6 production in LPS-induced THP-1 cells and NO production in LPS-activated RAW264.7 macrophages. As shown in Table 2, compound 1 showed potent inhibitory activities against IL-6 and NO productions with IC50 values of 2.02 and 1.11 μM, respectively, whereas compound 2 exhibited no inhibitory effects on IL-6 and NO productions (IC50 > 25 μM). An CCK-8 assay was carried out to determine whether the suppressive effects were related to cell viability, but no cytotoxicities against THP-1 and RAW264.7 cells were detected (IC50 > 20 μM), suggesting that the inhibitory activities towards IL-6 and NO productions did not involve general cytotoxicity. In addition, cytotoxic activity against A549 and HepG2 cell lines was performed, indicating that 1 and 2 displayed weak to medium cytotoxic activity against these two tumor cell lines with IC50 values of 55.0 and 50.3 μM for A549 cells and 23.6 and 22.7 μM for HepG2 cells, respectively.
Conclusions
A novel ochratoxin–ergosteroid heterodimer, ochrasperfloroid (1), along with a known mycotoxin, ochratoxin A (2), were isolated from the sponge derived fungus A. flocculosus 16D-1. 1 showed significant inhibitory effects on IL-6 production in LPS-induced THP-1 cells and NO production in LPS-activated RAW264.7 cells, whereas 2 showed no inhibitory effects on IL-6 and NO productions. Besides, 1 and 2 showed weak to medium cytotoxic activity against A549 and HepG2 cell lines. Although the EtOAc extract of A. flocculosus 16D-1 was thoroughly checked and isolated, we did not find the new ergosteroid that embedded in 1. Moreover, acid or alkaline hydrolysis of 1 didn't afford the ergosteroid as well. Therefore, it is challenging to address the detailed structure–bioactivity relationship of 1 and 2.Experimental section
General procedures
Optical rotation measurements were carried out on a PerkinElmer model 341 polarimeter with a 10 cm length cell at room temperature. IR and UV spectra were recorded on a Bruker tensor 27 FTIR spectrometer and a Hitachi U-3010 spectrophotometer, respectively. ECD spectra were obtained from a Jasco J-715 spectropolarimeter. 1H, 13C, DEPT135, COSY, HSQC, HMBC, and ROESY NMR spectra were collected on an Agilent 600 MHz NMR apparatus. Chemical shifts (δ) are referenced to tetramethylsilane (TMS) at 0.00 ppm and the residual solvent peak of DMSO-d6 at 39.52 ppm, for proton and carbon, respectively. HRESIMS and HRESIMS/MS spectra were determined on a Waters Xevo G2-XS QTOF spectrometer. HPLC-MS spectra were collected using a Waters HPLC system equipped with a Waters Acquity QDa spectrometer and a Waters XBridge C18 column (4.6 × 250 mm, 5 μm). Analytical thin-layer chromatography (TLC) systems were performed on silica gel 60 F254 plates. Column chromatography was performed using silica gel 60 (200–300 mesh; Yantai). Preparative MPLC was carried out on an Interchim Puriflash 450 apparatus. Semipreparative reversed-phased HPLC (RP-HPLC) was carried out using a Waters 1525 pump equipped with a 2998 photodiode array detector and a Waters XBridge C18 column (10 × 250 mm, 5 μm).Fungal material
The fungus A. flocculosus 16D-1 was isolated from the inner tissue of the sponge Phakellia fusca collected from Yongxing Island, China. The specific name was identified according to its ITS rDNA sequences (GenBank accession no. KM605191). A voucher specimen of this fungus was deposited at the School of Life Sciences and Biotechnology, Shanghai Jiao Tong University, Shanghai, China.Culture, extraction, and isolation
The strain was initially activated on PDA medium in a Petri dish for 7 days. Afterwards, its spores were directly inoculated into 250 mL Erlenmeyer flasks each containing 100 mL of the seed medium (dextrose 20 g L−1, potato starch 200 g L−1, and artificial seawater salts 30 g L−1 in purified H2O) on a rotary shaker with 180 rpm at 28 °C for 72 h. The subsequent amplified fermentation was carried out in 120 × 2 L Erlenmeyer flasks. Each flask contained 80 g of rice, 120 mL of distilled H2O, and 2 g artificial seawater salts, where 20 mL of the seed culture was transferred and incubated under static conditions at 25 °C for 40 days. The fermented substrate was exhaustively extracted with EtOAc, affording 56 g of extract after evaporating the solvent under reduced pressure. The extract (56 g) was subjected to column chromatography (CC) on silica gel, eluting with a CH2Cl2/MeOH gradient system (from 150![[thin space (1/6-em)]](https://www.rsc.org/images/entities/char_2009.gif) :
:![[thin space (1/6-em)]](https://www.rsc.org/images/entities/char_2009.gif) 1 to 0
1 to 0![[thin space (1/6-em)]](https://www.rsc.org/images/entities/char_2009.gif) :
:![[thin space (1/6-em)]](https://www.rsc.org/images/entities/char_2009.gif) 1), to afford 12 fractions (Fr.1-12). Fr.12 (1.38 g) was subjected to reversed-phase ODS MPLC (10–100% MeOH/H2O, flow rate 20 mL min−1, 180 min, UV detection at 210 nm) to give nine subfractions (Fr.12-1–Fr.12-9). Next, the subfraction Fr.12-7 (430 mg) was separated by semipreparative reversed-phase HPLC [Waters XBridge C18 column (10 × 250 mm, 5 μm), 60% MeCN/H2O (0.1% formic acid), 2.0 mL min−1, UV detection at 330 nm] to yield ochratoxin A (2, 100 mg, tR 20.5 min). Fr.3 (8.26 g) was subjected to reversed-phase ODS MPLC (10–100% MeOH/H2O, flow rate 20 mL min−1, 180 min, UV detection at 210 nm) to yield 39 subfractions (Fr.3-1–Fr.3-39). Subfraction Fr.3-30 (150 mg) was then separated by semipreparative reversed-phase HPLC [Waters XBridge C18 column (10 × 250 mm, 5 μm), 87% MeOH/H2O, 2.0 mL min−1, UV detection at 330 nm] to yield ochrasperfloroid (1, 27.7 mg, tR 15.4 min).
1), to afford 12 fractions (Fr.1-12). Fr.12 (1.38 g) was subjected to reversed-phase ODS MPLC (10–100% MeOH/H2O, flow rate 20 mL min−1, 180 min, UV detection at 210 nm) to give nine subfractions (Fr.12-1–Fr.12-9). Next, the subfraction Fr.12-7 (430 mg) was separated by semipreparative reversed-phase HPLC [Waters XBridge C18 column (10 × 250 mm, 5 μm), 60% MeCN/H2O (0.1% formic acid), 2.0 mL min−1, UV detection at 330 nm] to yield ochratoxin A (2, 100 mg, tR 20.5 min). Fr.3 (8.26 g) was subjected to reversed-phase ODS MPLC (10–100% MeOH/H2O, flow rate 20 mL min−1, 180 min, UV detection at 210 nm) to yield 39 subfractions (Fr.3-1–Fr.3-39). Subfraction Fr.3-30 (150 mg) was then separated by semipreparative reversed-phase HPLC [Waters XBridge C18 column (10 × 250 mm, 5 μm), 87% MeOH/H2O, 2.0 mL min−1, UV detection at 330 nm] to yield ochrasperfloroid (1, 27.7 mg, tR 15.4 min).
![[thin space (1/6-em)]](https://www.rsc.org/images/entities/char_2009.gif) ε) 200 (5.04), 330 (3.83) nm; IR (film) νmax 3380, 3066, 2956, 1751, 1679, 1611, 1531, 1426, 1385, 1366, 1304, 1271, 1212, 1173, 1138, 1112, 1059, 1032, 992 cm−1; ECD (7.87 × 10⁻⁴ M, MeOH), λmax (Δε) 200 (12.83), 231 (−8.13), 269 (5.77), 345 (−1.13), 413 (0.48) nm; 1H and 13C NMR data (DMSO-d6), Table 1; HRESIMS m/z 906.3483 [M − H]− (calcd for C48H57NO14Cl, 906.3468).
ε) 200 (5.04), 330 (3.83) nm; IR (film) νmax 3380, 3066, 2956, 1751, 1679, 1611, 1531, 1426, 1385, 1366, 1304, 1271, 1212, 1173, 1138, 1112, 1059, 1032, 992 cm−1; ECD (7.87 × 10⁻⁴ M, MeOH), λmax (Δε) 200 (12.83), 231 (−8.13), 269 (5.77), 345 (−1.13), 413 (0.48) nm; 1H and 13C NMR data (DMSO-d6), Table 1; HRESIMS m/z 906.3483 [M − H]− (calcd for C48H57NO14Cl, 906.3468).Cytotoxicity assay
The cytotoxic activities of compounds 1 and 2 towards THP-1, RAW264.7, A549, and HepG2 cell lines were assessed by the CCK-8 method as described previously.23 Doxorubicin (0.80, 3.40, 0.13, and 0.06 μM, respectively) was used as positive control.IL-6 immune-suppressive activity assay
The IL-6 immune–suppressive activity of compounds 1 and 2 was evaluated according to the method described by Chen et al.24 Corylifol A was used as positive control.25Nitric oxide inhibitory activity assay
The NO inhibitory activity of compounds 1 and 2 was assessed with the method described previously.26 Diphenyleneiodonium chloride was used as positive control.27Conflicts of interest
There are no conflicts of interest to declare.Acknowledgements
This project is financially supported by National Key Research and Development Program of China (2018YFC0310900), National Natural Science Fund of China (No. 41476121, U1605221, 21502113, 41576130, 81502936, 81741151).Notes and references
- N. Unver and F. Mcallister, Cytokine Growth Factor Rev., 2018, 41, 10 CrossRef CAS PubMed.
- T. Tanaka, M. Narazaki and T. Kishimoto, Cold Spring Harbor Perspect. Biol., 2014, 6, a016295 CrossRef PubMed.
- D. E. Johnson, R. A. O'Keefe and J. R. Grandis, Nat. Rev. Clin. Oncol., 2018, 15, 234 CrossRef CAS PubMed.
- Y. Guo, F. Xu, T. Lu, Z. Duan and Z. Zhang, Cancer Treat. Rev., 2012, 38, 904 CrossRef CAS PubMed.
- K. Taniguchi and M. Karin, Semin. Immunol., 2014, 26, 54 CrossRef CAS PubMed.
- C. A. Hunter and S. A. Jones, Nat. Immunol., 2015, 16, 448 CrossRef CAS PubMed.
- D. F. Quail and J. A. Joyce, Nat. Med., 2013, 19, 1423 CrossRef CAS PubMed.
- A. Maiuthed, N. Bhummaphan, S. Luanpitpong, A. Mutirangura, C. Aporntewan, A. Meeprasert, T. Rungrotmongkol, Y. Rojanasakul and P. Chanvorachote, J. Biol. Chem., 2018, 293, 13534 CrossRef CAS PubMed.
- H. Cheng, L. Wang, M. Mollica, A. T. Re, S. Wu and L. Zuo, Cancer Lett., 2014, 353, 1 CrossRef CAS PubMed.
- D. Basudhar, V. Somasundaram, G. A. de Oliveira, A. Kesarwala, J. L. Heinecke, R. Y. Cheng, S. A. Glynn, S. Ambs, D. A. Wink and L. A. Ridnour, Antioxid. Redox Signaling, 2017, 26, 1044 CrossRef CAS PubMed.
- M. E. Rateb and R. Ebel, Nat. Prod. Rep., 2011, 28, 290 RSC.
- J. W. Blunt, B. R. Copp, R. A. Keyzers, M. H. G. Munro and M. R. Prinsep, Nat. Prod. Rep., 2016, 33, 382 RSC.
- J. W. Blunt, B. R. Copp, R. A. Keyzers, M. H. G. Munro and M. R. Prinsep, Nat. Prod. Rep., 2017, 34, 235 RSC.
- J. W. Blunt, A. R. Carroll, B. R. Copp, R. A. Davis, R. A. Keyzers and M. R. Prinsep, Nat. Prod. Rep., 2018, 35, 8 RSC.
- M. Saleem, M. S. Ali, S. Hussain, A. Jabbar, M. Ashraf and Y. S. Lee, Nat. Prod. Rep., 2007, 24, 1142 RSC.
- U. Hentschel, J. Piel, S. M. Degnan and M. W. Taylor, Nat. Rev. Microbiol., 2012, 10, 641 CrossRef CAS PubMed.
- B.-B. Gu, W. Wu, L.-Y. Liu, J. Tang, Y.-J. Zeng, S.-P. Wang, F. Sun, L. Li, F. Yang and H.-W. Lin, Eur. J. Org. Chem., 2018, 2018, 48 CrossRef CAS.
- B.-B. Gu, F.-R. Jiao, W. Wu, W.-H. Jiao, L. Li, F. Sun, S.-P. Wang, F. Yang and H.-W. Lin, J. Nat. Prod., 2018, 81, 2275 CrossRef CAS PubMed.
- B.-B. Gu, W. Wu, F.-R. Jiao, W.-H. Jiao, L. Li, F. Sun, S.-P. Wang, F. Yang and H.-W. Lin, Org. Lett., 2018, 20, 7957 CrossRef CAS PubMed.
- L. Alanati and E. Petzinger, J. Vet. Pharmacol. Ther., 2006, 29, 79 CrossRef CAS PubMed.
- X. Xu, F. He, X. Zhang, J. Bao and S. Qi, Food Chem. Toxicol., 2013, 53, 46 CrossRef CAS PubMed.
- M. W. Lodewyk, M. R. Siebert and D. J. Tantillo, Chem. Rev., 2012, 112, 1839 CrossRef CAS PubMed.
- W.-Z. Tang, Z.-Z. Yang, F. Sun, S.-P. Wang, F. Yang and H.-W. Lin, J. Asian Nat. Prod. Res., 2017, 19, 691 CrossRef CAS PubMed.
- H. Chen, F. Wang, H. Mao and X. Yan, Biochim. Biophys. Acta, 2014, 1840, 2162 CrossRef CAS PubMed.
- S. W. Lee, B. R. Yun, M. H. Kim, C. S. Park, W. S. Lee, H. M. Oh and M. C. Rho, Planta Med., 2012, 78, 903 CrossRef CAS PubMed.
- W.-H. Jiao, T.-T. Xu, F. Zhao, H. Gao, G.-H. Shi, J. Wang, L.-L. Hong, H.-B. Yu, Y.-S. Li, F. Yang and H.-W. Lin, Eur. J. Org. Chem., 2015, 2015, 960 CrossRef CAS.
- N. Srivastava, V. K. Gonugunta, M. R. Puli and A. S. Raghavendra, Planta, 2009, 229, 757 CrossRef CAS PubMed.
Footnote |
| † Electronic supplementary information (ESI) available: 1D and 2D NMR, HRESIMS, HRESIMS/MS, UV, IR, and ECD spectra of compound 1 and 1H and 13C NMR spectra of compound 2; full details of computational method for quantum-chemical 13C NMR calculation; table of 1H and 13C NMR spectroscopic data of compound 2. See DOI: 10.1039/c8ra10539a |
| This journal is © The Royal Society of Chemistry 2019 |

