
 Open Access Article
 This Open Access Article is licensed under a Creative Commons Attribution-Non Commercial 3.0 Unported Licence
Thermal management for a tube–shell Li-ion battery pack using water evaporation coupled with forced air cooling
Guoyun Fang,
Yao Huang,
Wei Yuan *,
Yang Yang,
Yong Tang,
Weida Ju,
Fujian Chu and
Zepeng Zhao
*,
Yang Yang,
Yong Tang,
Weida Ju,
Fujian Chu and
Zepeng Zhao
School of Mechanical and Automotive Engineering, South China University of Technology, Guangzhou 510640, China. E-mail: mewyuan@scut.edu.cn
First published on 29th March 2019
Abstract
A novel battery thermal management system (BTMS) based on water evaporation (WE) and air-cooling (AC) for a tube–shell Li-ion battery (LIB) pack is designed. A sodium alginate (SA) film with a higher water content above 99% is fortified by adding polyethylene (PE) fibers. The air flow and PE-fiber composite sodium alginate (PECSA) film are both used to control the temperature of the battery pack. Results show that the maximum temperature of the battery pack can be controlled below 32 °C, when WE coupled with AC is used at a discharge rate of 1.8C within a discharge time of 1000 s. This method yields the highest performance of thermal management. The experimental results validate the numerical data, confirming that the design of WE combined with AC helps prevent overheating of a battery pack. This work also provides an automatic refilling system to solve the dehydration problem of the PECSA film.
1. Introduction
The Li-ion battery (LIB) has attracted considerable interest as an energy storage device since it provides a high energy density, long cycle life and high capacity.1 Especially in recent years, due to the rapid development of electric vehicles (EVs), the LIB has become the most attractive candidate to replace the traditional power sources for EVs. However, despite the advantages of the LIB, we must note that it also has some fatal weaknesses, e.g. power and capacity fading at a high temperature, which inevitably hinders its widespread use. What is worse, under some extreme conditions like high-temperature operation and high-rate charge and discharge, the performance of LIBs will drop dramatically. Moreover, the battery also has a risk of fire or even explosion when it works at a higher temperature for a longer time.2–5LIBs are sensitive to the temperature level. It is well-known that the most suitable operating temperature for this battery is from −20 to 60 °C, in particular a more restrictive range is 15–35 °C.6,7 The battery performance will decline sharply if the temperature is extremely high or low. At a very low temperature, the activity of the internal chemical substances in the battery becomes sluggish, leading to capacity fading. On the other hand, In the case of a higher temperature, the battery activity will be greatly increased. If the battery operates at a higher charge–discharge current and with it a higher temperature without any thermal management, the massive produced heat is difficult to be dissipated so as to cause overheating and electrolyte leakage of the battery. This may directly lead to the critical issues of operational failure or even accident.8 Feng et al. listed selected accidents of LIB failure in the past ten years, and claimed that most of the accidents directly or indirectly resulted from battery thermal runaway.9 Therefore, constructing a battery thermal management system (BTMS) is highly demanded to guarantee safe operation and long duration of LIBs.
The current working modes for BTMS include air-cooling, liquid-cooling, phase-change materials (PCMs) and heat-pipe-involved methods, according to the cooling media. The air-cooling is a conventional method that has been widely used in commercial EVs. In recent years, most of the technical progress of battery air-cooling mostly relates to the optimization of geometric layouts and operating parameters. Yang et al. analyzed the effect of lateral and longitudinal space of a battery on the cooling performance in a battery pack in which the cells were arranged in an aligned and staggered configuration. Their results showed that the most suitable lateral spacing was 32 mm while the longitudinal spacing was 34 mm.10 Xu et al. studied the forced air-cooling flow passage of vehicular power battery packs by changing the arrangement of battery packs and the shape of air duct to alter the cooling conditions.11 In addition, some other studies attempted to use flow resistance models to reveal the influence of air speed and flow path.12–14 Although the widely-used air-cooling method has the advantages of low cost, simple structure and abundant source of coolant materials, it is difficult to meet the cooling requirements of high-power batteries and extreme conditions, especially when the temperature uniformity of the battery body becomes a key criterion.
Liquid-cooling is another popular heat dissipation approach with high cooling efficiency and thermal uniformity, which has been used on the commercial EVs like General Volt and Tesla Model S. It is more able to control the battery temperature than the cooling methods based on natural convection and forced air convection, especially at high rates of charge and discharge. In this field, most of the literatures reported on the influences of fluid flow rate, fluid temperature, flow channel structure and cooling medium. He et al. used reciprocating water cooling to control the battery temperature. Their results suggested that the temperature difference among cells decreased from 4.2 to 1 °C compared with unidirectional cooling flow, and the consumed amount of cooling flow was reduced by 38%.15 A variable contact surface water cooling BTMS was designed by Rao et al.16 Three BTMSs with variable contact surface were studied and their performances were compared with the system based on constant contact surface at different inlet velocities. Besides, many studies concentrated on the effects of microchannel structures on the performance of a BTMS.17–21 However, the challenge of liquid-cooling lies in the fact that introducing extra components such as pumps and cooling channels must raise the weight and reduce the power density of a BTMS. In addition, the use of liquid-cooling also takes a high risk of leakage which may lead to short circuit of cells.
To address the above issues, a passive thermal management device using phase-change latent heat based on heat pipes has been developed to enhance heat transfer. A heat pipe operates on the principle of refrigerant evaporation and phase change, which owns light weight, high thermal conductivity and good plasticity.22 It has been used in many fields such as electronic thermal management, and also put into practice in BTMSs. For this case, the main task is to find a reasonable heat-pipe-based heat dissipation structure to ensure good contact between cells and heat pipes. The BTMS using conventional heat pipes have been reported in many ref. 23–25. Besides, a series of new-type heat pipes were also successfully used in BTMSs. For instance, Hong et al. introduced three 1.5 mm-thick ultra-thin aluminium heat pipes to make the BTMS.26 Moreover, pulsating heat pipes and loops heat pipes also attract the attention of researchers.27–29
Using PCMs also show excellent performances of BTMSs, which are able to significantly control the temperature rise and improve the temperature uniformity. It has been proven that the PCM is a promising alternative to conventional solutions. Al-Hallaj et al. originally validated the use of pure phase-change materials like paraffin wax for a BTMS.30 However, due to the low thermal conductivity, pure PCMs cannot fully meet the cooling demands of a BTMS. To this end, many researchers proposed different solutions such as adding metal powders,31 carbon fibers,32 graphite33–36 and foam metals37–42 to form a composite PCM so as to improve its thermal conductivity. Besides, some studies tried to use a metal with low melting point43 and water evaporation44 for a BTMS, achieving higher battery performances.
Although many types of BTMSs have been developed to gain good performances in temperature control, there are still evident drawbacks for each method. For example, the mutual problem of air-cooling and fluid-cooling cannot avoid using extra energy provided by an external device so that the weight of the balance-of-plant (BOP) system must be increased. As for heat-pipe-based methods, though it helps significantly reduce the maximum temperature as well as improve the temperature uniformity, it still needs power consumption and extra space in the cooling ends. The cooling design based on PCMs must deal with the issues of complex structure and overweight. Moreover, when the phase-change process ends, the available latent heat runs out so that the temperature cannot be controlled anymore. This is more likely to cause failure of the BTMS.
Phase change from liquid to gas has more potential to be used to control the temperature of a battery pack. Ren et al. presented a method using a sodium alginate (SA) film for evaporative cooling. This helped control the temperature rise of the battery body, which had the advantages of low cost and simple structure.44 Zhao et al. invented a BTMS incorporating flexible hydrogel films. They tested the BTMS through high-intensity discharging operation and abnormal heat release processes, validating an economic and efficient approach in mitigating the thermal surge of LIBs.45
The SA film has low cost, strong water adsorbing capacity, simple and controllable manufacturing process, which can be flexibly packed to accommodate any shapes of battery packs. Although the use of SA films has many advantages, it is relatively fragile and easy to break. Particularly, it is hard for the BTMS with such films to manage the water vapor and effectively control the battery temperature during high-rate charging and discharging when the film loses water. With the above background, this study aims at designing a BTMS using water evaporation (WE) coupled with air-cooling (AC) for a tube–shell LIB pack. The composite SA film has high strength and water storage ability by adding reinforcing polyethylene (PE) fibers. The method of combining WE with AC can effectively control the battery temperature rise under the condition of high-rate charging and discharging. The air-duct is designed to prevent the water vapor entering into the battery pack, avoiding short-circuit effect during the regular operation. Due to water loss of the evaporation film, an automatic water supply device is designed. Simulation results of the BTMS operation process are also provided in this work. Due to the high latent heat of water during phase change, our design shows an excellent performance in terms of heat dissipation. Thus, it has great potential to be used for battery thermal management. Besides, the new BTMS can be also used for stationary or mobile battery packs (e.g. EVs or energy storage station) that call for an efficient, accessible, and power-saving cooling system to suppress the unexpected thermal shock or runaway under normal and extreme conditions.
2. Experimental
2.1 Preparation of composite evaporation film
In this work, 1.2 g SA powders and 0.1 g PE fibers were added into 150 mL water, stirred with a magnetic stirrer for 1 h and then left standing until bubbles in the liquid were completely removed. This helped form a homogeneous mixture that was poured into an acrylic sink until the liquid spread evenly to form a thin liquid layer. After this, 1 g CaCl2 powders were mixed into 100 mL water. The cotton net was put into the acrylic sink, which was completely infiltrated by the mixture. Afterward, the CaCl2 solution was uniformly sprayed on the mixed liquid, and after standing, a high-moisture evaporation film with reinforced fibers and cotton net was prepared. The preparation process is shown in Fig. 1. Owing to the use of PE fibers, the SA film was strengthened to gain a higher quality. The microscopic view of the SA film is shown in Fig. 2c. We can see that the uniformly distributed PE fibers in the film act as reinforcing frames, which significantly enhance the strength of the film to maintain its own shape, making it less susceptible to structural destroy during continuous operation. In addition, the PE-fiber composite sodium alginate (PECSA) film would become thinner due to water loss caused by evaporation. Therefore, a cotton net was embedded into the film with one end connected to a water supply tank forming an automatic-refilling water system. This helps to replenish the evaporated water.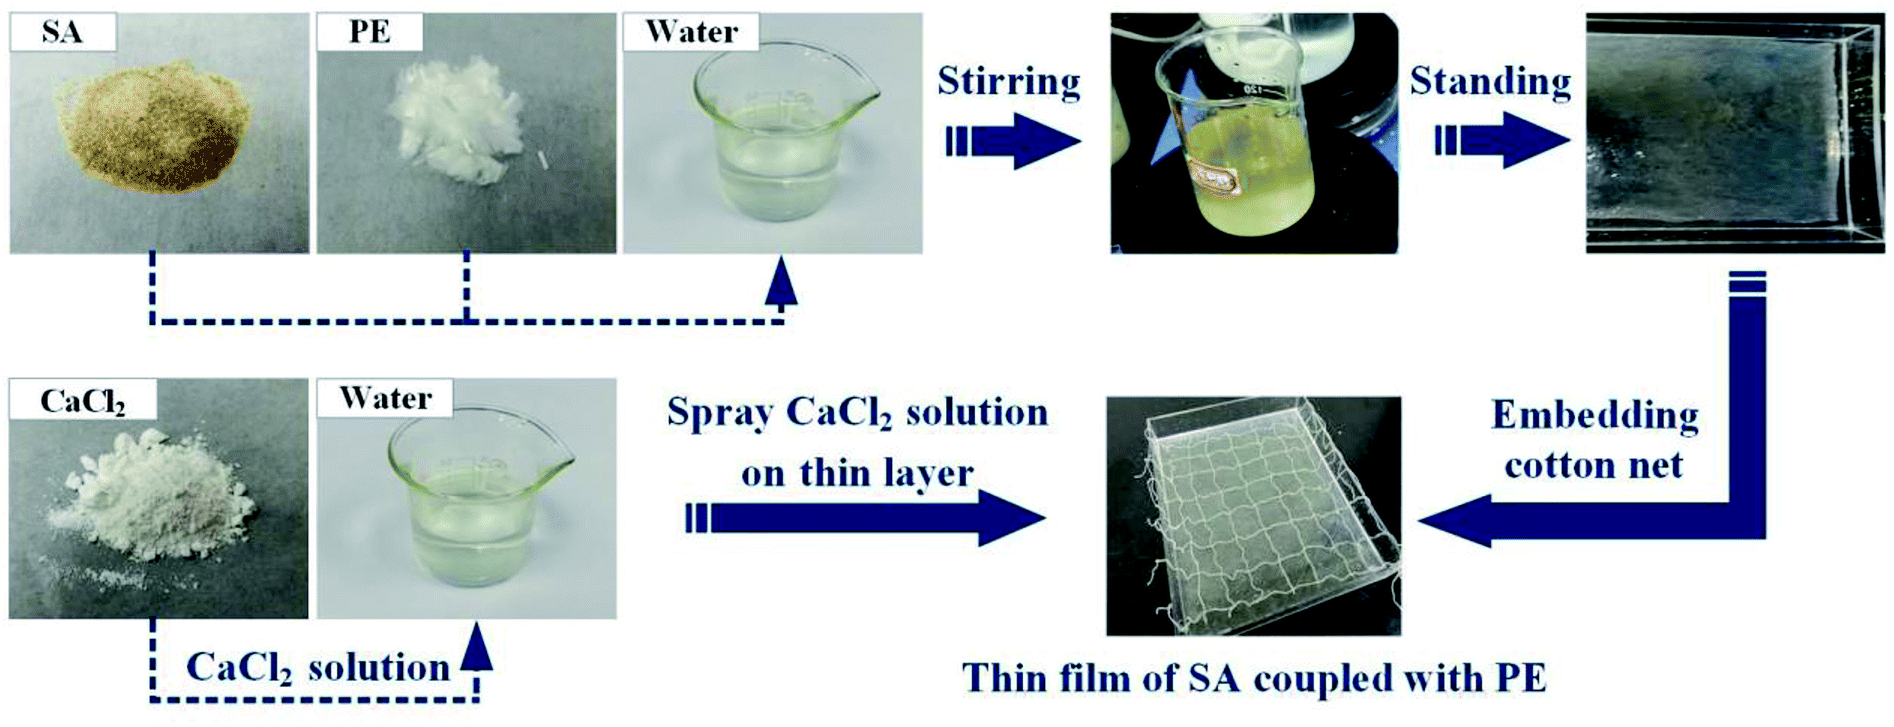 | ||
| Fig. 1 The preparation process of PECSA film. | ||
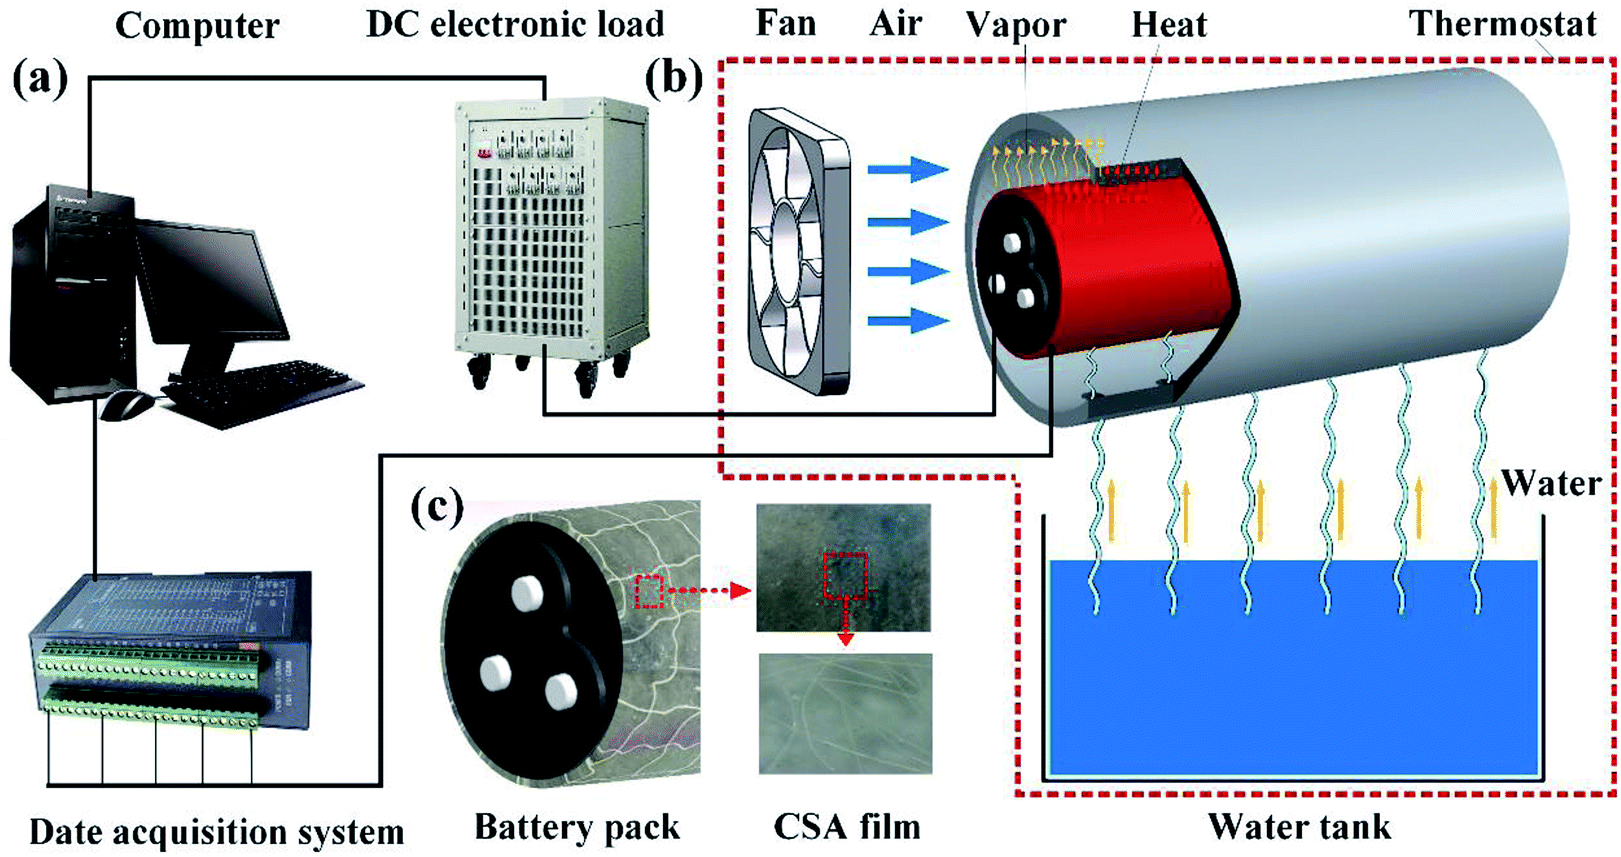 | ||
| Fig. 2 Schematic diagram of experimental devices: (a) data acquisition and processing; (b) battery structure; (c) microscopic view of the PECSA film. | ||
2.2 Battery pack structure
As shown in Fig. 2, the battery used in this experiment was 3S3P battery pack (three cells in series and three cells in parallel) which consisted of nine 18650 batteries. The voltage of this battery pack was 12.6 V, and its capacity was 6600 mA h. The basic parameters of the battery pack are listed in Table 1. For the convenience of testing, the battery pack was mounted in a cylindrical aluminium tube. The gap between the battery pack and the cylindrical aluminium tube was filled with graphite to reduce the thermal resistance and facilitate the heat conduction from the battery pack to the surface of aluminium tube.| Parameters | Voltage (V) | Capacity (A h) | Maximum discharge rate | Maximum charge rate | Total weight of battery pack (g) |
|---|---|---|---|---|---|
| Value | 12.6 | 6.6 | 5C | 1C | 401.4 |
The as-prepared PECSA film was attached onto the surface of the cylindrical aluminium shell. The cylindrical battery pack with an aluminium shell was then mounted in an air duct using the supporting frame. A cooling fan was placed at one end of the air duct, while the other end was used as the air outlet. The lines (battery power cord and device test line) were extracted from the reserved position, and the entire test device was placed in an incubator. During the battery operation (charge or discharge), heat accumulation must lead to a temperature rise. As a result, the film will be heated, and the water in the film will change into vapor. Under the effect of heat dissipation by water phase change, the battery temperature can be effectively controlled. Besides, if necessary, ethanol, etc. can be added into water to prevent the film from icing at a sub-zero temperature.
2.3 Experimental equipment
A commercial programmable DC electronic load (Merino's M973) with a maximum discharge voltage of 150 V and a current of 150 A was used to operate the battery module. The battery was tested at the discharge rate of 1C, 1.5C and 1.8C. Temperature test lines combined with K-type thermocouples with an accuracy error of ±0.2 °C were used for temperature record, which were connected with a data acquisition card (Advantech). Besides, a thermostat was applied to simulate the constant ambient temperature of 26 °C. During the temperature test, the recorded data were sent to the computer at a frequency of 1 s−1.The testing setup and with it a sectional schematic view of the heat conduction and dissipation processes are shown in Fig. 2. The heat transfer route within this model can be divided into the following three processes. Firstly, the generated heat inside the batteries transfers mainly through the direct contact between the battery pack and the filled graphite. Subsequently, heat is mainly carried from the graphite with a high thermal conductivity to the aluminium tube surface. Finally, heat is removed by the PECSA film through water evaporation. When the battery discharges at a high rate, the fan will be started to accelerate the water evaporation to take away residual heat.
2.4 Layout of temperature measurement point
As shown in Fig. 3, thermocouples were attached on the surface of each cell, and the temperature measurement points on each cell were denoted as A1–A3, B1–B3 and C1–C3, respectively. The characteristics of temperature distribution of the battery pack at a discharge rate of 1.5C under the condition of natural convection is shown in Fig. 4. Judging from Fig. 3 and 4, the following conclusions can be made: (a) the temperatures of the three side-by-side cells were almost the same; (b) the temperatures increased progressively in the axial direction, whose values in the part 1–3 were different. Therefore, in the following experiments, we took a random point in the part 1–3 to evaluate the temperature of each part to simplify data collection and processing. All the tests were repeated for three times and the average value was taken for comparison. Then, we took the average temperature of the three parts as the temperature of the battery pack to compare different cooling methods.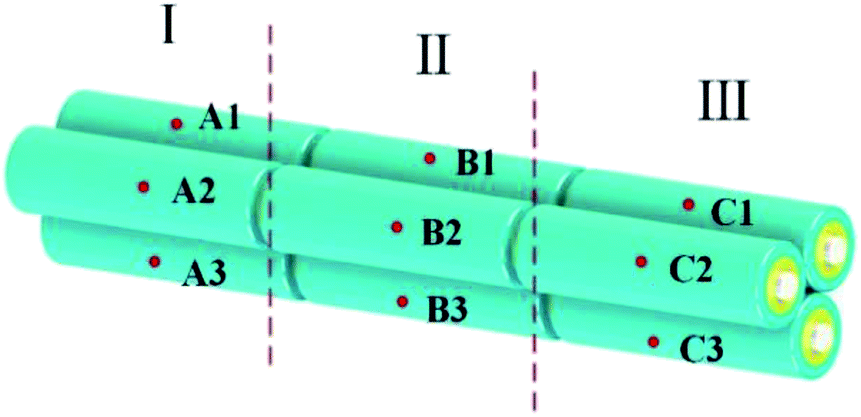 | ||
| Fig. 3 Distribution of collection points on battery packs. | ||
 | ||
| Fig. 4 Battery temperature of different collection points at discharge rate of 1.5C. | ||
3. Modelling and simulation
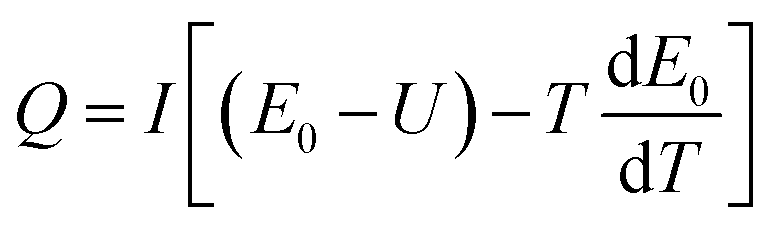
The internal heat of a battery is mainly composed of ohmic heat, electrochemical reaction heat, polarized heat and side-reaction heat.46 With the increase in the rate of charge and discharge of a battery, more heat will be generated. Bernardi et al. proposed the internal heat generation model as follows:47
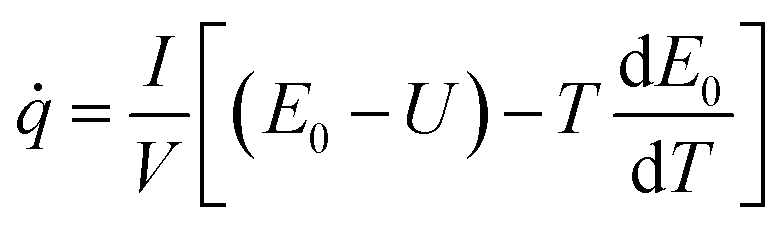 | (1) |
![[q with combining dot above]](https://www.rsc.org/images/entities/i_char_0071_0307.gif) is the heat generation rate per unit volume of the battery (W m−3); E0 is the open circuit voltage (V); U is the terminal voltage (V) of the battery; I is the current (A), V is the battery volume (m3); T is the thermodynamic temperature of the battery (K) and
is the heat generation rate per unit volume of the battery (W m−3); E0 is the open circuit voltage (V); U is the terminal voltage (V) of the battery; I is the current (A), V is the battery volume (m3); T is the thermodynamic temperature of the battery (K) and  is the temperature influence coefficient (V K−1).
From eqn (1) we can get the following formula:
 | (2) |
It is also known from ref. 48 that in a heat insulation device the heat loss can be neglected. The battery heat remains almost the same, and the heat generated by the battery per unit time can be calculated from the specific heat capacity of the battery and the temperature change rate:
 | (3) |
When the battery is in a thermal insulation environment, we know that Q′ = Q. Considering E0 − U = IR and combining eqn (2) we can conclude that:
 | (4) |
 | (5) |
The heat generation and heat transfer energy equation under the condition of natural convection can be expressed as follows:
 | (6) |
For cylindrical cells, the energy balance equation based on the law of heat transfer and heat distribution can be expressed as:49
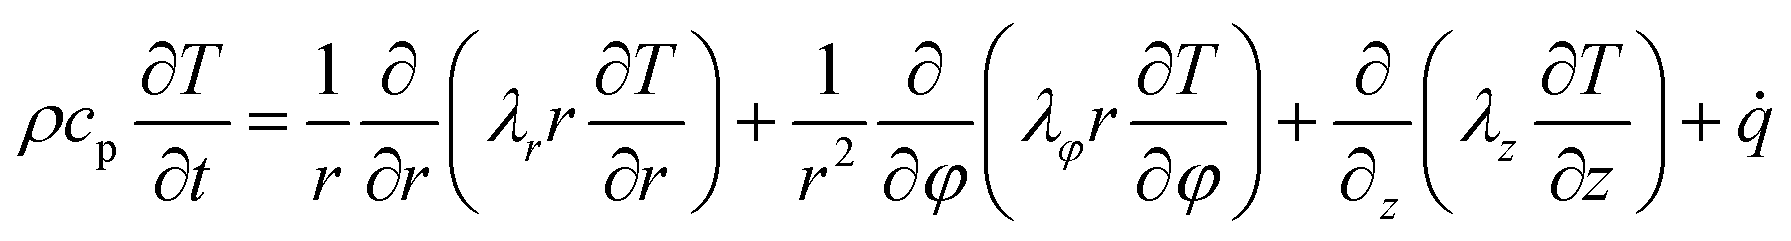 | (7) |
Moreover, in this study, the generated heat transfers from the inside of battery pack to the surface of aluminium shell, and the composed evaporation film is attached to the aluminium shell while the fan is installed at the inlet. The air flow accelerates evaporation and takes away a large amount of heat when the water phase changes. Water and air have complex heat and mass transfer mechanisms during the process of water evaporation. The general effect is water evaporating and then transforming into water vapor. As a result of water phase-change, a great deal of heat is absorbed, leading to a reduced temperature of the battery pack. At the same time, wet air is heated to increase the humidity and enthalpy.
The heat produced by water evaporation is:
| qevap = Lvgevap | (8) |
| gevap = K(csat − cv)Mv | (9) |
 | (10) |
The commercial software COMSOL was used for numerical analysis. In order to simplify the calculation, we made the following assumptions:
(a) Uniform distribution of materials inside the battery.
(b) Thermal physical parameters (specific heat capacity, thermal conductivity) of each material inside the battery were not affected by the outside and remained unchanged.
(c) The thermal conductivity of the material was consistent in the same direction.
(d) No convective heat transfer and thermal radiation inside the battery.
(e) The current density throughout the interior of the battery was the same.
The initial conditions of the model are: T(x,y,z,0) = T0 in which T0 is the initial battery temperature. The boundary conditions for model simulation were prescribed as:
(a) The surrounding temperature was 26 °C.
(b) The normal pressure gradient of the surface was set to zero, i.e.
(c) Under insulation conditions, the wall heat flux density was zero.
(d) No reflection condition on the surface.
(e) The initial relative humidity was 0.2 and the evaporation rate was 1.
4. Results and discussion
4.1 Comparison of experiment and simulation of battery temperatures
The internal resistance of the battery pack measured by direct current internal resistance method under 50% state of charge (SOC) was 0.1439 Ω, the mass of a single cell was 44.6 g, and the total mass of the battery was 0.4014 kg. The battery was discharged at 0.5C, 1C, 1.2C, 1.5C and 1.8C for 1000 s, respectively. After the temperature data were processed by the least square method, the temperature curves at different discharge rates were obtained, as shown in Fig. 5a. The slope of each straight line, can be calculated from the above fitting straight line, and the slope value of each line is shown in Table 2, from which the relation between
  and I can be easily obtained, as shown in Fig. 5b.
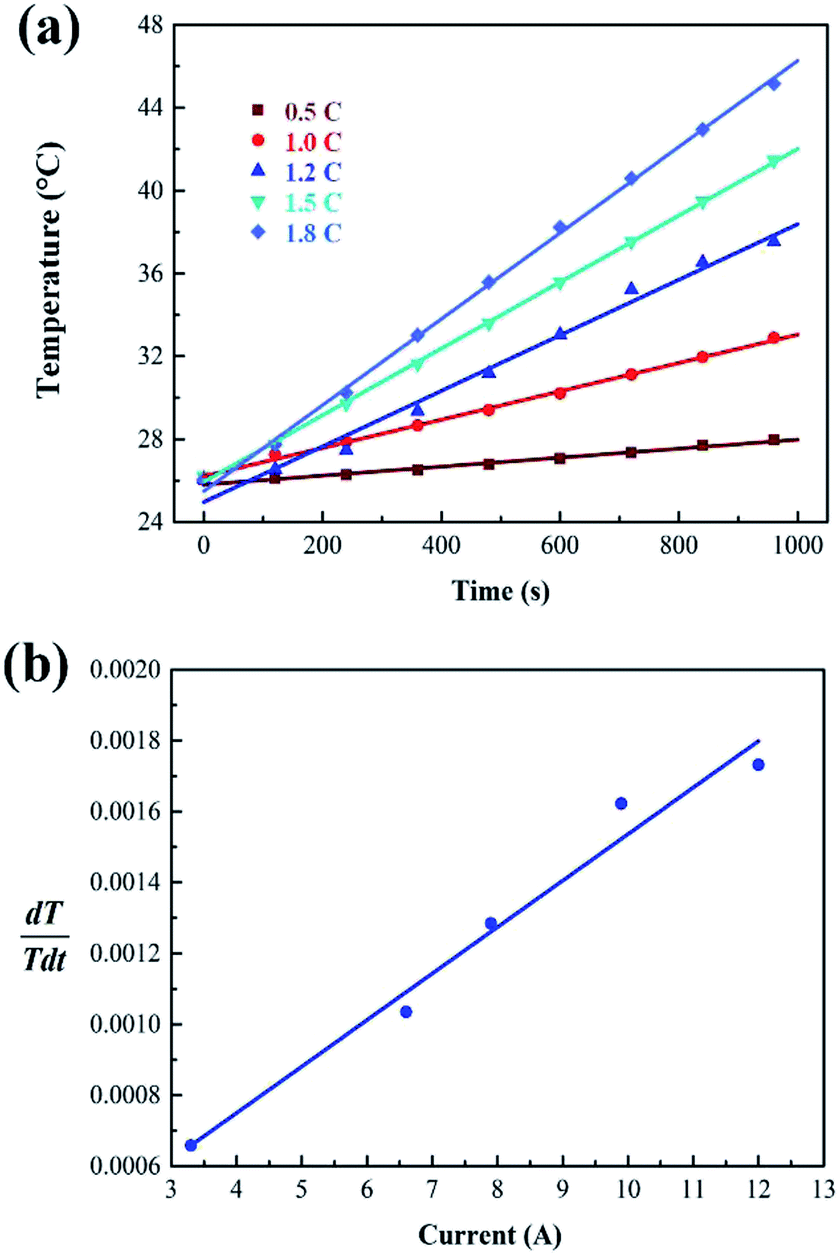 | ||
Fig. 5 Curve fitting of (a) average temperature for battery pack at different currents and (b) relationship between  and I. and I. | ||
| 1 | 2 | 3 | 4 | 5 | |
|---|---|---|---|---|---|
| Discharge rate (C) | 0.5 | 1.0 | 1.2 | 1.5 | 1.8 |
| I (A) | 3.3 | 6.6 | 7.9 | 9.9 | 12 |
| Slope value of each line | 0.000658 | 0.00103 | 0.00149 | 0.00162 | 0.00173 |
The expression of the fitting line in Fig. 5b is:
 | (11) |
Compared with eqn (4), we can get the following formula:
| Equivalent specific heat capacity: cp = 2735.4 J (kg K)−1 |
| Heating power: Q = 0.1439I2 − 0.2477I |
Now we can know that the heat power is 4.633 and 11.65 W respectively at 1C and 1.5C.
Fig. 6 compares the results of numerical simulation with the experimental data at a discharge rate of 1C and 1.5C when WE is coupled with 3 m s−1 air flow. It is known that in the discharge process, the numerical result is in good agreement with the real test. Although, in the cooling period there are some deviations among them, the experimental values are smaller than the numerical results. Besides, the experimental data is more vibrational. Such deviations can be explained by the fact that the air-cooling speed is inevitably fluctuant so as to affect the evaporation process.
 | ||
| Fig. 6 Comparison between experiment and simulation at 1C and 1.5C when WE is used with AC at an air flow rate of 3 m s−1. | ||
Fig. 7 shows the temperature contours and air velocity profiles of the battery pack at a discharge rate of 1C and 1.5C, respectively. As can be seen, the highest temperature of WE coupled with AC at 1C and 1.5C is 300.8 and 305 K (27.3 and 31.5 °C), respectively. It can be seen from the temperature contours that the temperature increases progressively in the axial direction, and the core temperature is significantly higher than the surface temperature of the battery. This is because the air velocity and evaporation rate of water at the inlet are higher than the outlet.
 | ||
| Fig. 7 Distribution of temperature and flow velocity: (a) temperature contours at 1C; (b) temperature contours at 1.5C; (c) and (d) diagrams of 3 m s−1 flow field. | ||
4.2 Temperature rise under different cooling conditions
The temperature curves of the battery pack measured under different cooling conditions are shown in Fig. 8 and 9. The value of Tmax of the battery pack using natural convection, AC, WE and WE coupled with AC is 36.3, 33.4, 30.7 and 27.1 °C, respectively, at a discharge rate of 1C. The value of temperature rise under different cooling conditions at 1C is 10.3, 7.4, 4.7 and 1.1 °C, respectively. It is noted that the cooling effect of the BTMS based on the combination of WE and AC is most effective compared with the other three cases. A similar tendency is observed at 1.5C and 1.8C (see Fig. 8b and 9a). When the battery discharges at a higher rate, the excellent performance of WE coupled with AC becomes more obvious. As displayed in Fig. 9a, it is only 1000 s after the battery discharges at 1.8C, in the case of natural convection, the value of Tmax of the battery module approaches 47 °C. It is evident that the temperature of the battery module must exceed the suitable operation range (<60 °C) with the increase of discharge time. However, when the design of WE coupled with AC is used, the temperature is controlled below 32 °C, and the slope of the temperature curve is much lower than the other three cases. This can be ascribed to the following reasons. On one hand, the phase change from water to gas retains a large amount of latent heat, and the process of water evaporation effectively takes away the produced heat from the battery pack. On the other hand, under the effect of air flow, water vaporizes more rapidly, which can remove more heat than the use of either individual WE or AC.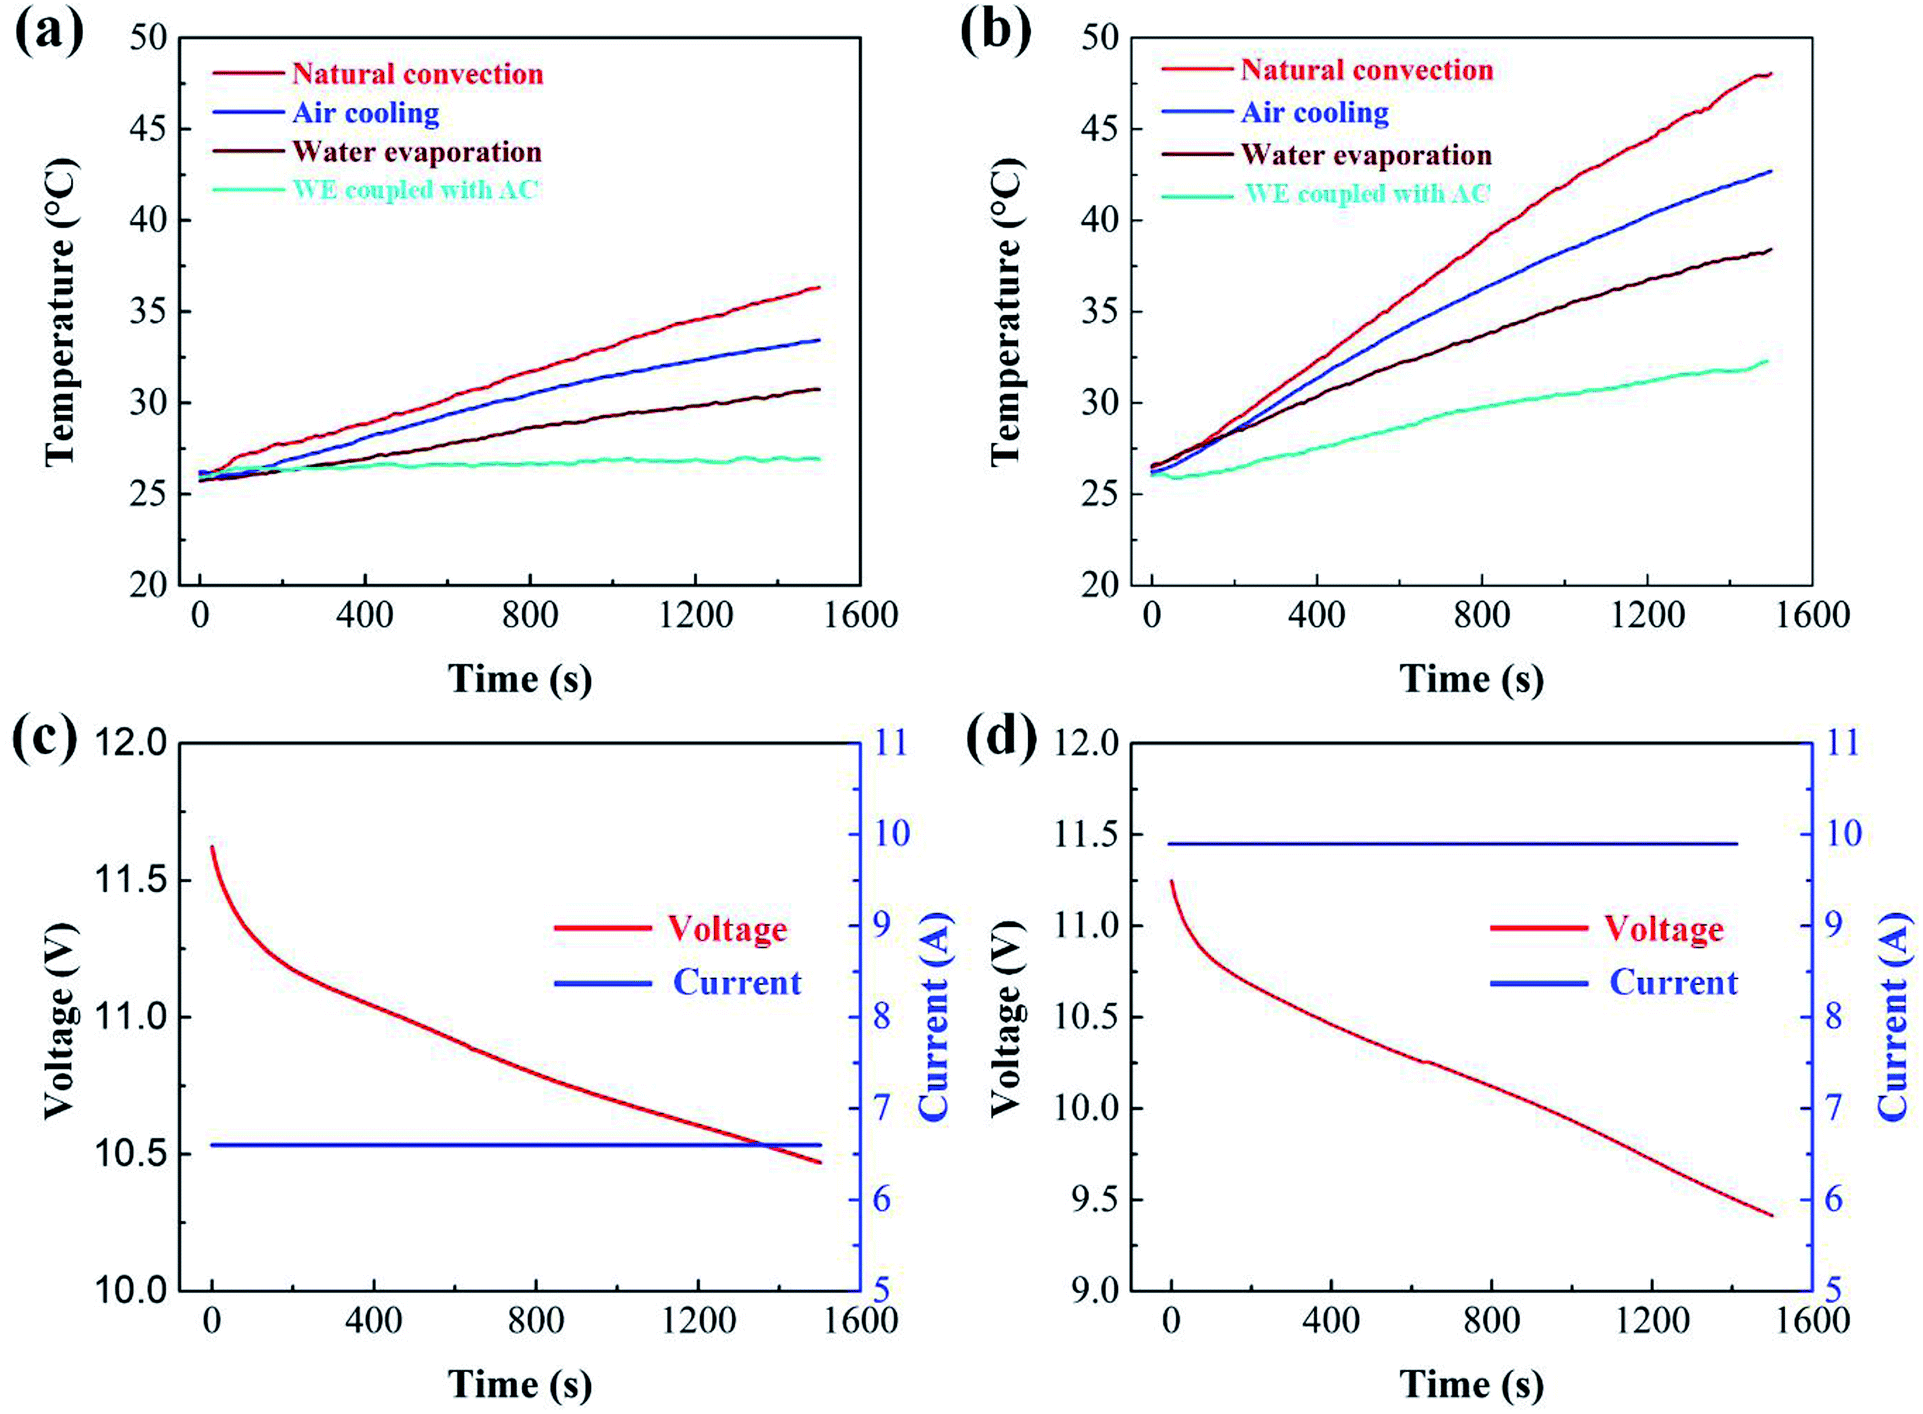 | ||
| Fig. 8 Temperature of battery on discharge rite of 1C and 1.5C. | ||
 | ||
| Fig. 9 Temperature of battery on discharge rite of 1.8C and CV + CC. | ||
Fig. 8c, d and 9c show the curves of current and voltage. It can be seen that, under the condition of constant-current discharge, the voltage decreases sharply in the initial stage. Besides, with the same discharge time, a higher discharge current leads to a higher voltage drop. We also tried to evaluate the temperature rise of the battery in the conversion process of constant-current and -voltage discharge in this experiment. The battery was discharged at a constant voltage of 10.5 V for 500 s and then a constant current of 1.5C for 500 s. The temperature curve is shown in Fig. 9b, and the curves of current and voltage is displayed in Fig. 9d.
To further verify the cooling effect of WE coupled with AC, the values of temperature rise at different discharge rates and cooling conditions are illustrated in Fig. 10. It is notable that, within the discharge time of 1000 s, this design yields the lowest temperature rise. Besides, with the increase of discharge rate, the value of temperature rise in the case of WE coupled with AC is less obvious than the other three cases. This can be interpreted by the fact that the use of WE is able to effectively take away the heat throughout the whole discharge process. The evaporation process tends to cause water loss of the PECSA film. In order to suppress the temperature rise by 10 °C, 11.2 kJ heat needs to be taken away. In the form of water evaporation with a latent heat of 2400 kJ kg−1, the required mass of water is 0.005 kg. However, more mass of the other phase-change materials such as paraffin with a latent heat of 220 kJ kg−1 should be used to achieve the same goal.44
 | ||
| Fig. 10 Temperature rise of different discharge rate within the discharge time of 1000 s. | ||
4.3 Comparison of time consumption for the same temperature rise under different cooling conditions
As shown in Fig. 11, the consumed time for the same temperature rise relates directly to the performance of different cooling measures. At 1.5C, the time required for the battery temperature rise from 26 to 32.1 °C in the case of natural convection, AC, WE and WE with AC is 380, 460, 590 and 1490 s, respectively. It can be seen that WE coupled with AC can significantly reduce the rate of temperature rise of the battery and control the temperature within a suitable range. Besides, the use of WE coupled with AC is more able to reduce heat at high charge/discharge rates or under other extreme operating conditions.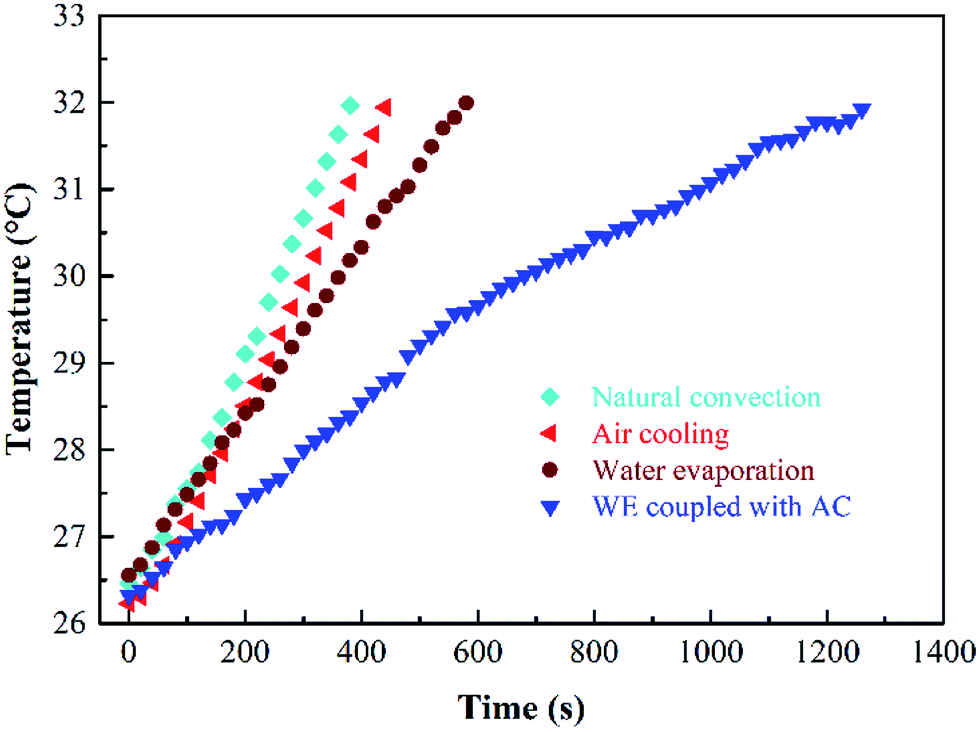 | ||
| Fig. 11 Diagram of time consumed under the condition of the same temperature rise. | ||
When the PECSA film is attached onto the surface of the battery pack, the evaporation effect causes water loss so that the PECSA film will get dehydrated during operation. When an automatic refilling system is used, the issue of film drought will be well addressed. The water can be continuously supplied, realizing high effectiveness and excellent performance of the PECSA film is very thin with no need for large space and the air flow of the fan can be optimized to reduce the occupied space. Since the latent heat is about 2400 kJ kg−1 for water evaporation, the BTMS has enough ability to control the temperature. In BTMS with WE coupled with AC. Besides, it is noted that the addition, if necessary, a vapor recovery unit can be introduced to reduce the water consumption.
5. Conclusions
In this study, a tube–shell battery pack based on a novel BTMS with the combination of WE and AC is developed, and its performances are evaluated by experiments and numerical simulation. An automatic refilling system is designed to solve the drying problem of the PECSA film. The PECSA film is strengthened to gain a good quality as a result of adding polyethylene fibers. Besides, a reasonable structure is designed to prevent the generated water vapor from getting into the battery pack so as to reduce the risk of battery short circuit. The effectiveness of WE coupled with AC in controlling the temperature rise at 1C, 1.5C and 1.8C is validated. By using this method, the temperature is controlled below 32 °C at 1.8C within the discharge time of 1000 s. Based on the experimental and simulation results, we can find that the cooling effect of the BTMS based on WE with AC is most effective compared with the other three cases.In addition to the high effectiveness of the BTMS based on WE and AC, the proposed system also has the advantages of low energy consumption, simple structure and low cost. Besides, a self-heating or assistant-heating from an external heat source can be applied to provide the function of preheating when the battery operates at a lower temperature. We believe that the BTMS has great application prospects to be used for thermal management of the batteries for electric vehicles.
Conflicts of interest
There are no conflicts to declare.Nomenclature
| AC | Air cooling |
| BTMS | Battery thermal management system |
| cp | Specific heat capacity (J (kg K) −1) |
| csat | Saturated vapor concentration (g cm−3) |
| cv | Vapor concentration (g cm−3) |
| E0 | Open circuit voltage (V) |
| EVs | Electric vehicles |
| gevap | Evaporation flux (kg m−2 s−1) |
| I | Current (A) |
| K | Effective thermal conductivity (W m−1 K−1) |
| K | Evaporation rate (−) |
| LIB | Li-ion battery |
| Lv | Latent heat of water evaporation (J kg−1) |
| m | Mass (kg) |
| Mv | Molar mass of water vapor (g mol−1) |
| PCMs | Phase-change materials |
| PE | polyethylene |
| PECSA | PE-fibers composite sodium alginate |
| psat | Saturated vapor pressure (kPa) |
| Q | Battery heat power (W) |
| Q′ | Calorific value per unit time (J s−1) |
| Q | Heat generation rate per unit volume (W m−3) |
| Rg | Gas constant (J (k mol)−1) |
| SA | Sodium alginate |
| SOC | State of charge |
| T | Thermodynamic temperature (K) |
| T0 | Initial battery temperature (°C) |
| Tmax | The maximum temperature (°C) |
| U | Terminal voltage (V) |
| V | Volume (m3) |
| WE | Water evaporation |
| λr | Thermal conductivity in r-direction (W m−1 K−1) |
| λz | Thermal conductivity in z-direction (W m−1 K−1) |
| λφ | Thermal conductivity in φ-direction (W m−1 K−1) |
| ρ | Density (kg m−3) |
Acknowledgements
This work is financially supported by National Natural Science Foundation of China (No. 51722504), Natural Science Foundation of Guangdong Province (No. 2015A030306013), Fundamental Research Funds for the Central Universities (No. 2018ZD31), Science and Technology Plan of Guangdong Province (2017KZ010105 and 2017B090901012), and Special Support Plan of Guangdong Province (No. 2017TX04X141).References
- Z. Wang, X. Li, G. Zhang, Y. Lv, J. He, J. Luo, C. Yang and C. Yang, RSC Adv., 2017, 44, 27441–27448 RSC.
- A. A. Franco, RSC Adv., 2013, 3(32), 13027–13058 RSC.
- J. R. Selman, S. Al Hallaj, I. Uchida and Y. Hirano, J. Power Sources, 2001, 97, 726–732 CrossRef.
- R. E. Williford, V. V. Viswanathan and J. G. Zhang, J. Power Sources, 2009, 189(1), 101–107 CrossRef CAS.
- Y. Saito, J. Power Sources, 2005, 146(1–2), 770–774 CrossRef CAS.
- A. Väyrynen and J. Salminen, J. Chem. Thermodyn., 2012, 46, 80–85 CrossRef.
- A. Pesaran and G. K. Santhanagopalan, Addressing the impact of temperature extremes on large format Li-ion batteries for vehicle applications, in 30th int batter semin, 2013 Search PubMed.
- C. G. Motloch, J. P. Christophersen, J. R. Belt, R. B Wright, G. L. Hunt, R. A. Sutula and T. J. Miller, SAE Technical Paper, DOI:10.4271/2002-01-1950.
- X. Feng, M. Ouyang, X. Liu, L. Lu, Y. Xia and X. He, Energy Storage Materials, 2018, 10, 246–267 CrossRef.
- N. Yang, X. Zhang, G. Li and D. Hua, Appl. Therm. Eng., 2015, 80, 55–65 CrossRef CAS.
- X. M. Xu and R. He, J. Power Sources, 2013, 240, 33–41 CrossRef CAS.
- K. Chen, S. Wang, M. Song and L. Chen, Int. J. Heat Mass Transfer, 2017, 111, 943–952 CrossRef.
- Z. Liu, Y. Wang, J. Zhang and Z. Liu, Appl. Therm. Eng., 2014, 66(1–2), 445–452 CrossRef.
- L. Fan, J. M. Khodadadi and A. A. Pesaran, J. Power Sources, 2013, 238, 301–312 CrossRef CAS.
- F. He and L. Ma, Int. J. Heat Mass Transfer, 2015, 83, 164–172 CrossRef.
- Z. Rao, Z. Qian, Y. Kuang and Y. Li, Appl. Therm. Eng., 2017, 123, 1514–1522 CrossRef.
- Y. Huo, Z. Rao, X. Liu and J. Zhao, Energy Convers. Manage., 2015, 89, 387–395 CrossRef.
- Z. Qian, Y. Li and Z. Rao, Energy Convers. Manage., 2016, 126, 622–631 CrossRef CAS.
- S. Panchal, R. Khasow, I. Dincer, M. Agelin-Chaab, R. Fraser and M. Fowler, Appl. Therm. Eng., 2017, 122, 80–90 CrossRef CAS.
- J. Zhao, Z. Rao and Y. Li, Energy Convers. Manage., 2015, 103, 157–165 CrossRef CAS.
- Z. An, L. Jia, X. Li and Y. Ding, Appl. Therm. Eng., 2017, 117, 534–543 CrossRef CAS.
- J. Liang, Y. Gan and Y. Li, Energy Convers. Manage., 2018, 155, 1–9 CrossRef.
- A. Greco, D. Cao, X. Jiang and H. Yang, J. Power Sources, 2014, 257, 344–355 CrossRef CAS.
- K. Shah, C. McKee, D. Chalise and A. Jain, Energy, 2016, 113, 852–860 CrossRef CAS.
- W. Wu, X. Yang, G. Zhang, K. Chen and S. Wang, Energy Convers. Manage., 2017, 138, 486–492 CrossRef.
- S. Hong, X. Zhang, S. Wang and Z. Zhang, Energy Procedia, 2015, 75, 3192–3200 CrossRef.
- S. Hong, X. Zhang, S. Wang and Z. Zhang, Int. J. Therm. Sci., 2015, 95, 106–114 CrossRef.
- N. Putra, B. Ariantara and R. A. Pamungkas, Appl. Therm. Eng., 2016, 99, 784–789 CrossRef.
- Z. Rao, Y. Huo and X. Liu, Exp. Therm. Fluid Sci., 20145, 7, 20–26 Search PubMed.
- S. Al Hallaj and J. R. Selman, J. Electrochem. Soc., 2000, 147(9), 3231–3236 CrossRef.
- G. Karimi, M. Azizi and A. Babapoor, Journal of Energy Storage, 2016, 8, 168–174 CrossRef.
- A. Babapoor, M. Azizi and G. Karimi, Appl. Therm. Eng., 2015, 82, 281–290 CrossRef CAS.
- B. Mortazavi, H. Yang, F. Mohebbi, G. Cuniberti and T. Rabczuk, Appl. Energy, 2017, 202, 323–334 CrossRef CAS.
- G. Jiang, J. Huang, Y. Fu, M. Cao and M. Liu, Appl. Therm. Eng., 2016, 108, 1119–1125 CrossRef CAS.
- G. Jiang, J. Huang, M. Liu and M. Cao, Appl. Therm. Eng., 2017, 120, 1–9 CrossRef CAS.
- Y. Lv, X. Yang, X. Li, G. Zhang, Z. Wang and C. Yang, Appl. Energy, 2016, 178, 376–382 CrossRef CAS.
- A. Hussain, C. Y. Tso and C. Y. Chao, Energy, 2016, 115, 209–218 CrossRef CAS.
- W. Wu, X. Yang, G. Zhang, X. Ke, Z. Wang, W. Situ and J. Zhang, Energy, 2016, 113, 909–916 CrossRef CAS.
- Z. Rao, Y. Huo, X. Liu and G. Zhang, J. Energy Inst., 2015, 88(3), 241–246 CrossRef CAS.
- S. Shi, Y. Xie, M. Li, Y. Yuan, J. Yu, H. Wu and N. Liu, Energy Convers. Manage., 2017, 138, 84–96 CrossRef.
- M. Alipanah and X. Li, Int. J. Heat Mass Transfer, 2016, 102, 1159–1168 CrossRef CAS.
- A. Lazrak, J. F. Fourmigué and J. F. Robin, Appl. Therm. Eng., 2018, 128, 20–32 CrossRef.
- L. W. Fan, Y. Y. Wu, Y. Q. Xiao, Y. Zeng, Y. L. Zhang and Z. T. Yu, Appl. Therm. Eng., 2016, 109, 746–750 CrossRef CAS.
- Y. Ren, Z. Yu and G. Song, J. Power Sources, 2017, 360, 166–171 CrossRef CAS.
- R. Zhao, S. Zhang, J. Gu, J. Liu, S. Carkner and E. Lanoue, J. Power Sources, 2014, 255, 29–36 CrossRef CAS.
- H. P. Lin, D. Chua, M. Salomon, H. C. Shiao, M. Hendrickson, E. Plichta and S. Slane, Electrochem. Solid-State Lett., 2001, 4(6), A71–A73 CrossRef CAS.
- D. Bernardi, E. Pawlikowski and J. Newman, J. Electrochem. Soc., 1985, 132(1), 5–12 CrossRef CAS.
- Y. Chen and J. W. Evans, J. Electrochem. Soc., 1996, 143(9), 2708–2712 CrossRef CAS.
- S. C. Chen, C. C. Wan and Y. Y. Wang, J. Power Sources, 2005, 140(1), 111–124 CrossRef CAS.
- https://cn.comsol.com/model/evaporative-cooling-of-water-6192.
| This journal is © The Royal Society of Chemistry 2019 |