 Open Access Article
The effect of foam quality, particle concentration and flow rate on nanoparticle-stabilized CO2 mobility control foams
Chunkai Fua,
Jianjia Yub and
Ning Liu *a
*a
aDepartment of Petroleum Engineering, University of Louisiana at Lafayette, Lafayette, LA, USA 70503. E-mail: ning.liu@louisiana.edu
bPetroleum Recovery Research Center, New Mexico Institute of Mining and Technology, 801 Leroy Place, Socorro, NM, USA 87801
First published on 21st March 2019
Abstract
CO2 foam is regarded as a promising technology and widely used in the oil and gas industry, not only to improve oil production, but also to mitigate carbon emissions through their capture. This paper describes a series of nanoparticle-stabilized CO2 foam generation and foam flow experiments under reservoir conditions. Stable CO2 foam was generated when CO2 and a nanosilica dispersion flowed through the core sample under 1500 psi and 25 °C. The foam changed from a fine-texture foam to a coarse foam as the foam quality increased from 20% to 95%. Foam mobility increased slightly with the increasing foam quality from 20% to 80% and then rapidly from 80% to 95%. A stable CO2 foam was generated as the nanosilica concentration increased to 2500 ppm. Foam mobility and resistance factor increased with the increasing nanosilica concentration. As the injection flow rate increased to 60 ml h−1, stable and fine-texture CO2 foam was obtained. Foam mobility was observed to remain almost constant as the injection flow rate increased from 60 ml h−1 to 150 ml h−1.
1. Introduction
Carbon dioxide (CO2) injection is presently one of the most commonly used approaches in The Enhanced Oil Recovery (EOR) application. CO2 can be used either as an immiscible or a miscible displacing agent based on the reservoir conditions and the composition of crude oils. Injection of CO2 can benefit production by mobilizing more oil trapped in the pores of the reservoir rock. However, the lower viscosity of CO2 compared to crude oil induces an unfavorable mobility ratio. In addition, the heterogeneity of the reservoir formation results in an early breakthrough and a poor oil sweep efficiency.1–3 The use of surfactant is one way to rectify the drawbacks associated with CO2 flooding. It helps to reduce the viscosity difference between the displacing and displaced fluids by restricting the flow of CO2 through high permeability zones. Today, the major challenges for surfactant EOR are high surfactant retention in porous media and unstable foam properties under high-temperature reservoir conditions.4–6Recently, a new generation of CO2 foam using nanotechnology to create lasting foams has been studied, and this new technology has been attracting more and more attention due to the long-term stability of foams under harsh reservoir conditions. Dickson et al. first reported generating CO2 foam with nanosilica particles.7 Nanosilica particles were dispersed in water and then sheared through an orifice with supercritical CO2. CO2 foam was generated and observed through a view cell. They observed that foam stability increased with the increasing particle concentration, CO2 density, and shear rate. Later, Espinoza et al. proposed the generation of nanoparticle-stabilized supercritical CO2 foams (CO2 in water foam) for potential mobility control applications by using commercial surface-modified silica particles.8 The foams were generated by co-injecting CO2 and an aqueous dispersion of the nanoparticles through a glass-bead pack. They demonstrated that supercritical CO2 foams could be generated by nanoparticles with a concentration as low as 0.05 wt%. Andrew et al. conducted foam generation experiments focused on nanoparticles with different surface coatings and demonstrated that the larger size of 50% SiOH nanoparticles resulted in stronger stable CO2 foams compared to those generated with PEG-coated silica particles.9 Singh and Mohanty investigated the process of foam stabilized by in situ surface-activated nanoparticles in bulk and porous media.10 Alumina-coated silica nanoparticles were mixed with different concentrations of propyl gallate (PG) and the particle hydrophilic surface was converted to partially hydrophobic by anchoring PG molecular to the particle surface. They observed a strong foaming tendency with surface-modified nanoparticles (SMNPs). The bubble texture of foam stabilized by SMNPs was finer than that with surfactants. In the same time, some researchers studied the process of nanoparticles surface modification with surfactants.11,12 A synergic interaction between surfactant and nanoparticles was observed to generate stable foam. For example, Worthen et al.12 reported the generation of viscous and stable CO2 foams with fine texture by use of bare silica nanoparticles and zwitter-ionic surfactant, when neither of these species could stabilize foam independently. More recently, nanoparticle-stabilized CO2 foam flow behavior was studied by Prigiobbe et al.13 A two-phase flow mechanistic model combining the mass conservation law and the population balance equation was implemented to analyze the CO2 foam transport in porous media. Their results indicated that the two-phase flow model described well the experiments when a strong high-quality foam was generated.
Although some researches were performed on nanoparticle-stabilized CO2 foam generation, field tests with high pressure CO2 foam indicated that field application of CO2 foam was a technically viable process for improved oil recovery.14 An efficient evaluation of candidate reservoirs for possible CO2 foam application requires a fundamental understanding of information on CO2 foam behavior under various foam test conditions. In our previous studies, the effects of different ions and temperature on nanosilica-stabilized CO2 foam generation were studied.15 More CO2 foam was generated as the NaCl concentration increased from 1.0% to 10%. Also the foam texture became finer and foam stability improved with the NaCl concentration increase. In this paper, the effects of foam quality, particle concentration, and flow rate on nanoparticle-stabilized CO2 foam generation, foam texture, foam stability, and foam flow behavior in a porous medium were investigated.
2. Experimental
2.1 Materials
Silica nanoparticles were obtained from Akzo Nobel Pulp and Performance Chemicals Inc. as an aqueous dispersion and diluted with 2.0% NaCl to the desired concentration. Particle size and morphology were characterized by dynamic light scattering (DLS) and transmission electron microscopy (TEM). Berea sandstone core samples were purchased from Cleveland Quarries. The core was cut and polished to a diameter of 2.12 in. and a length of 8.3 in. Then the core was loaded into a core holder with an overburden pressure of 3500 psi. The initial brine permeability and the porosity of the core were measured as 33.0 mD and 17.4%, respectively. The pore volume (PV) of the core was calculated as 100.4 ml.2.2 Experiment devices
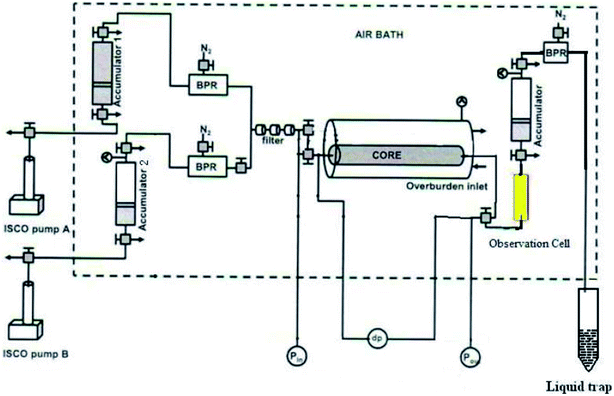
Fig. 1 shows the experimental apparatus for CO2 foam generation. First, CO2 and nanosilica dispersion were stored in two floating piston accumulators, respectively. Two TEMCO Back Pressure Regulators (BPR) were used to maintain the accumulator under required operating pressure. During the CO2 foam generation, two ISCO syringe pumps (model 260D) were used to inject distilled water into the CO2/nanosilica dispersion accumulators, forcing nanosilica dispersion and CO2 flow out from the accumulator under operating pressure. The injected high pressure CO2 and nanosilica dispersion were mixed in the core sample, providing the shear energy to drive the nanosilica particles to adsorb into the interface between CO2 and water. A sapphire observation cell was installed behind the core holder to estimate the foam morphology and bubble size. Pressure drop along the core was measured with a Honeywell 3000 differential pressure transducer connected to a Daq56 data acquisition system. After the observation cell, another accumulator was used to collect the CO2 and nanosilica mixture. The third BPR was installed after the accumulator to control the operation pressure in the core sample and observation cell. The entire apparatus, except for the syringe pumps, was placed in an air bath to maintain a constant temperature throughout the experiment.All the core-flooding tests were conducted at 25 °C and 1500 psi. To evaluate the effect of nanosilica on CO2 foam generation and mobility control, baseline experiments were first performed by simultaneously injecting CO2 and brine into the core at different volumetric injection ratios without nanosilica particles. Each baseline experiment lasted until a steady-state pressure drop was achieved.
2.3 Characterization
 | (1) |
 | (2) |
3. Results and discussions
3.1 CO2 foam generation in Berea sandstone core
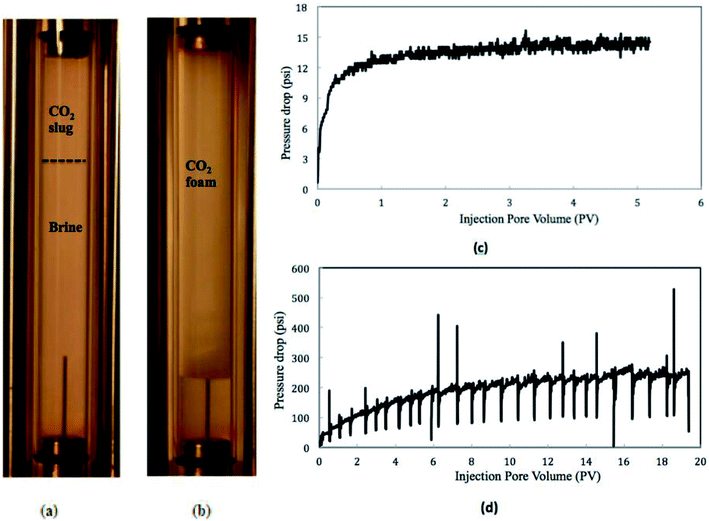
The diluted nanosilica dispersion (5000 ppm) had an average particle size around 17 nm as measured by DLS and TEM. Fig. 2 shows the CO2 foam images from the observation cell in the presence and absence of nanosilica particles (CO2![[thin space (1/6-em)]](https://www.rsc.org/images/entities/char_2009.gif) :
:![[thin space (1/6-em)]](https://www.rsc.org/images/entities/char_2009.gif) brine = 3
brine = 3![[thin space (1/6-em)]](https://www.rsc.org/images/entities/char_2009.gif) :
:![[thin space (1/6-em)]](https://www.rsc.org/images/entities/char_2009.gif) 2) and the pressure drops along the core. Due to the low viscosity of CO2 and high interfacial tension between CO2 and brine, no stable foam lamella was formed in the absence of nanoparticles. The generated CO2 bubbles were prone to collapse and merge into a CO2 slug (on the top of Fig. 2a). However, a large volume of CO2 foams with a small bubble size was formed as the CO2 and nanosilica dispersion flowed through the core. This suggests that when nanoparticles were introduced to the CO2/brine system, they were adsorbed at the interfaces between CO2 and brine, stabilizing the foam by mitigating processes such as coalescence and Ostwald ripening.13
2) and the pressure drops along the core. Due to the low viscosity of CO2 and high interfacial tension between CO2 and brine, no stable foam lamella was formed in the absence of nanoparticles. The generated CO2 bubbles were prone to collapse and merge into a CO2 slug (on the top of Fig. 2a). However, a large volume of CO2 foams with a small bubble size was formed as the CO2 and nanosilica dispersion flowed through the core. This suggests that when nanoparticles were introduced to the CO2/brine system, they were adsorbed at the interfaces between CO2 and brine, stabilizing the foam by mitigating processes such as coalescence and Ostwald ripening.13
Fig. 2 also displays the pressure drops along the core in CO2/brine and CO2/nanosilica dispersion core-flooding tests. In the CO2/nanosilica dispersion core flood test, nanosilica dispersion was diluted with 2.0% NaCl solution to the particle concentration of 5000 ppm. The results of the pressure drop along the core indicated that, as nanosilica was introduced, the pressure drop was much higher than that of in absence of nanosilica particles. The higher pressure drop in the presence of nanosilica implied that CO2 foam was generated in the core, resulting in a more “viscous” CO2 fluid. Here, it is necessary to emphasize that the core was flooded with brine after the test, and the core permeability was observed to be almost the same before and after the test, indicating no particle plugging during the test. On the other hand, Fig. 2c and d also show that much more injection volumes were required to reach the steady state in the CO2/nanosilica dispersion core flood test. For example, it took 8–10 PVs of CO2/nanosilica dispersion to reached the steady state in CO2/nanosilica dispersion core flood test, while it reached the pressure equilibrium as 1.5 PVs of CO2/brine were injected in CO2/brine core flood test. The requirement of high PV injection to reach steady state has also been observed by other researchers and currently is not well understood.16,17 The experiments of Ettinger17 suggested that the slow increases in pressure were caused by the propagation of a capillary end effect from the back of the core to the front of the core.
Further investigations of the foam stability is shown in Fig. 3, which displays the height of CO2 foam at different times after core-flooding. The inserted images in Fig. 3 show the foam pictures being observed in the observation cell in Fig. 1 with different standing times. The generated CO2 foam, when left at room temperature and 1500 psi, displayed very good stability. Less than one-third of the foams collapsed after standing at room temperature for five days. The half life-time, here is defined the time elapsed when the foam reaches its half of its initial height, was measured around 168 hours. Similarly, Martinez et al. also observed nine months lifetime for nanosilica-stabilized N2 foam.18 Worthen et al.12 and Binks et al.19 reported long-term stable CO2/air foams generated by nanoparticles.
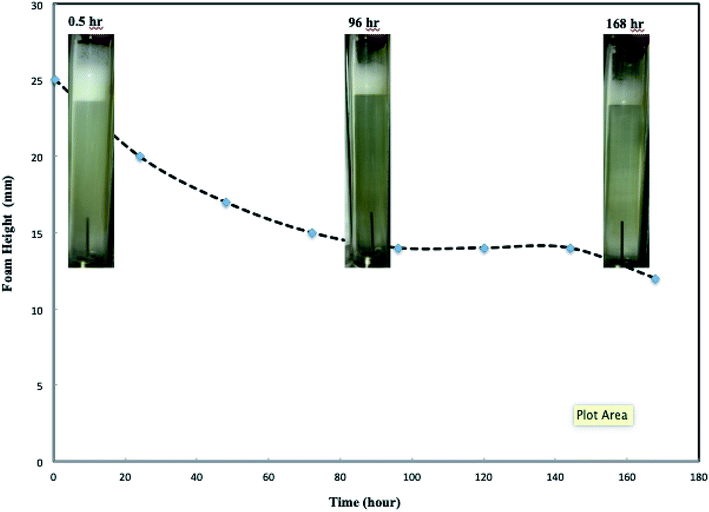 | ||
Fig. 3 CO2 foam images height change with standing time. (Total flow rate is 150 ml h−1, nanosilica concentration: 5000 ppm, and CO2/brine phase ratio is 3![[thin space (1/6-em)]](https://www.rsc.org/images/entities/char_2009.gif) : :![[thin space (1/6-em)]](https://www.rsc.org/images/entities/char_2009.gif) 2.) 2.) | ||
The long-term stability of nanoparticle-stabilized CO2 foam is attributed to the high adsorption energy of nanosilica particles at the CO2/brine interface. Horozov reported that particles in a foam existed at the interface in three ways: a monolayer bridge, a bilayer, and a gel inside the liquid lamellae. Binks proposed to estimate the adsorption energy of nanoparticles at nonaqueous/aqueous interface as20 ΔGad = πα2γow(1 − |cos![[thin space (1/6-em)]](https://www.rsc.org/images/entities/char_2009.gif) θ|)2, where α is the particle radius; γow is the interfacial tension, and θ is the contact angle through the aqueous phase. An estimation of the adsorption energy in this study with γCO2/brine = 25.15 mN m−1,21 θ = 75° is 763 kBT, which is much larger than the adsorption energy for a typical surfactant molecule at an oil–water interface (which is of the order of several kBT).8 This high adsorption energy favors irreversible adsorption of the nanoparticles to the CO2/brine interface and to the formation of solid-like surface layers. Together with the resistance of the interfaces to collapse, this prevents the CO2 bubbles from coarsening and coalescence,22 resulting in highly stable CO2 foams.
θ|)2, where α is the particle radius; γow is the interfacial tension, and θ is the contact angle through the aqueous phase. An estimation of the adsorption energy in this study with γCO2/brine = 25.15 mN m−1,21 θ = 75° is 763 kBT, which is much larger than the adsorption energy for a typical surfactant molecule at an oil–water interface (which is of the order of several kBT).8 This high adsorption energy favors irreversible adsorption of the nanoparticles to the CO2/brine interface and to the formation of solid-like surface layers. Together with the resistance of the interfaces to collapse, this prevents the CO2 bubbles from coarsening and coalescence,22 resulting in highly stable CO2 foams.
3.2 CO2 foam generation with different phase ratios
It has been reported that the foam quality (volCO2![[thin space (1/6-em)]](https://www.rsc.org/images/entities/char_2009.gif) :
:![[thin space (1/6-em)]](https://www.rsc.org/images/entities/char_2009.gif) vol(CO2+brine)) is one of the controversial parameters affecting foam flow behavior.22,23 Core-flooding tests of different CO2/nanosilica dispersion phase ratios were conducted to investigate the effects of volumetric phase ratio on CO2 foam behavior such as foam generation and foam mobility. Fig. 4 displays the CO2 foam images at different foam qualities. At low foam quality regime such as Fig. 4a and b, collisions and interactions between bubbles are infrequent and weak, and the possibility of bubble collapse decreases.24 The generated CO2 foams were fine-textured with uniform bubble size. In addition, the low foam quality implied high brine content, which could produce more stable liquid lamellae and supply sufficient nanoparticles around the foam bubbles, resulting in more stable CO2 foams. The results in Fig. 4 indicated that the CO2 foam with a foam quality of 20% displayed fine-texture structure with excellent foam stability. The height of the foam did not change after standing for four days. At intermediate foam quality regime such as Fig. 4c–e, the generated CO2 foam displayed larger bubble size compared with that of low foam quality. More bubble collisions and interactions might occur and result in slightly more coarse foams. However, the generated CO2 foam still displayed very good stability. The height of the foam remained almost unchanged after 48 hours. The further increase of CO2 phase ratio to a higher foam quality regime resulted in more coarse CO2 foams (Fig. 4f and g). Foam coarsening and coalescence were enhanced and resulted in the deterioration of foam stability. For example, the lifetime of the CO2 foam was several hours as the foam quality was 95% (Fig. 4g).
vol(CO2+brine)) is one of the controversial parameters affecting foam flow behavior.22,23 Core-flooding tests of different CO2/nanosilica dispersion phase ratios were conducted to investigate the effects of volumetric phase ratio on CO2 foam behavior such as foam generation and foam mobility. Fig. 4 displays the CO2 foam images at different foam qualities. At low foam quality regime such as Fig. 4a and b, collisions and interactions between bubbles are infrequent and weak, and the possibility of bubble collapse decreases.24 The generated CO2 foams were fine-textured with uniform bubble size. In addition, the low foam quality implied high brine content, which could produce more stable liquid lamellae and supply sufficient nanoparticles around the foam bubbles, resulting in more stable CO2 foams. The results in Fig. 4 indicated that the CO2 foam with a foam quality of 20% displayed fine-texture structure with excellent foam stability. The height of the foam did not change after standing for four days. At intermediate foam quality regime such as Fig. 4c–e, the generated CO2 foam displayed larger bubble size compared with that of low foam quality. More bubble collisions and interactions might occur and result in slightly more coarse foams. However, the generated CO2 foam still displayed very good stability. The height of the foam remained almost unchanged after 48 hours. The further increase of CO2 phase ratio to a higher foam quality regime resulted in more coarse CO2 foams (Fig. 4f and g). Foam coarsening and coalescence were enhanced and resulted in the deterioration of foam stability. For example, the lifetime of the CO2 foam was several hours as the foam quality was 95% (Fig. 4g).
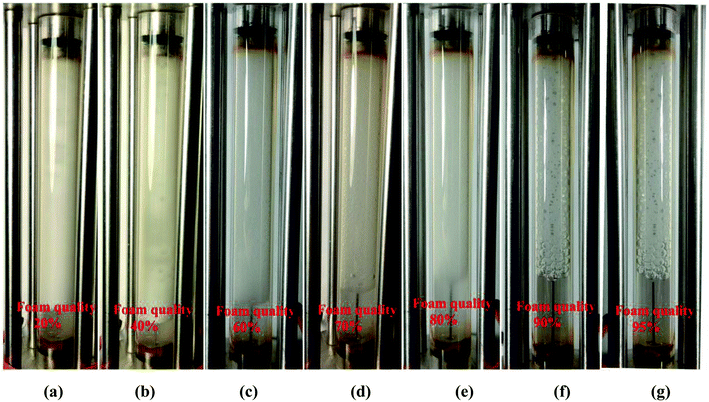 | ||
| Fig. 4 Images of foam generation at different foam quality. (Total flow rate is 150 ml h−1; nanosilica concentration: 5000 ppm; images captured as the foam flowed in the observation cell.) | ||
Fig. 5 shows the changes of foam mobility with foam quality. The results clearly indicate that, in the presence of nanosilica particles, the CO2 foam mobilities are lower than those of CO2/brine with the same phase ratio. The low foam mobility greatly benefits CO2 mobility control in CO2 EOR operation. Fig. 6 also shows that the CO2 foam mobility increased slightly as foam quality increased from 20% to 80% and then increased rapidly from 80% to 95%. The effect of foam quality on foam flow behavior has been widely investigated with surfactant as the CO2 foam stabilizer. For example, Lee and Heller25 reported that CO2 foam mobility increased with the increasing foam quality from 60% to 90%. De Vries and Wit26 performed a series of tests and concluded that a critical point (breakpoint) for foam mobility existed at an imposed total flow rate; beyond that point, foam mobility increased with foam quality. The results in Fig. 5 indicated that the foam quality of 80% might be the critical point, beyond which the foam mobility quickly increased. In addition, CO2 foam images in Fig. 4 also indicated that more coarse foams were generated as the foam quality was higher than 80%, which was consistent with the foam mobility change.
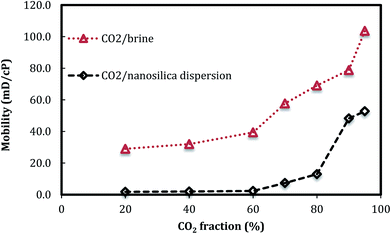 | ||
| Fig. 5 CO2 foam mobility versus foam quality. (Total flow rate is 150 ml h−1, nanosilica concentration: 5000 ppm.) | ||
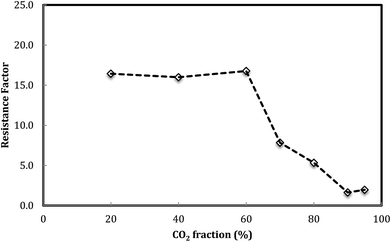 | ||
| Fig. 6 Foam resistance factor versus foam quality. (Total flow rate is 150 ml h−1, nanosilica concentration: 5000 ppm.) | ||
Fig. 6 shows the foam resistance factor versus foam quality. The results display that foam resistance factor slightly increases with the increasing foam quality from 20% to 60% and then decreases as foam quality further increases. There appeared to be a maximum foam resistance factor obtained at a foam quality of around 60%.
3.3 Effect of nanosilica concentration on foam mobility
The effect of nanosilica concentration on foam flow behavior in sandstone was investigated. Tests were conducted at a foam quality of 60% and a total flow rate of 150 ml h−1 with varying particle concentration ranging from 100 ppm to 5000 ppm. A plot of foam mobility versus nanosilica concentration is shown in Fig. 7. Foam mobility was reduced as the nanosilica concentration increased. The foam mobility decreased sharply from 14.2 mD cP−1 to 3.78 mD cP−1 as the nanosilica concentration increased from 100 ppm to 1000 ppm, then decreased slowly as the particle concentration increased from 2500 ppm to 5000 ppm. This could be attributed to the formation of lamellae in the pore spaces between CO2 and brine,27 which becomes more stable as the nanosilica concentration increased. Stability of the lamellae improved the foam's resistance to coalescence and allowed more CO2 to flow through the core sample. Foam images in Fig. 8 indicated that the foam height increased with the increasing nanosilica concentration from 100 ppm to 5000 ppm, which was consistent with the results of foam mobility. In addition, the foam texture was observed to be finer as the nanosilica concentration increased, indicating more stable foam generated at a higher concentration of nanosilica dispersion. The role of particle concentration in foam stability can be rationalized by surface coverage. To generate stable foam, the foam bubbles surface should be sufficiently covered by particles to resist coalescence. Assuming the maximum particle surface concentration (Γ) is Γmax = 50 mg m−2 and bubble radii are of 25 μm, Rio28 estimated that a minimum particle concentration of 0.7% was required to generate stable foams with the particle size of 10 nm. Our results indicated that stable CO2 foam was generated as the nanosilica concentration was 0.25%, which was close to Rio's estimation. The dependence of the foam resistance factor on particle concentration is plotted in Fig. 9. The resistance factor was 2.9 for a particle concentration as low as 100 ppm. As the nanosilica concentration was increased from 100 ppm to 1000 ppm, the resistance factor increased to 10.7, and then slowly increased to 16.8 as the nanosilica concentration increased to 5000 ppm.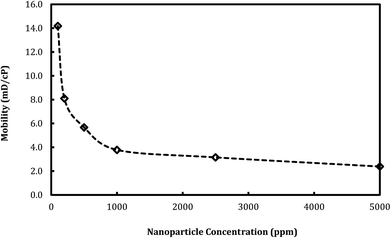 | ||
Fig. 7 Foam mobility versus particle concentration. (Total flow rate is 150 ml h−1, and CO2/brine is 3![[thin space (1/6-em)]](https://www.rsc.org/images/entities/char_2009.gif) : :![[thin space (1/6-em)]](https://www.rsc.org/images/entities/char_2009.gif) 2.) 2.) | ||
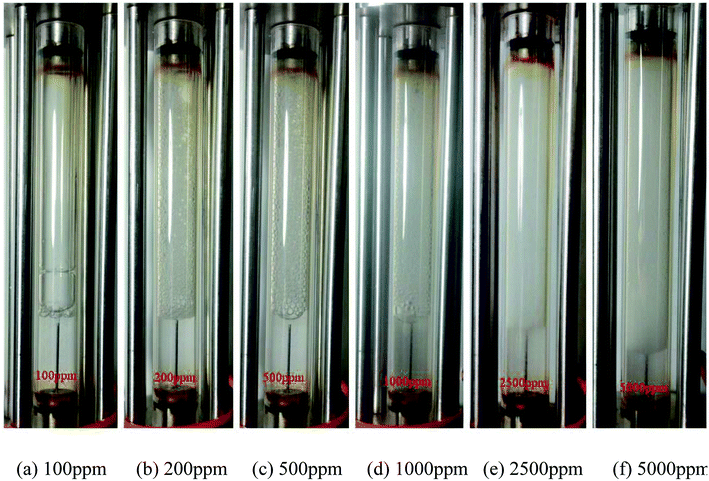 | ||
Fig. 8 Images of the CO2 foam generation at different nanosilica concentrations. (Total flow rate = 150 ml h−1; CO2/brine = 3![[thin space (1/6-em)]](https://www.rsc.org/images/entities/char_2009.gif) : :![[thin space (1/6-em)]](https://www.rsc.org/images/entities/char_2009.gif) 2; images captured as the foam flowed in the observation cell.) 2; images captured as the foam flowed in the observation cell.) | ||
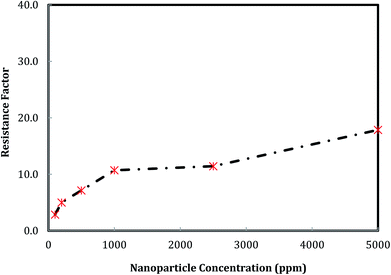 | ||
Fig. 9 Foam resistance factor versus particle concentration. (Total flow rate is 150 ml h−1, and CO2/brine is 3![[thin space (1/6-em)]](https://www.rsc.org/images/entities/char_2009.gif) : :![[thin space (1/6-em)]](https://www.rsc.org/images/entities/char_2009.gif) 2.) 2.) | ||
3.4 Effect of flow rate on foam mobility
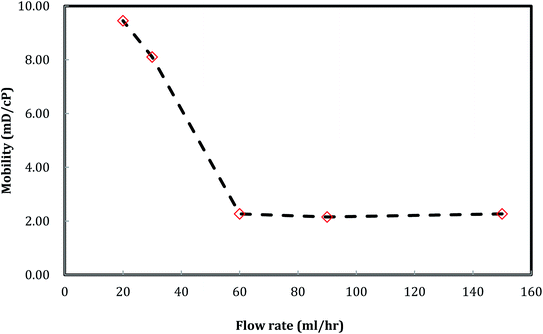
A plot of foam mobility vs. flow rate at a particle concentration of 5000 ppm and a foam quality of 60% is shown in Fig. 10. The total foam mobility was reduced from 9.6 mD/cp to 2.3 mD/cp as the flow rate increased from 20 ml h−1 to 60 ml h−1. The significant mobility reduction can be explained by the increasing shear rate from the flow rate increase, which in turn facilitates silica nanoparticle attachment at the water–CO2 interface, resulting in more stable CO2 foam as in Fig. 11. Further increase of the flow rate from 60 ml h−1 to 150 ml h−1 did not result in noticeable mobility change, indicating that stable CO2 foam could be obtained at a flow rate of 60 ml h−1. It should be noted that, in some of studies with CO2 foam, foam mobility increased with flow rate increase or called shear-thinning,23 and in other studies, foam mobility decreased with flow rate increase or called shear-thickening.29,30 Here we believe that the foam texture and stability need to be considered in understanding foam flow behavior. Fig. 11 shows the images of foam generation at different injection rates with a foam quality of 60% and a nanosilica concentration of 5000 ppm. It shows that finer and more stable CO2 foams were obtained as the flow rate increased from 20 ml h−1 to 60 ml h−1. It is expected that the finer and stable foam can decrease the foam mobility as it flow through a porous medium.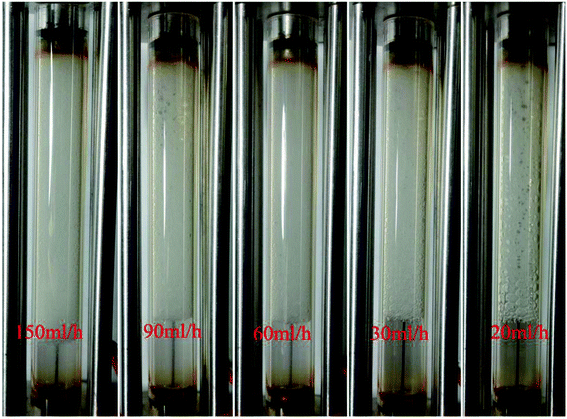 | ||
Fig. 11 Images of CO2 foam generated at different flow rates. (Nanosilica concentration: 5000 ppm; CO2/brine is 3![[thin space (1/6-em)]](https://www.rsc.org/images/entities/char_2009.gif) : :![[thin space (1/6-em)]](https://www.rsc.org/images/entities/char_2009.gif) 2; images captured as the foam flowed in the observation cell.) 2; images captured as the foam flowed in the observation cell.) | ||
A similar result emerges from the relationship between the foam resistance factor and the flow rate in Fig. 12. The resistance factor slightly increased from 3.2 to 3.3 as the flow rate increased from 20 ml h−1 to 30 ml h−1, and then jumped to 14.3 as the flow rate further increased to 60 ml h−1. Then, the resistance factor slowly increased from 14.3 to 17.9 as the flow rate increased from 60 ml h−1 to 150 ml h−1. It is well-known that foam propagation in porous media is a process of breaking and reforming the lamellae of the foam. The more stable the lamellae, the higher the resistance factor of the foam. Our results indicate that stable lamellae start to form when the flow rate is around 60 ml h−1.
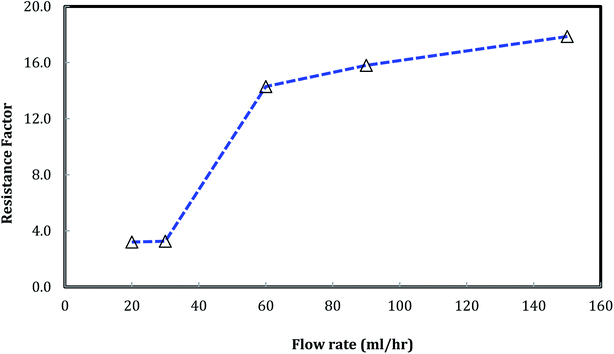 | ||
Fig. 12 Foam resistance factor versus flow rate. (Nanosilica concentration: 5000 ppm, and CO2/brine is 3![[thin space (1/6-em)]](https://www.rsc.org/images/entities/char_2009.gif) : :![[thin space (1/6-em)]](https://www.rsc.org/images/entities/char_2009.gif) 2.) 2.) | ||
4. Conclusions
(1) A stable CO2 foam was generated when CO2 and nanosilica dispersion flowed through a core sample.(2) Foam mobility slightly increased with the increasing foam quality from 20% to 80% and then rapidly increased as the foam quality increased from 80% to 95%.
(3) With the increase of nanosilica concentration, foam mobility decreased and the foam resistance factor increased. The threshold concentration required to generate a stable CO2 foam was 2500 ppm under the experimental conditions herein.
(4) Foam mobility decreased with the increasing flow rate from 20 ml h−1 to 60 ml h−1 and then slightly changed as the flow rate increased from 60 ml h−1 to 150 ml h−1.
Conflicts of interest
There are no conflicts to declare.Acknowledgements
We gratefully acknowledge the support of the Department of Energy through the National Energy Technology Laboratory under contract number DE-FE0031575. The authors also thank AkzoNobel Pulp and Performance Chemicals to provide free silica nanoparticle samples.References
- G. G. Bernard and L. W. Holm, Effect of foam on permeability of porous media to gas, SPE J., 1964, 4, 267 Search PubMed.
- L. L. Schramm, Foams: Fundamentals and Applications in the Petroleum Industry, Adv. Chem., 1994, 242, 3 CrossRef CAS.
- W. R. Rossen, Foams in enhanced oil recovery, Foams: theory, measurements and applications, Marcel Dekker, New York, 1996 Search PubMed.
- G. C. Wang, A Laboratory Study of CO2 Foam Properties and Displacement Mechanism. Paper SPE 12645 presented at the SPE Enhanced Oil Recovery Symposium, Tulsa, Oklahoma, USA, April 15-18, 1984 Search PubMed.
- T. C. Ransohoff and C. J. Radke, Mechanisms of foam generation in glass-bead packs, SPE Reservoir Eng., 1988, 3, 573 CrossRef CAS.
- J. S. Kim, Y. Dong and W. R. Rossen, Stead-state flow behavior of CO2 foam. Paper SPE 89351 presented at the SPE/DOE Symposium on Improved Oil Recovery, Tulsa, Oklahoma, USA, April 17-21, 2004 Search PubMed.
- J. L. Dickson, B. Binks and P. Johnston, Stabilization of carbon dioxide-in-water emulsions with silica nanoparticles, Langmuir, 2004, 20, 7976 CrossRef CAS PubMed.
- D. A. Espinoza, F. M. Caldelas, K. P. Johnston, S. L. Bryant and C. Huh, Nanoparticle-stabilized supercritical CO2 foams for potential mobility control applications. Paper SPE 129925 presented at the SPE Improved Oil Recovery Symposium, Tulsa, Oklahoma, USA, April 24–28, 2010 Search PubMed.
- J. W. Andrew, G. B. Hitesh, S. L. Bryant, C. Huh and K. P. Johnston, Nanoparticle stabilized carbon dioxide in water foams for enhanced oil recovery. Paper SPE 154285 presented at the SPE Symposium on Improved Oil Recovery, Tulsa, Oklahoma, USA, April 14–18, 2012 Search PubMed.
- R. Singh and K. Mohanty, Foams stabilized by in situ surface-activated nanoparticles in bulk and porous media, SPE J., 2016, 21, 121 CrossRef CAS.
- H. Farhadi, S. Riahi, S. Ayatollahi and H. Ahmadi, Experimental study of nanoparticle-surfactant-stabilized CO2 foam: Stability and mobility control, Chem. Eng. Res. Des., 2016, 111, 449 CrossRef CAS.
- A. Worthen, S. L. Bryant, C. Huh and K. Johnston, Carbon dioxide-in-water foams stabilized with nanoparticles and surfactant acting in synergy, AIChE J., 2013, 59, 3490 CrossRef CAS.
- V. Prigiobbe, A. J. Worthen, K. P. Johnston, C. Huh and S. L. Bryant, Transport of nanoparticle-stabilized CO2-foam in porous media, Transp. Porous Media, 2016, 111, 265 CrossRef CAS.
- M. L. Hoefner and E. M. Evans, CO2 foam: Results from four developmental field trials, SPE Reservoir Eng., 1995, 10, 273 CrossRef CAS.
- J. San, S. Wang, J. Yu, R. Lee and N. Liu, Nanaoparticle stabilized CO2 foam: Effect of different ions and temperature, SPE J., 2017, 22, 1416 CrossRef CAS.
- A. S. Aronson, V. Bergeron, M. E. Fagan and C. J. Radke, The influence of disjoining pressure on foam stability and flow in porous media, Colloids Surf., A, 1994, 83, 109 CrossRef CAS.
- R. A. Ettinger and C. J. Radke, Influence of texture on steady foam flow in Berea sandstone, SPE Reservoir Eng., 1992, 7, 83 CrossRef CAS.
- A. C. Martinez, E. Rio, G. Delon, A. Saint-Jalmes, D. Langevin and B. P. Binks, On the origin of the remarkable stability of aqueous foams stabilised by nanoparticles: link with microscopic surface properties, Soft Matter, 2008, 4, 1531 RSC.
- B. P. Binks and T. S. Horozov, Aqueous foams stabilized solely by silica nanoparticles, Angew. Chem., Int. Ed., 2005, 44, 3722 CrossRef CAS PubMed.
- B. P. Binks, Particles as surfactants-similarities and differences, Curr. Opin. Colloid Interface Sci., 2002, 7, 21 CrossRef CAS.
- E. Rio, W. Drenckhan, A. Salonen and D. Langevin, Unusually stable liquid foams, Adv. Colloid Interface Sci., 2014, 205, 74 CrossRef CAS PubMed.
- H. Yaghoobi, Laboratory investigation of parameters affecting CO2-foam mobility in sandstone at reservoir conditions. paper SPE 29168 presented at the SPE Eastern Regional Meeting, Charleston, West Virginia, USA, November 8–10, 1994 Search PubMed.
- S. H. Chang and R. B. Grigg, Effects of foam quality and flow rate on CO2-foam behavior at reservoir temperature and pressure, SPE Reservoir Eval. Eng., 1999, 2, 248 CrossRef CAS.
- S. A. Faroughi, A. J. J. Pruvot and J. McAndrew, The rheological behavior of energized fluids and foams with application to hydraulic fracturing: Review, J. Pet. Sci. Eng., 2018, 163, 243 CrossRef CAS.
- H. O. Lee and J. P. Heller, Laboratory measurements of CO2-foam mobility, SPE Reservoir Eng., 1990, 5, 193 CrossRef.
- A. S. De Vries and K. Wit, Rheology of gas/water foam in the quality range relevant to steam foam, SPE Reservoir Eng., 1990, 5, 185 CrossRef.
- P. A. Gauglitz, F. Friedmann, S. I. Kam and W. R. Rossen, Foam generation in homogeneous porous media, Chem. Eng. Sci., 2002, 57, 4037 CrossRef CAS.
- E. Rio, W. Drenckhan, A. Salonen and D. Langevin, Unusually stable liquid foams, Adv. Colloid Interface Sci., 2014, 205, 74 CrossRef CAS PubMed.
- T. W. Patzek and M. T. Koinis, Kern river steam-foams pilots, J. Pet. Technol., 1990, 42, 496 CrossRef CAS.
- S. H. Yang and R. L. Reed, Mobility control using CO2 forms. Paper SPE 19689 presented at the 54th Annual Technical Conference and Exhibition, San Antonio, Texas, USA, October 8-11, 1989 Search PubMed.
| This journal is © The Royal Society of Chemistry 2019 |

