
 Open Access Article
 This Open Access Article is licensed under a
 Creative Commons Attribution 3.0 Unported Licence
ZnO/Ag/Ag2WO4 photo-electrodes with plasmonic behavior for enhanced photoelectrochemical water oxidation
Rania E. Adam *a,
Mahsa Pirhashemib,
Sami Elhaga,
Xianjie Liuc,
Aziz Habibi-Yangjehb,
Magnus Willandera and
Omer Nur*a
*a,
Mahsa Pirhashemib,
Sami Elhaga,
Xianjie Liuc,
Aziz Habibi-Yangjehb,
Magnus Willandera and
Omer Nur*a
aDepartment of Sciences and Technology, Linköping University, Campus Norrköping, SE-601 74 Norrköping, Sweden. E-mail: rania.elhadi.adam@liu.se; omer.nour@liu.se
bDepartment of Chemistry, Faculty of Sciences, University of Mohaghegh Ardabili, P. O. Box 179, Ardabil, Iran
cDepartment of Physics, Chemistry and Biology (IFM), Linköping University, 58183 Linköping, Sweden
First published on 12th March 2019
Abstract
Ag-based compounds are excellent co-catalyst that can enhance harvesting visible light and increase photo-generated charge carrier separation owing to its surface plasmon resonance (SPR) effect in photoelectrochemical (PEC) applications. However, the PEC performance of a ZnO/Ag/Ag2WO4 heterostructure with SPR behavior has not been fully studied so far. Here we report the preparation of a ZnO/Ag/Ag2WO4 photo-electrode with SPR behavior by a low temperature hydrothermal chemical growth method followed by a successive ionic layer adsorption and reaction (SILAR) method. The properties of the prepared samples were investigated by different characterization techniques, which confirm that Ag/Ag2WO4 was deposited on the ZnO NRs. The Ag2WO4/Ag/ZnO photo-electrode showed an enhancement in PEC performance compared to bare ZnO NRs. The observed enhancement is attributed to the red shift of the optical absorption spectrum of the Ag2WO4/Ag/ZnO to the visible region (>400 nm) and to the SPR effect of surface metallic silver (Ag0) particles from the Ag/Ag2WO4 that could generate electron–hole pairs under illumination of low energy visible sun light. Finally, we proposed the PEC mechanism of the Ag2WO4/Ag/ZnO photo-electrode with an energy band structure and possible electron–hole separation and transportation in the ZnO/Ag/Ag2WO4 heterostructure with SPR effect for water oxidation.
1 Introduction
Solar driven photocatalysis activities of semiconductors (i.e. dye photodegradation, hydrogen production, and CO2 reduction, etc.) have recently gained great interest because they are related to the utilization of a sustainable energy source and hence are of positive impact to the environment and energy availability issues.1–4 Photoelectrochemical (PEC) applications are promising for water splitting to produce hydrogen and oxygen via the conversion of solar energy to chemical energy.1 Various nanostructured metal oxides have been investigated for PEC applications such as WO3, TiO2, Fe2O3, BiVO4, and ZnO.5–10 From above mentioned semiconductors, ZnO is the most favorable due to its wide band gap (Eg ∼ 3.3 eV), and relatively high carriers mobility.8,11–15 ZnO possesses many point defects that form many shallow and deep levels within the bandgap resulting in deep level emission (DLE). These point defects are introduced into the crystal lattice of the ZnO nanostructures during the growth and will increase the materials photocatalytic activities within the visible light spectrum and can shift the absorption towards the visible light band from 400 nm and up to 700 nm by creating intermediates states preventing electron–hole pair recombination and enhance photocatalytic activities.16 These defects explain all of the visible colors of luminescence observed from different ZnO samples.17,18 However the high recombination rate of photo-generated charge carriers are the most influential factor that limits the efficiency of the photocatalytic processes of the ZnO.1,12,19–21 To tackle these obstacle, and to increase the photocatalytic activities of the ZnO under visible solar light, variety of studies are conducted to increase the photocatalytic response of the ZnO through coupling with other semiconductors or photosensitizer to form an efficient heterostructure material.12,20,21 Currently, Ag-based compounds are regarded as an excellent candidate as a co-catalyst that can largely enhance solar energy conversion efficiency and charge separation, which lead to further boost the PEC performance. Recent studies have proven that the deposition of Ag-containing species on the surface of composites, can lead to effectively improve harvesting visible light and increase the photo-generated charge carriers separation owing to the surface plasmon resonance (SPR) effect.12,19,21,22 The net result will be an enhanced PEC activity of the Ag containing composites. In this regard, silver tungsten (Ag2WO4) with a band gap between 2.9–3.1 eV, have been used for preparation of different outstanding plasmonic photo-catalysts. For example, Vignesh et al.23 studied the photocatalytic activity of Ag2WO4/g-C3N4 nanocomposite for degradation of methylene blue (MB) under solar light radiation. Their result showed an enhancement on the degradation efficiency of MB. Also, Jingjing Li24 investigated the formation of Ag2WO4/AgX (X = Cl, Br, I) hybrid nanorods to enhance visible light driven PEC properties. Recently, Pirhashemi et al.20 reported a highly enhanced photodegradation of organic pollutants with a plasmonic ZnO/Ag/Ag2WO4 heterostructures. Very recently, an effective PEC performance is achieved through Ag2WO4–AgX (X = Cl, Br, I) sensitized TiO2 nanotube array, and the deposition of the Ag2WO4 was carried out by the successive ionic layer adsorption and reaction (SILAR) method.25 According to the literature review, Ag/Ag2WO4 is a promising candidate to be used to develop a plasmonic sensitizer for ZnO nanostructures for optimum utilization of the solar power and accelerating charge transfer, leading to greatly enhance the PEC activities. Considering the above review, we report in this work the synthesis, characterization, and PEC activities of Ag/Ag2WO4 grown on top of ZnO nanorods (NRs). Firstly, ZnO NRs is synthesized using the hydrothermal low temperature chemical method. This was followed by the Ag/Ag2WO4 deposition on top of the ZnO NRs using the SILAR method. To the best of our knowledge there are no reports about the preparation and study of a plasmonic ZnO/Ag/Ag2WO4 photo-electrode for PEC activities. Our results showed an enhancement on the photocurrent and the current–voltage measurements. These observations are promising results for water splitting applications.2 Experimental part
2.1 Photoelectrode preparation
The photoelectrode prepared in three steps: substrate preparation, growth of ZnO NRs, and deposition of Ag/Ag2WO4 as shown in the schematic diagram in Fig. 1 which explained in the following section.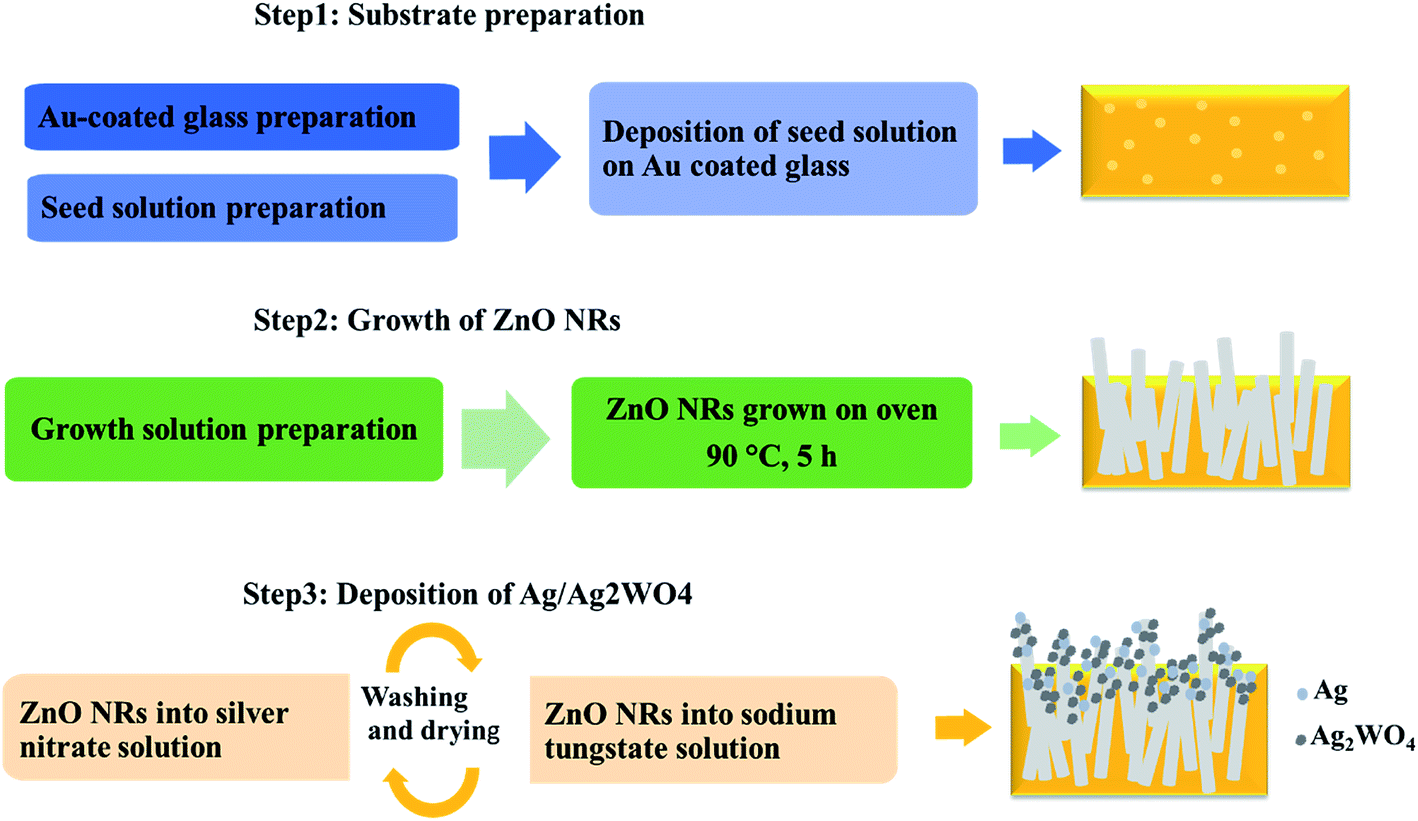 | ||
| Fig. 1 Schematic diagram of preparation of ZnO NRs and the ZnO/Ag/Ag2WO4 photoelectrodes. | ||
2.1.1.1 Au coated glass preparation. In our work we have been using Au coated glass substrate that is prepared as described below, because Au coated glass has been used by many researchers as efficient electrode after deposition of ZnO based nanostructures materials,26 and with SPR effect.27 Also, it is found that the stability of electrodes can be improved by deposition of thin layer of gold.28 Therefore, Au coated glass was used as substrate to grow ZnO NRs and ZnO/Ag/Ag2WO4 heterostructure for PEC performance. For Au coated glass preparation, glass substrates were cleaned with acetone, isopropanol, and deionized water, respectively under ultrasonic bath for about 15 min. Then, the substrates were fixed into a vacuum chamber of an evaporator instrument. After that, an adhesive layer of 20 nm of titanium was evaporated followed by a 100 nm thickness layer of gold.
2.1.1.2 Deposition of seed layer. Then a seed solution contains ZnO nanoparticles (NPs) deposited on to the substrate via spin coating at 3000 rpm for 25 s. The spin coating was repeated three times to have full and uniform coverage of the ZnO NPs onto the substrate. After that, the substrates were dried into an air oven at 120 °C for 10 min. The ZnO seed precursor was prepared by adding potassium hydroxide (KOH) solution (0.03 M in methanol) drop wise into zinc acetate dehydrate solution (0.01 M in methanol) under magnetic stirring (750 rpm) at 60 °C for 2 h.
2.2 Characterization
Powder X-ray diffraction (XRD) was used to study the structural properties of the prepared samples using Philips powder diffractometer (1729 PW) equipped with (Cu Kα) radiation with generator running at voltage of 40 kV and current of 40 mA. Field emission scanning electron microscope (FE-SEM) using a LEO 1550 Gemini field emission gun at 15 kV was used to investigate the morphology of the prepared samples. The corresponding energy depressive X-ray (EDX) with EDX mapping was investigated to identify the elemental and chemical properties of the prepared samples. The absorption spectra of the prepared samples were characterized by Perkin Elmer Lambda 900 UV-visible spectrophotometer. The chemical composition of the samples was investigated using X-ray photoelectron spectroscopy (XPS) which recorded by Scienta ESCA-200 spectrometer using monochromatic Al Kα X-ray source with a power of (1486.6 eV).The photoelectrochemical activities were studied by using three electrode photoelectrochemical measurements using SP-200 potentiostat (Bio-Logic, Claix, France). A platinum (Pt) sheet was used as the counter electrode and a standard Ag/AgCl in 3 M KCl (as a reference electrode) was used with (0.1 M) of sodium sulfate (Na2SO4) electrolyte. The total area of the electrode that immersed in the electrolyte was 1 cm2. The sun light was obtained by a solar simulator that uses a 100 W ozone free xenon lamp with an output power of 1 sun (AM 1.5).
3 Result and discussion
3.1 Characterization analysis
Fig. 2 shows the structural investigation by XRD for ZnO and ZnO/Ag/Ag2WO4 samples. It could be observed that all the obtained XRD diffraction peaks in Fig. 2(a) are belonging to the hexagonal wurtzite pure phase of ZnO (JCPDS no. 36-1451) which suggest that there are no other phases of ZnO or impurities have been observed. In the XRD pattern of ZnO/Ag/Ag2WO4 heterostructure (Fig. 2(b)), more peaks were identified, which were assigned to the planes (042), (025), and (135) for Ag2WO4 (JCPDS no. 33-1195). The peak at 78° is assigned to the reflections of cubic Ag (JCPDS no. 65-2871).20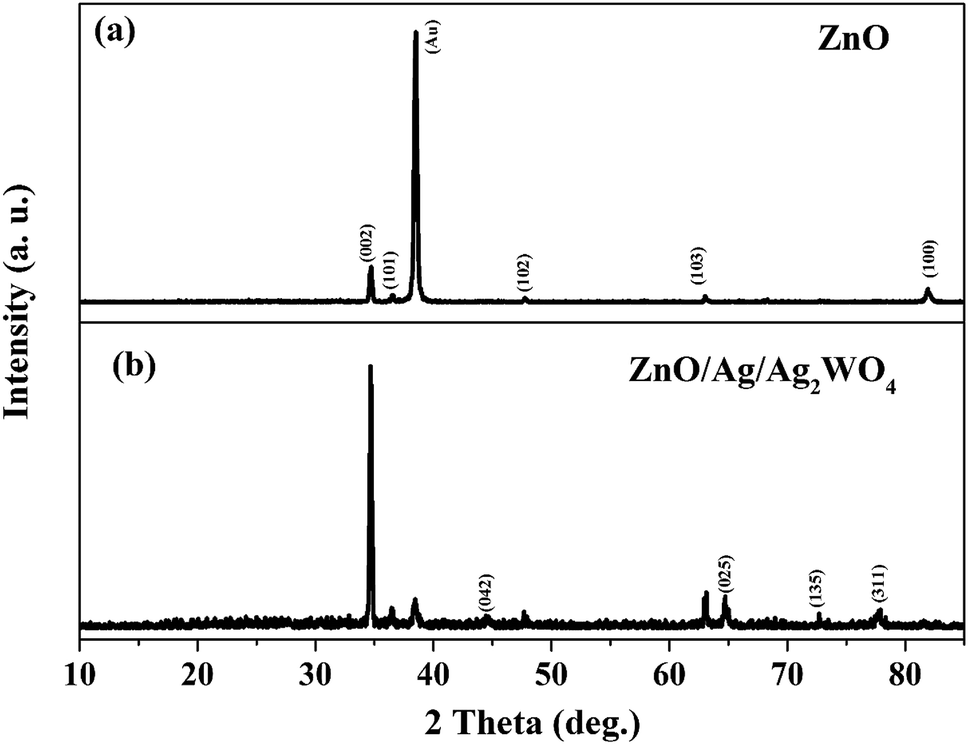 | ||
| Fig. 2 XRD patterns of the ZnO NRs and the ZnO/Ag/Ag2WO4 heterostructure. | ||
Fig. 3(a) and (b), shows the morphology of ZnO NRs and ZnO/Ag/Ag2WO4 heterostructure that was measured by the FE-SEM imaging. Fig. 3(a) shows the SEM image of the ZnO NRs, which reveal that the ZnO NRs were vertically aligned and are having hexagonal shape as expected. The diameter size of the ZnO NRs found to be ∼100 nm. After deposition of the Ag/Ag2WO4 on the ZnO NRs, a heterostructure was formed and Ag/Ag2WO4 particles were distributed on the surface of the ZnO NRs as it can be seen in Fig. 3(b). Ag/Ag2WO4 nanoparticles size were estimated from SEM imaging to vary between ∼30 to ∼150 nm, the bigger size of the nanoparticles might be due to the agglomeration of smaller nanoparticles. It is worth to note that the SPR effect depends on the size and the shape of the nanostructure, and it is quite unique in the nanostructures size from 10 to 100 s of nanometers.30 Therefore, the size of the prepared ZnO/Ag/Ag2WO4 heterostructure are favorable for SPR effect. The corresponding EDX spectrum of the ZnO/Ag/Ag2WO4 heterostructure were examined to show the composition of elements in the sample which consists of Zn, O, Ag, and W without any other elements detected (see Fig. 3(c)).
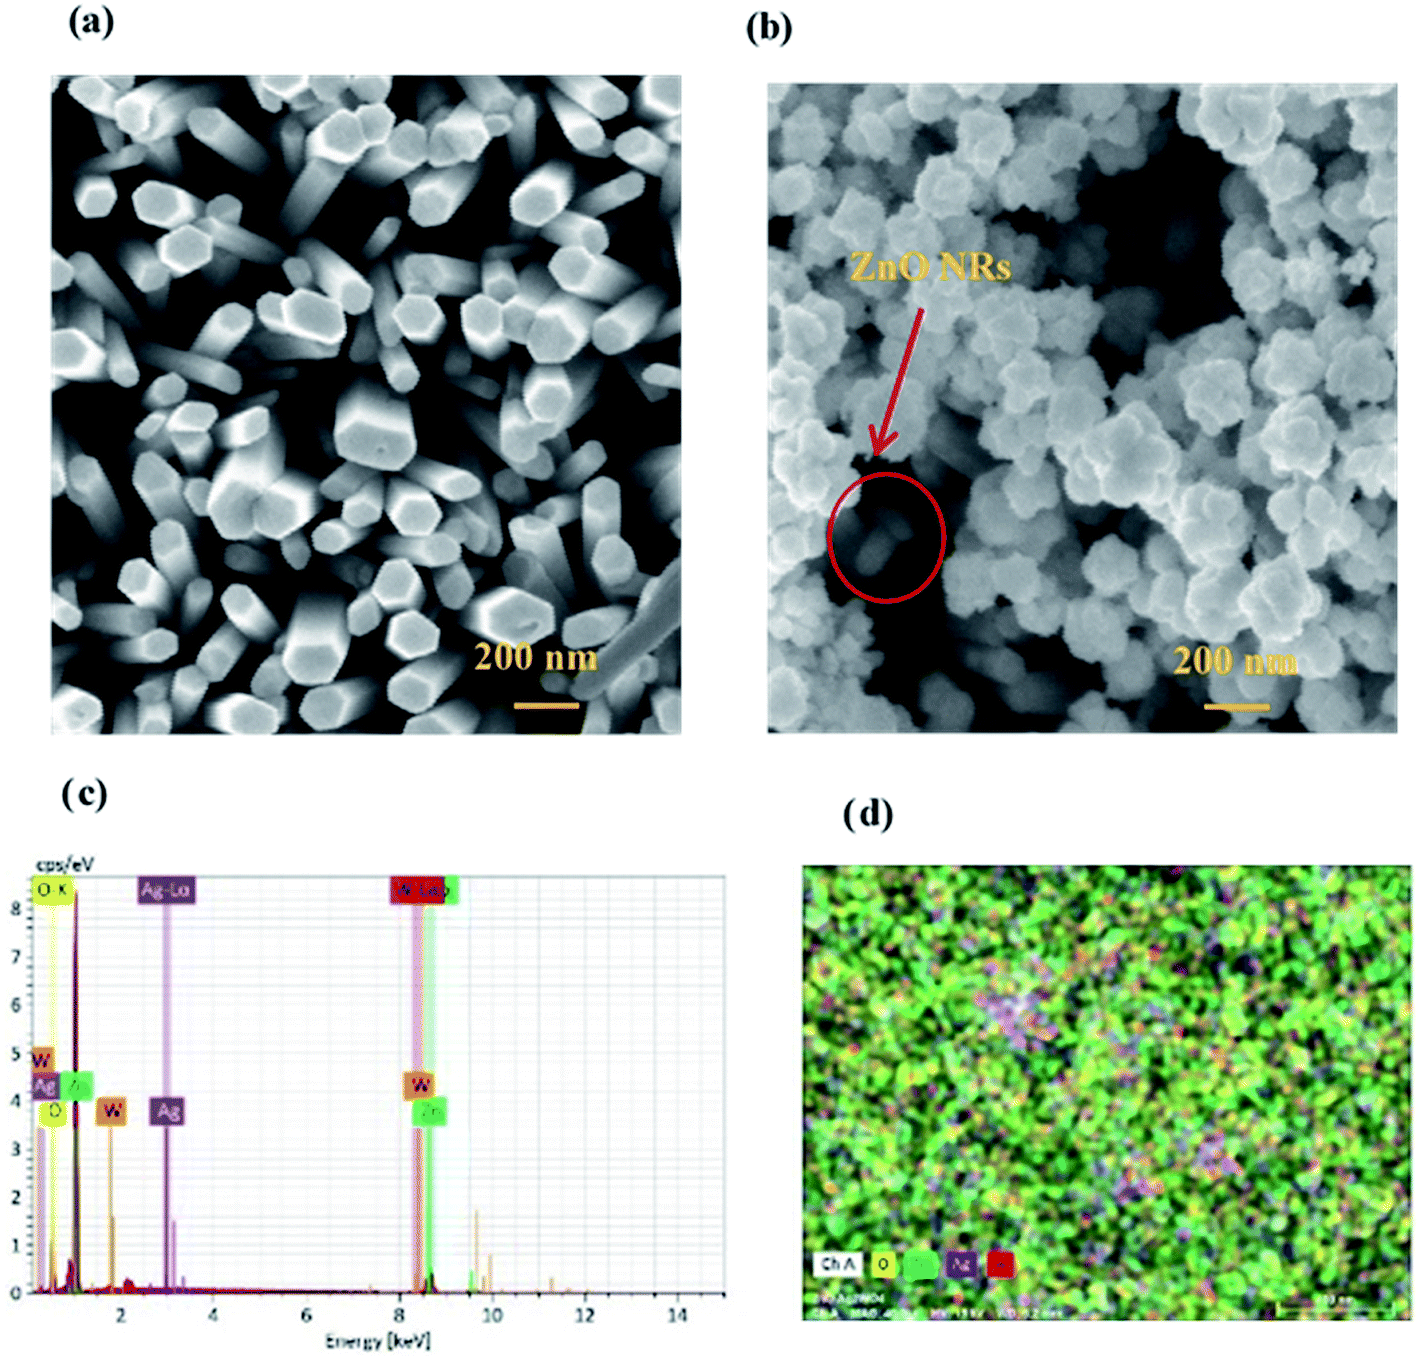 | ||
| Fig. 3 (a) and (b) FM-SEM images of the ZnO NRs and the ZnO/Ag/Ag2WO4 heterostructure. (c) EDX spectrum showing the elements composition peaks from Zn, O, Ag, and W of ZnO/Ag/Ag2WO4 heterostructure, and (d) EDX mapping show the elements distribution for the ZnO/Ag/Ag2WO4 heterostructure. | ||
The EDX result is in good agreement with the XRD result. To further understand the distribution of the elements, the ZnO/Ag/Ag2WO4 photo-electrode was further studied by elemental mapping analysis, as shown in Fig. 3(d). From the present elementals map with particular colors for each element, it is clear that the Zn, O, Ag and W components are uniformly distributed on the sample. It is worth noting that better distribution provides strong physical coupling between counterparts. Hence, it is beneficial to efficient generation and separation of charge carriers which leads to superior PEC performance of the nanocomposite. Moreover, the EDX mapping of the ZnO NRs after it was immersed into the Ag (NO3) solution and before the synthesis of the Ag2WO4 was examined for the confirmation of the Ag nanoparticles existence into the heterostructure. As it can be seen in Fig. 4, Ag was detected.
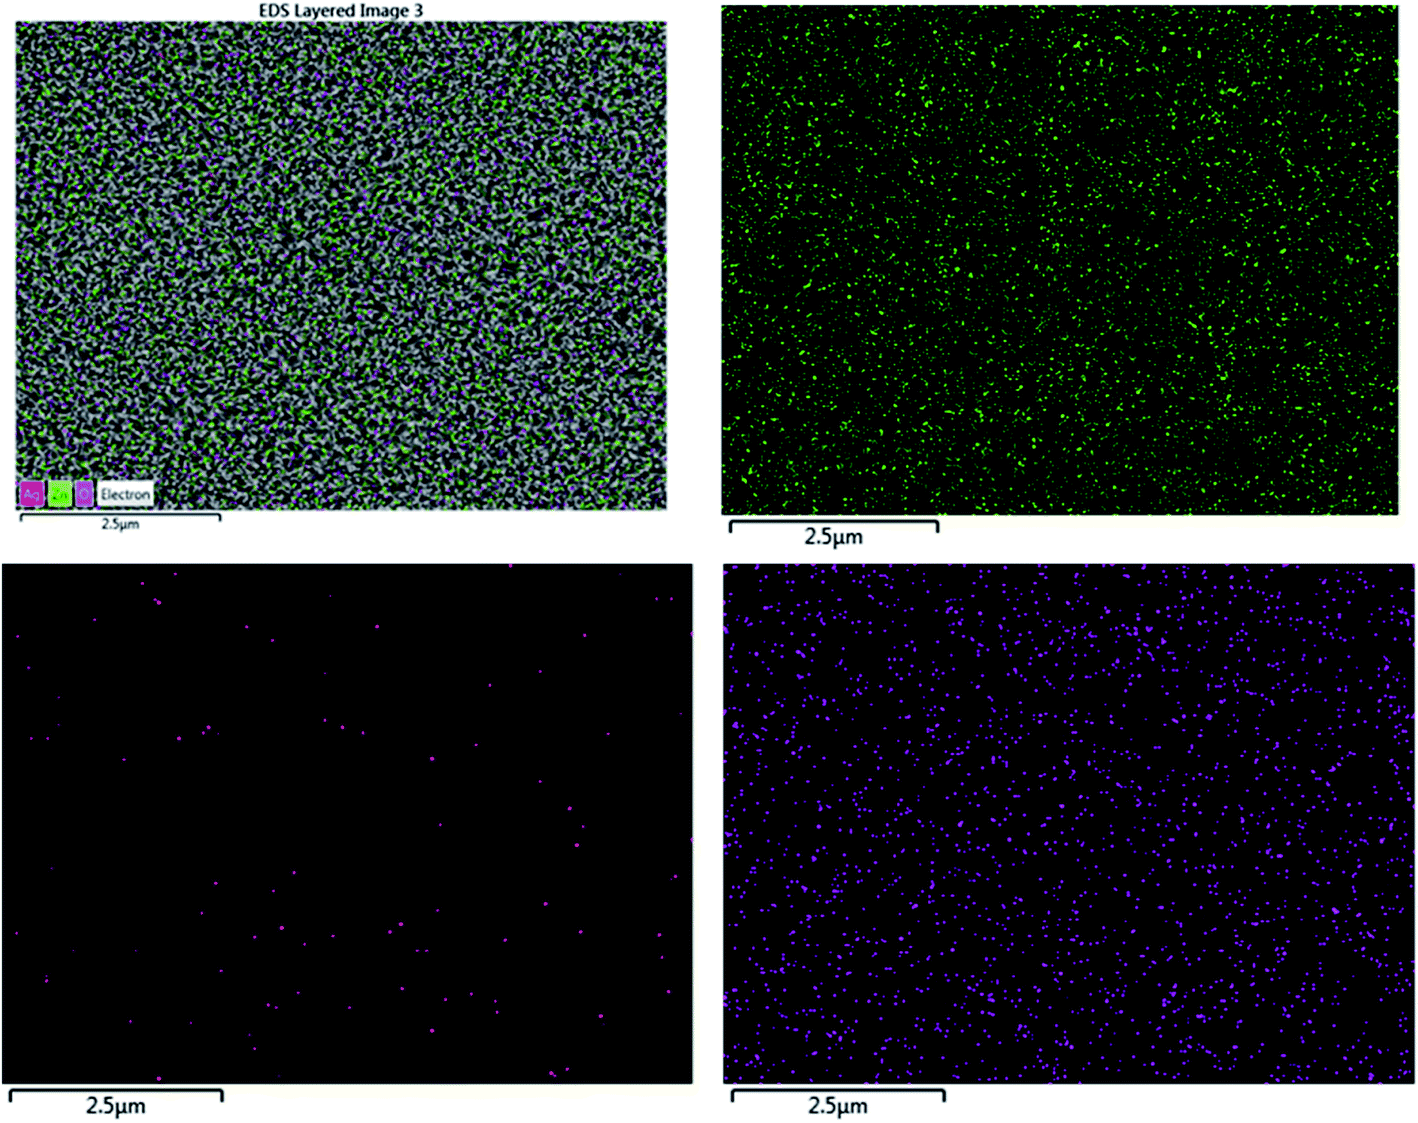 | ||
| Fig. 4 EDX mapping show the elements distribution for the ZnO NRs after immersion on the AgNO3 solution and before the synthesis of the Ag2WO4 for Ag nanoparticles detection confirmation. The red dots represent Ag that appears very clearly to exist on top of the ZnO NRs. | ||
Furthermore, the chemical state of the elements in ZnO/Ag/Ag2WO4 heterostructure were examined by XPS measurements. The XPS peaks of the all elements in the ZnO/Ag/Ag2WO4 are observed in Fig. 5. The observed XPS spectrum shown in Fig. 5 is in agreement with the EDX result that was presented in Fig. 3.
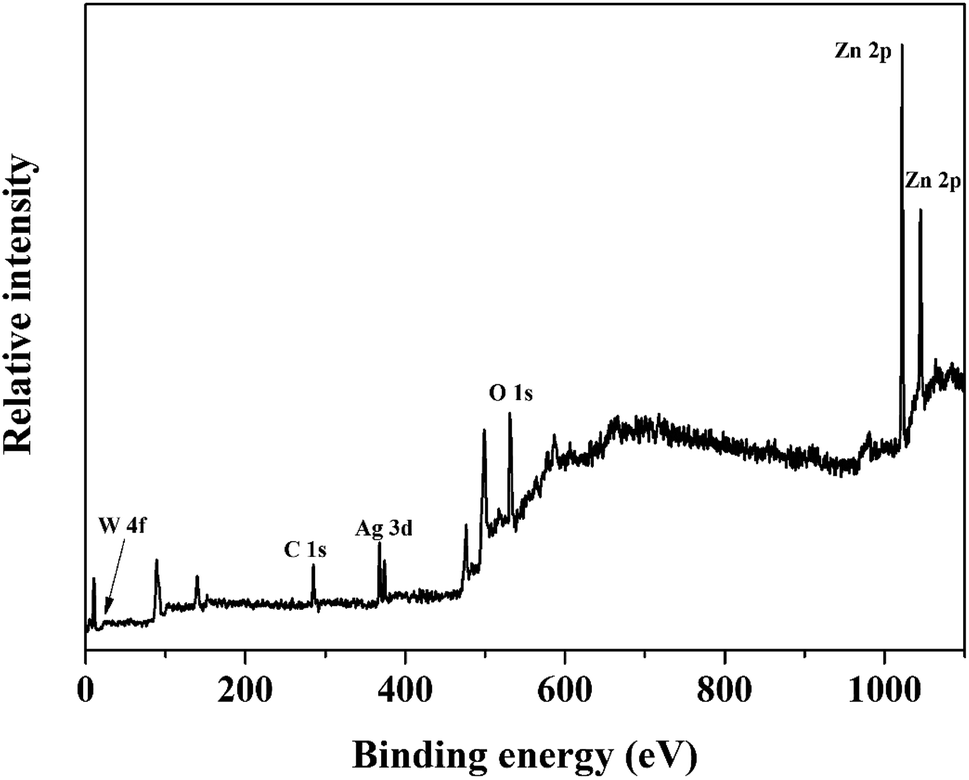 | ||
| Fig. 5 XPS spectrum survey scan of the ZnO/Ag/Ag2WO4 heterostructure. | ||
The XPS peak of C 1s at 284.6 eV is related to carbon from the XPS instrument. Fig. 6(a) shows the XPS core level spectra of Zn 2p of ZnO/Ag/Ag2WO4 heterostructure which is composed of two peaks centered at 1022.43 and 1045.25 eV, which are attributed to the binding energy lines of Zn 2p3/2 and Zn 2p1/2, respectively and they represented the formation of Zn–O bonds within the ZnO crystal lattice.31,32 Fig. 6(b) shows the O1s core level XPS spectra of ZnO/Ag/Ag2WO4 heterostructure which is divided into two peaks. The peak at low binding energy centered at 531.15 eV, is related to oxygen deficient region, whereas, the peak at higher binding energy centered at 532.58 eV can be ascribed to the oxygen on the ZnO surface and water molecules H2O.19,27 The XPS spectrum of Ag 3d is shown in Fig. 6(c). The peaks at 368.21 and 374.23 eV are assigned to Ag 3d5/2 and Ag 3d3/2, respectively. The Ag 3d5/2 is further divided into two different peaks at 367.87 and 368.47 eV and the Ag 3d3/2 peak is also divided into two different peaks at 373.89 and 374.40 eV. The peaks at low energies 367.87 and 373.89 eV are accounted for the Ag+ in Ag2WO4, whereas, the peaks at higher energies 368.47 and 374.40 is related to metallic Ag0.20,33 Fig. 6(d) shows the binding energy of W 4f which centered at 34.68 and 36.42 eV for W 4f7/2 and W 4f5/2, respectively which is consistent with those of pure Ag2WO4.33 The above XPS discussed results indicate the successful demonstration of ZnO/Ag/Ag2WO4 heterostructures as intended.
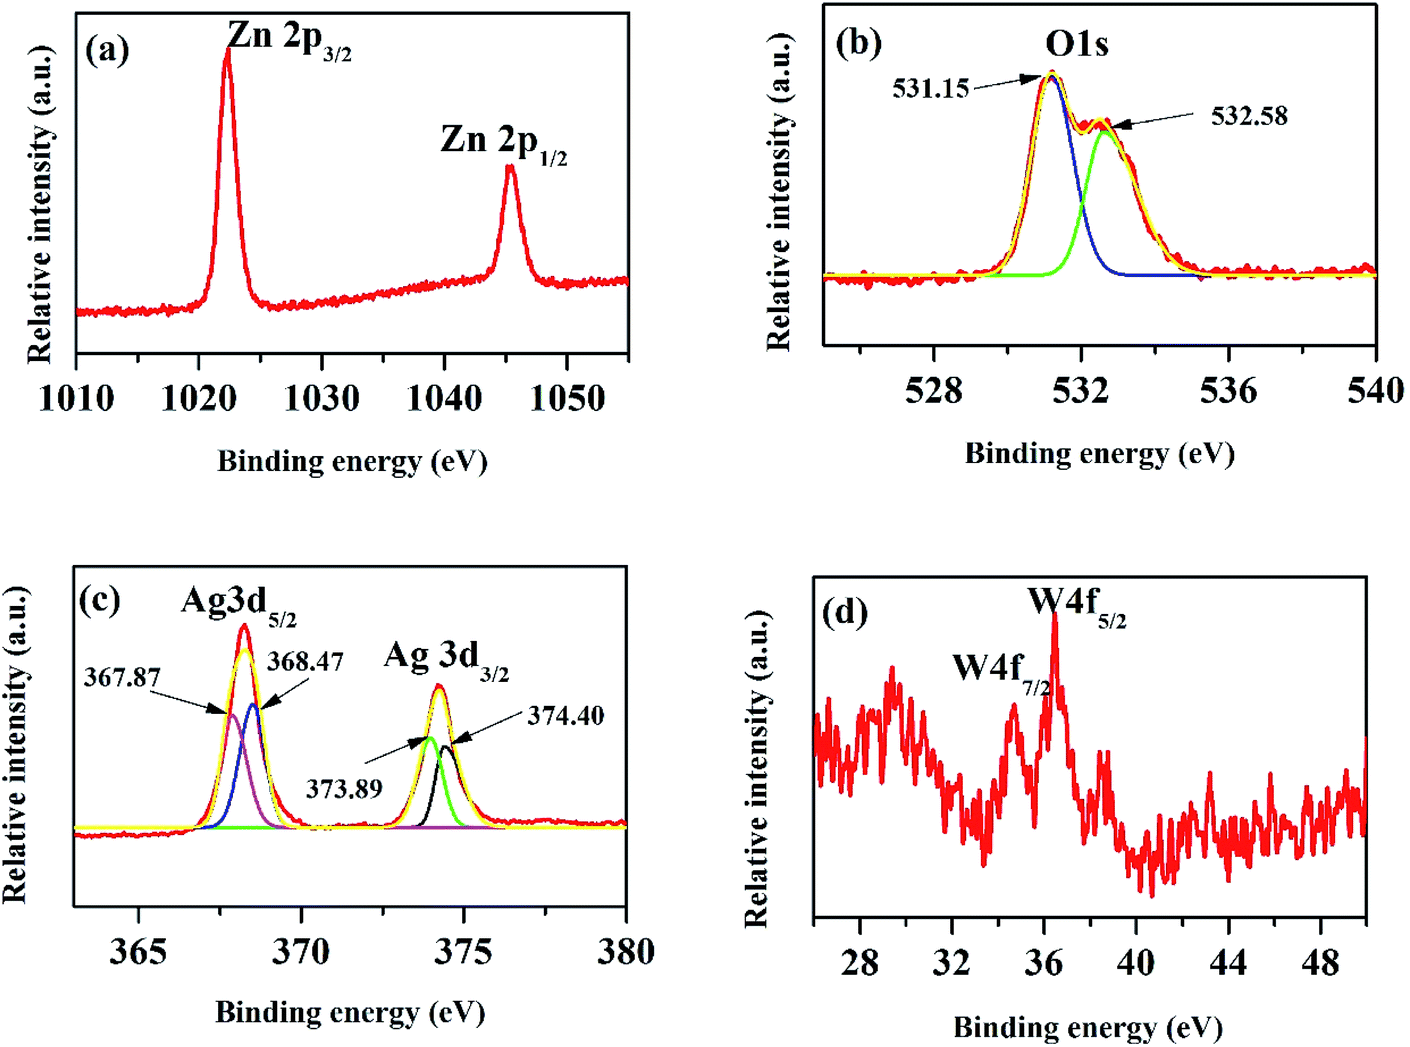 | ||
| Fig. 6 XPS core level spectra of the ZnO/Ag/Ag2WO4 heterostructure. | ||
The UV-vis absorption spectra of the ZnO and ZnO/Ag/Ag2WO4 heterostructure show similar absorption trends (see Fig. 7). Compared to pristine ZnO NRs, ZnO/Ag/Ag2WO4 heterostructure exhibits an obvious red shift of the optical absorption in the visible region (>400 nm). The optical band gaps were found to be 3.2 and 3.1 eV for ZnO and ZnO/Ag/Ag2WO4, respectively. This result could be explained due to formation of Ag2WO4 on the top of the ZnO NRs forming the heterostructure (i.e. bandgap engineering). Also, note that metallic silver could be produced during the sample preparation and can trigger surface plasmonic effect.20,21
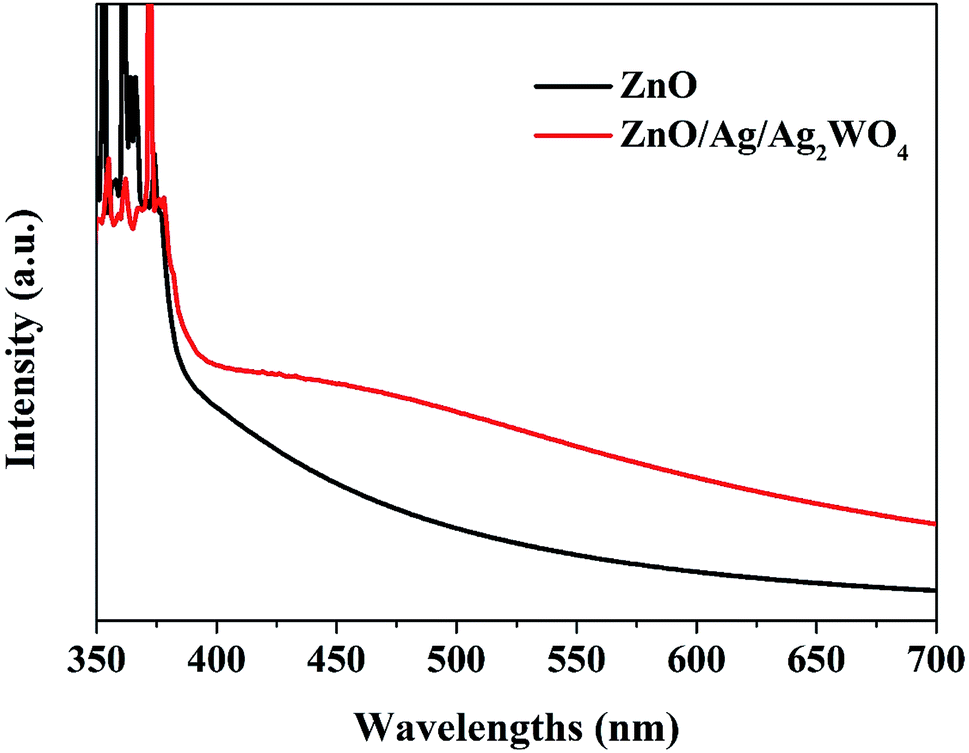 | ||
| Fig. 7 UV-vis absorption spectra of the ZnO NRs and the ZnO/Ag/Ag2WO4 heterostructure. | ||
3.2 Photoelectrochemical and water oxidation analysis
The charge carrier characteristics at the semiconductor/electrolyte interface for pristine ZnO NRs and ZnO/Ag/Ag2WO4 heterostructure were examined via linear sweep voltammetry measurements as shown in Fig. 8. From Fig. 8 both pristine ZnO NRs and ZnO/Ag/Ag2WO4 heterostructure showed a reasonable response upon illumination by solar light, whereas the response at dark is relatively shows very low and flat curves were observed. However, the I–V curve of the ZnO/Ag/Ag2WO4 photo-electrode under simulated sun light confirms a higher photoelectric conversion than that of the ZnO NRs photo-electrode. The observed photocurrent density at the potential of 1.23 V (vs. Ag/AgCl) is 0.9 mA cm−2 for ZnO NRs and increased by factor of three to 3 mA cm−2 for the ZnO/Ag/Ag2WO4 photo-electrode. This result might be attributed to the higher separation and transportation of photo-induced charge carriers25 due to the presence of the Ag/Ag2WO4 particles that affected the band gap of the heterostructure. In addition to that, the presence of metallic Ag0 particles (as discussed above in the XPS analysis) would enhance the absorption of visible light and then improve the separation rate of the photo-generated electrons–holes pairs because of the SPR effect which can locally amplifies the incident electromagnetic field at the metal surface by several orders of magnitude.12,29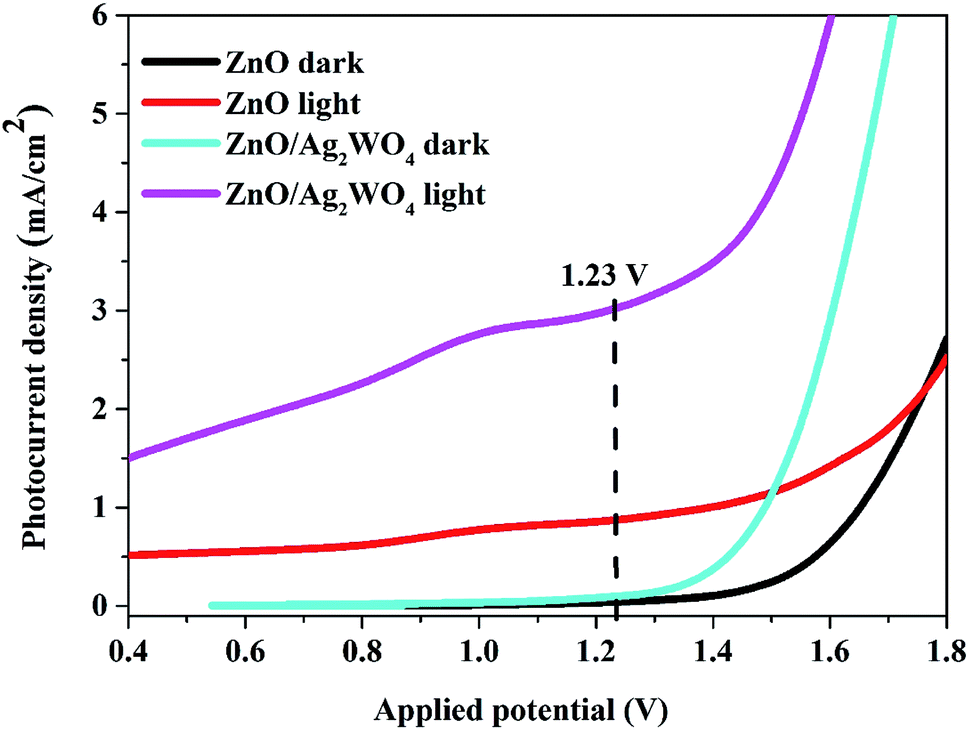 | ||
| Fig. 8 Linear sweep voltammetry curves of the ZnO NRs, and the ZnO/Ag/Ag2WO4 photo-electrodes under light and dark conditions. | ||
The photo response over time of the samples were investigated through the chronoamperometry measurements which record the photocurrent density versus time in dark (light off) and under illumination (light on) with an applied potential of 0.5 V as shown in Fig. 9. From Fig. 8 we could see the result with different amount of Ag/Ag2WO4 that was prepared by different SILAR cycles. It is clear that the photo response increases with increasing the number of SILAR cycles. However, the photocurrent is decreased when the deposition cycle increased up to 15 times. The possible reason for that is the effect of additional deposition cycles lead to the formation of larger aggregates around the ZnO NRs. In turn, this might cause a destruction of the junctions and the result of that is that the separation of the charge carriers at the interfaces of the heterojunction will be reduced. The photocurrent density of the ZnO was found to be 0.6 mA cm−2, and it is increased to 1.6 mA cm−2 after deposition of Ag/Ag2WO4 10 times on the ZnO NRs.
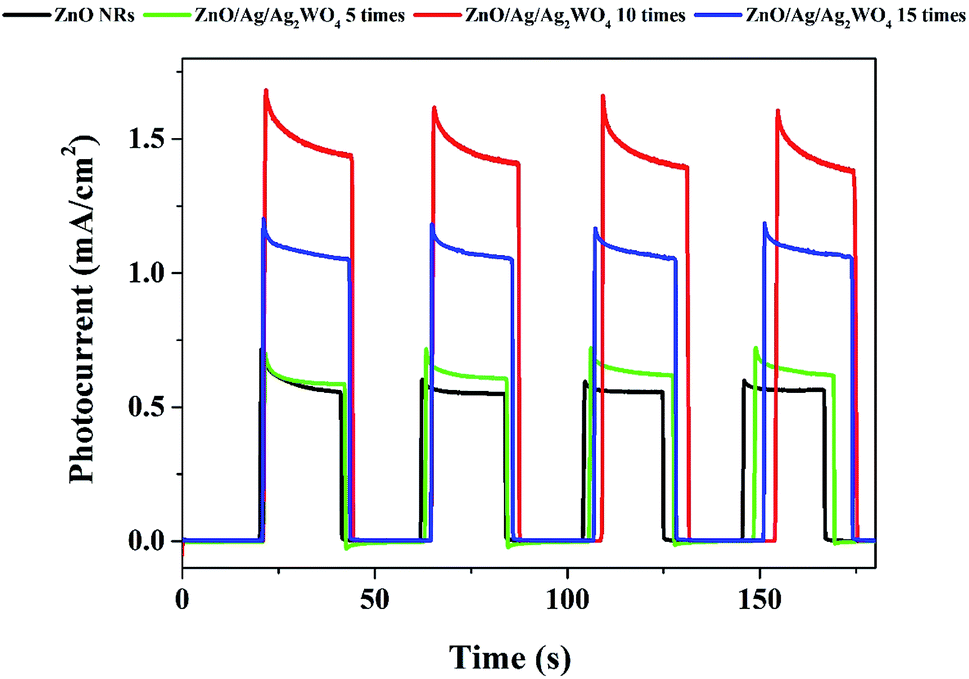 | ||
| Fig. 9 Chronoamperometry I–t curves of the ZnO NRs, and the ZnO/Ag/Ag2WO4 photo-electrodes under chopped illumination of solar light with applied voltage of +5 V with 20 s light on/off cycles. | ||
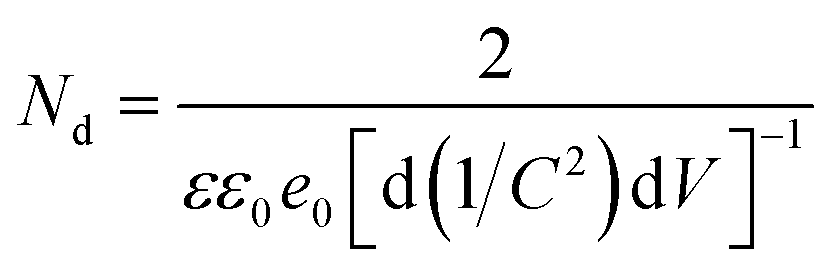
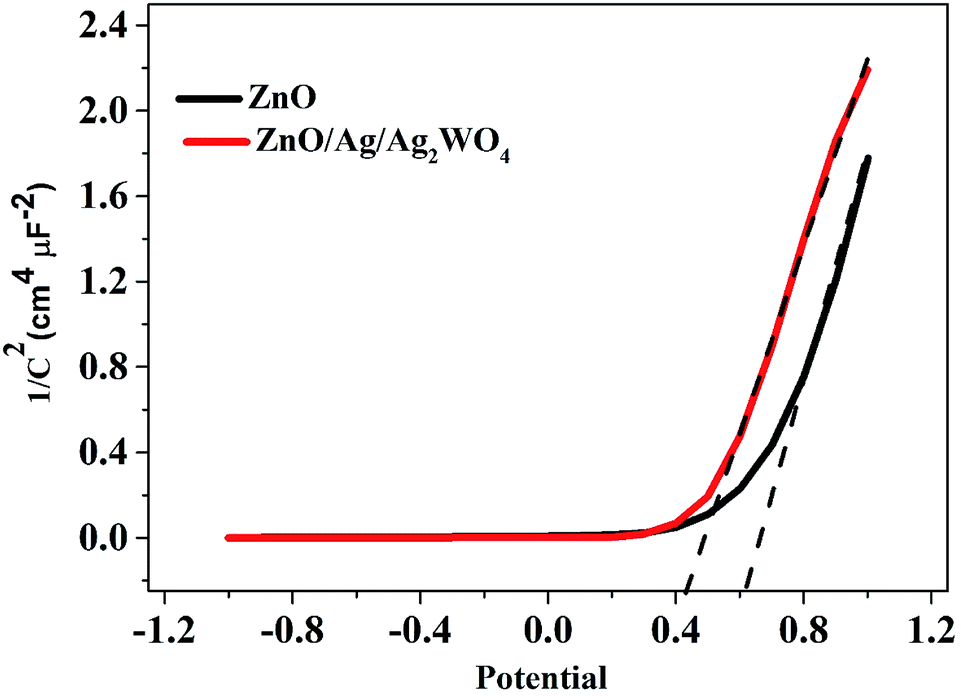
To understand the electronic properties of the ZnO/Ag/Ag2WO4 in contact with the electrolyte solution, we performed electrochemical impedance measurement in dark and Mott–Schottky (M–S) plot (1/C2 versus potential) was analyzed. One can extrapolate the position of the flat band potential VFB (versus Ag/AgCl) from the x-axis intercept at selected frequency (3 kHz), which was found to be +0.60 and +0.4 V for ZnO and ZnO/Ag/Ag2WO4 photo-electrodes, respectively (see Fig. 10). The shift in VFB is suggesting the presence of more surface states which could lead to considerable change in the band position.34,35 The positive slopes were determined from M–S plot indicated the n-type nature of the samples. From the dielectric constant of ZnO (ε = 10) and the permittivity of vacuum (ε0 = 8.85 × 10⁻¹⁴ F cm−1) the charge carrier density can be calculated from eqn (1)18,31
 | (1) |
 | ||
| Fig. 10 Mott–Schottky plots of 1/C2 versus applied potential (V) in complete darkness at a frequency of 3 kHz for the ZnO NRs, and the ZnO/Ag/Ag2WO4 photo-electrodes. | ||
The charge carrier densities were found to be ∼2.8 × 10¹⁹ and ∼2.5 × 1019 cm−3 for ZnO NRs and ZnO/Ag/Ag2WO4 photo-electrodes, respectively which are of the same order. The estimated values of flat band potential and charge carrier densities are in the agreement with those reported previously in the literature.26
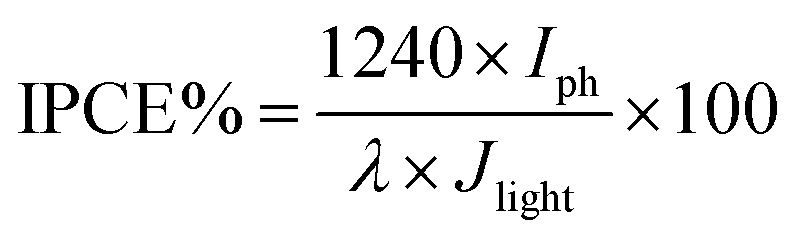
The incident photon to current conversion efficiency (IPCE) is used in PEC to measure the efficiency of converting an individual photon to an extractable electron. Which performed with a monochromator light source to have a spectral distribution that is selective by wavelength in the range (300–700 nm), and at the same time the current density generated at each wavelength were measured. Then IPCE is calculated from eqn (2):36,37
 | (2) |
Fig. 11 compares the IPCE curves for ZnO NRs, and ZnO/Ag/Ag2WO4 photo-electrodes. In general, the IPCE curves of the pristine ZnO NRs and the ZnO/Ag/Ag2WO4 photo-electrodes are consistent with the optical absorption spectra of the pristine ZnO NRs, and ZnO/Ag/Ag2WO4 photo-electrodes. The ZnO photo-electrode exhibits PEC activity on the UV region and exhibits some activities in the visible region but it is relatively weaker than that for the UV region. For the ZnO/Ag/Ag2WO4 photo-electrode, the photo response range of IPCE is slightly extended in the UV and visible light region in addition to the increase in IPCE, in accordance with the improved optical absorption including increased absorption and extended absorption region of the ZnO/Ag/Ag2WO4. The extension of the IPCE in the visible region between 400 to 450 is suggested to be due to the effect of SPR. The enhancement in the IPCE is more remarkable than the increase in optical absorption of the ZnO/Ag/Ag2WO4 as compared to that of the ZnO NRs, which is increased by factor of 1.5. At the wavelength 400 nm the IPCE value is 30% for ZnO/Ag/Ag2WO4 and 20% for ZnO NRs. This can be attributed to the role of Ag0 that is embedded during the sample preparation. The Ag0 is expected to facilitate the transfer of electrons generated in ZnO and Ag2WO4 under solar illumination in the PEC process.38
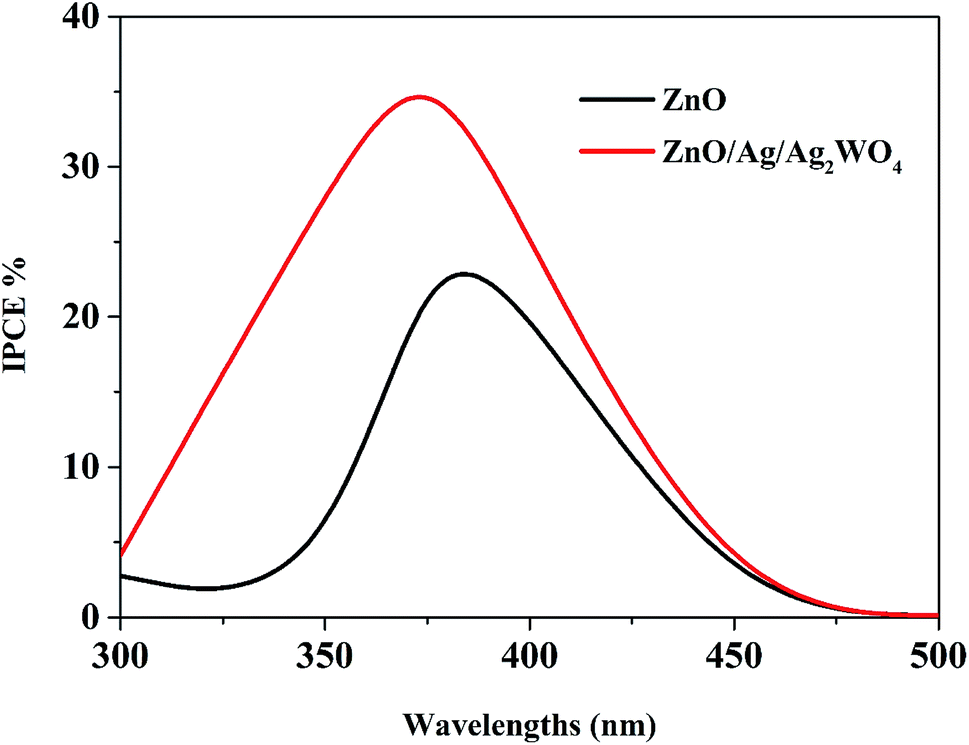 | ||
| Fig. 11 The plots of IPCE versus wavelength for the ZnO NRs, and the ZnO/Ag/Ag2WO4 photo-electrodes. | ||
3.3 Proposed photoelectrochemical mechanism for water oxidation
It is known to all that the enhancement of PEC activity of semiconductor-based photo-electrodes was mainly attributed to electrons and holes transfer at the interfaces of the photo-electrodes. It is clear that the band edge potential values of the ZnO and the Ag/Ag2WO4 materials played an important role in the efficiency of generation and separation process of the electrons and holes pairs. The conduction band (CB) and valence band (VB) edge potential of a semiconductor at the point of zero charge can be estimated by the Mulliken electronegativity theory:| EVB = X − Ee + 0.5Eg | (3) |
| ECB = EVB − Eg | (4) |
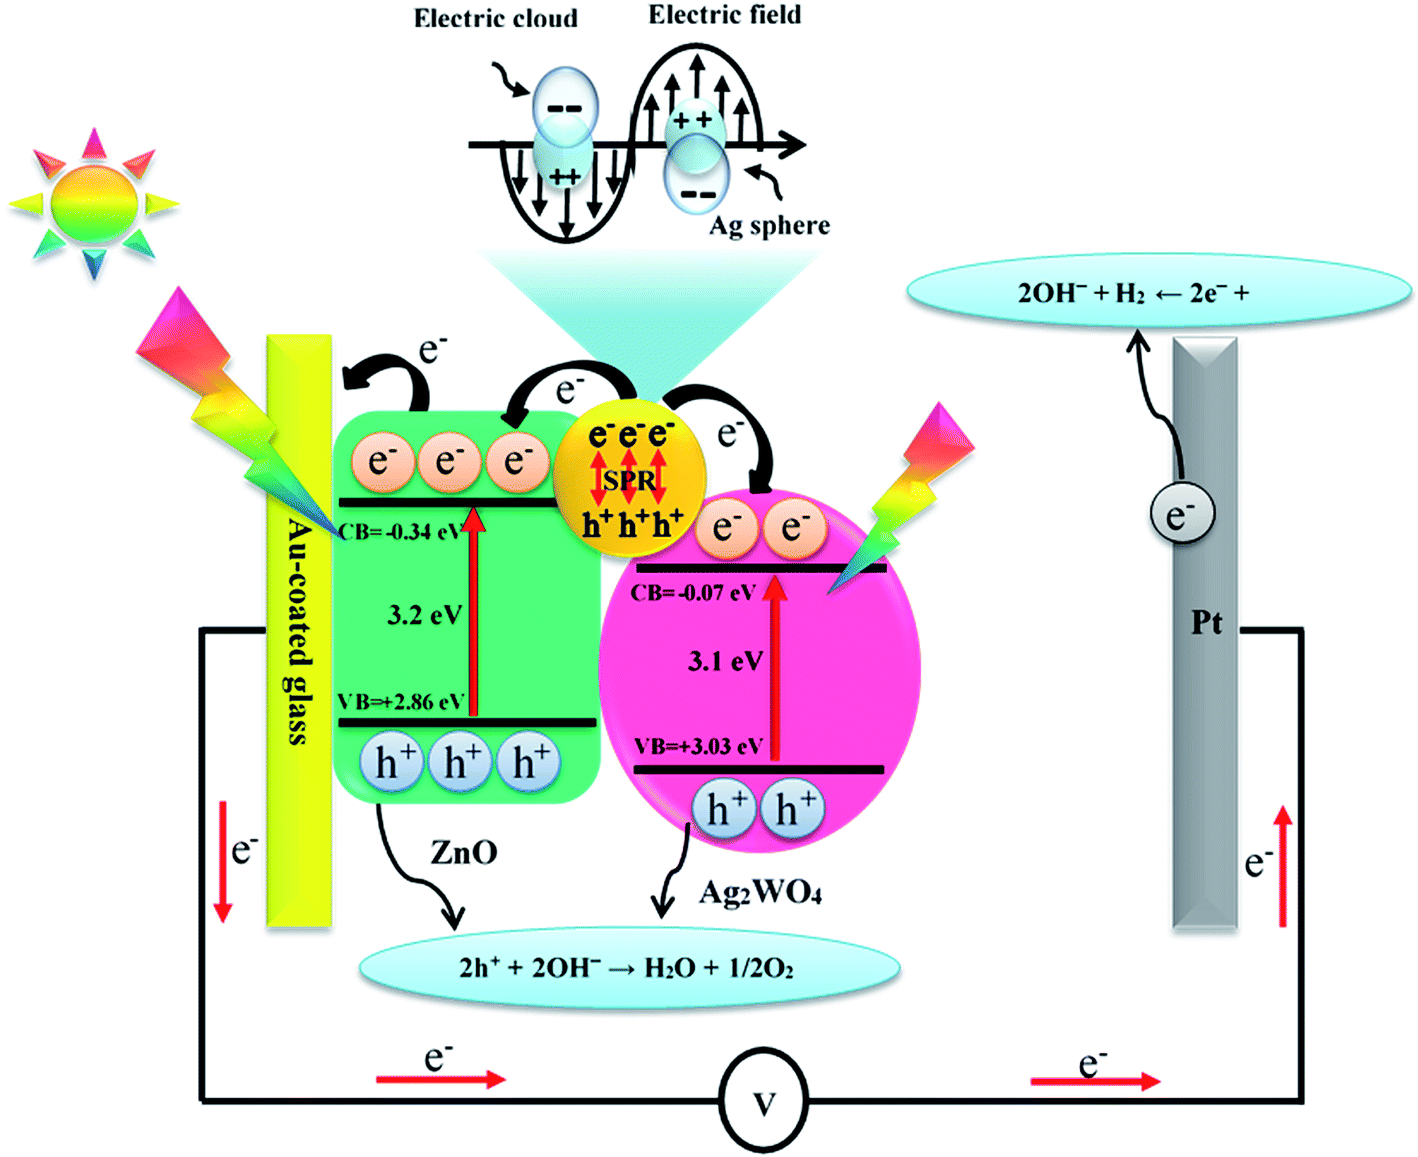 | ||
| Fig. 12 Schematic diagram showing the energy band structure and possible electron–hole separation and transportation in ZnO/Ag/Ag2WO4 heterostructure with SPR effect. | ||
4 Conclusion
In summary, we report a preparation of ZnO/Ag/Ag2WO4 photo-electrode for PEC water oxidation with surface plasmonic resonance behavior via low temperature hydrothermal chemical growth flowed by SILAR method. The structural and morphology characterization studies revealed that ZnO/Ag/Ag2WO4 heterostructure was prepared successfully. Whereas the EDX and XPS characterization confirms the elemental composition of ZnO/Ag/Ag2WO4 which consist of Zn, O, Ag, and W without any other elements detected, and the energy state of the elements on ZnO/Ag/Ag2WO4 heterostructure. ZnO/Ag/Ag2WO4 heterostructure shows an obvious red shift of the optical absorption in the visible region than that of pristine ZnO NRs with calculated optical band gaps of 3.2, and 3.1 eV for ZnO NRs and ZnO/Ag/Ag2WO4, respectively. Compared with ZnO NRs, the ZnO/Ag/Ag2WO4 exhibits a higher PEC performance. By the deposition of the Ag/Ag2WO4 on the ZnO NRs, a new heterostructure was obtained via SILAR method, leading to higher photocurrent of 3 mA cm−2 measured at 1.23 V (vs. Ag/AgCl) for ZnO/Ag/Ag2WO4, which is 3 times the photocurrent achieved by ZnO NRs photo-electrode. Also, the photo response over time shows a higher photocurrent for the ZnO/Ag/Ag2WO4 photo-electrode (1.6 mA cm−2) compared to that of the ZnO NRs photo-electrode (0.6 mA cm−2). In addition to that, the overall IPCE of the ZnO/Ag/Ag2WO4 photo-electrode was observed to increase by a factor of 1.5 compared to the ZnO NRs photo-electrode with extension of the IPCE curve in the visible light region due to the SPR effect. The high PEC performance of our samples could be attributed to the higher separation and transportation of photo-induced charge carriers. This is due to the enhancement in the absorption of visible light which improves the separation rate of the photo-generated electrons–holes pairs because of the band gap engineering and to the SPR effect of the metallic silver that was introduced during the sample preparation. Our study exposes the potential of ZnO/Ag/Ag2WO4 photo-electrode for high performance in PEC water splitting.Conflicts of interest
There are no conflicts of interest to declare.Acknowledgements
The authors acknowledge the department of Science and Technology (ITN), at Campus Norrköping, Linköping University, Sweden for partial financial support. Sami Elhag acknowledges the partial financial support from the Åedges through the project no 17-457.References
- D. Barreca, G. Carraro, A. Gasparotto, C. Maccato, T. Altantzis, C. Sada, K. Kaunisto, T.-P. Ruoko and S. Bals, Adv. Mater. Interfaces, 2017, 4, 1700161 CrossRef.
- S. Hernández, D. Hidalgo, A. Sacco, A. Chiodoni, A. Lamberti, V. Cauda, E. Tresso and G. Saracco, Phys. Chem. Chem. Phys., 2015, 17, 7775–7786 RSC.
- R. Zamiri, H. Abbastabar Ahangar, D. M. Tobaldi, A. Rebelo, M. P. Seabra, M. Shabani and J. M. F. Ferreira, Phys. Chem. Chem. Phys., 2014, 16, 22418–22425 RSC.
- H. Zhang, G. Chen and D. W. Bahnemann, J. Mater. Chem., 2009, 19, 5089 RSC.
- H. Ishihara, G. K. Kannarpady, K. R. Khedir, J. Woo, S. Trigwell and A. S. Biris, Phys. Chem. Chem. Phys., 2011, 13, 19553–19560 RSC.
- R. Zhou, S. Lin, H. Zong, T. Huang, F. Li, J. Pan and J. Cui, J. Nanomater., 2017, 2017, 1–9 CrossRef.
- Q. Liu, F. Cao, F. Wu, W. Tian and L. Li, RSC Adv., 2015, 5, 79440–79446 RSC.
- D. K. Bora and A. Braun, RSC Adv., 2014, 4, 23562–23570 RSC.
- Y. H. Ng, A. Iwase, A. Kudo and R. Amal, J. Phys. Chem. Lett., 2010, 17, 2607–2612 CrossRef.
- J. L. Yang, S. J. An, W. I. Park, G.-C. Yi and W. Choi, Adv. Mater., 2004, 16, 1661–1664 CrossRef CAS.
- S. G. Kumar and K. S. R. K. Rao, RSC Adv., 2015, 5, 3306–3351 RSC.
- D. M. Fragua, R. Abargues, P. J. Rodriguez-Canto, J. F. Sanchez-Royo, S. Agouram and J. P. Martinez-Pastor, Adv. Mater. Interfaces, 2015, 2, 1500156 CrossRef.
- Y. Qiu, K. Yan, H. Deng and S. Yang, Nano Lett., 2012, 12, 407–413 CrossRef CAS PubMed.
- R. Lv, T. Wang, F. Su, P. Zhang, C. Li and J. Gong, Nano Energy, 2014, 7, 143–150 CrossRef CAS.
- S. Xu and Z. L. Wang, Nano Res., 2011, 4, 1013–1098 CrossRef CAS.
- S. Baruah, S. S. Sinha, B. Ghosh, S. K. Pal, A. K. Raychaudhuri and J. Dutta, J. Appl. Phys., 2009, 105, 074308 CrossRef.
- M. Willander, M. Q. Israr, J. R. Sadaf and O. Nur, Nanophotonics, 2012, 1, 0006 Search PubMed.
- M. Willander, O. Nur, J. R. Sadaf, M. I. Qadir, S. Zaman, A. Zainelabdin, N. Bano and I. Hussain, Materials, 2010, 3, 2643–2667 CrossRef CAS.
- L. Cai, F. Ren, M. Wang, G. Cai, Y. Chen, Y. Liu, S. Shen and L. Guo, Int. J. Hydrogen Energy, 2015, 40, 1394–1401 CrossRef CAS.
- M. Pirhashemi and A. Habibi-Yangjeh, J. Colloid Interface Sci., 2017, 491, 216–229 CrossRef CAS PubMed.
- M. Pirhashemi and A. Habibi-Yangjeh, Ceram. Int., 2017, 43, 13447–13460 CrossRef CAS.
- Y. Wei, J. Kong, L. Yang, L. Ke, H. R. Tan, H. Liu, Y. Huang, X. W. Sun, X. Lu and H. Du, J. Mater. Chem. A, 2013, 1, 5045–5052 RSC.
- K. Vignesh and M. Kang, Mater. Sci. Eng., B, 2015, 199, 30–36 CrossRef CAS.
- J. Li, C. Yu, C. Zheng, A. Etogo, Y. Xie, Y. Zhong and Y. Hu, Mater. Res. Bull., 2015, 61, 315–320 CrossRef CAS.
- S. Zhang, Z. Liu, Y. Zhang, S. Gao, R. Jin and Q. Wang, Ceram. Int., 2018, 44, 6659–6665 CrossRef CAS.
- S. Elhag, D. Tordera, T. Deydier, J. Lu, X. Liu, V. Khranovskyy, L. Hultman, M. Willander, M. P. Jonsson and O. Nur, J. Mater. Chem. A, 2017, 5, 1112–1119 RSC.
- M. Zayats, A. B. Kharitonov, S. P. Pogorelova, O. Lioubashevski, E. Katz and I. Willner, J. Am. Chem. Soc., 2003, 125, 16006–16014 CrossRef CAS PubMed.
- M. Lanz, D. Schürch and G. Calzaferri, J. Photochem. Photobiol., A, 1999, 120, 105–117 CrossRef CAS.
- S. Elhag, Z. H. Ibupoto, V. Khranovskyy, M. Willander and O. Nur, Vacuum, 2015, 116, 21–26 CrossRef CAS.
- U. Y. Qazi and R. Javaid, Adv. Nanopart., 2016, 05, 27 CrossRef CAS.
- V. Etacheri, R. Roshan and V. Kumar, ACS Appl. Mater. Interfaces, 2012, 4, 2717–2725 CrossRef CAS PubMed.
- H. Alnoor, G. Pozina, V. Khranovskyy, X. Liu, D. Iandolo, M. Willander and O. Nur, J. Appl. Phys., 2016, 119, 165702 CrossRef.
- K. Dai, J. Lv, L. Lu, C. Liang, L. Geng and G. Zhu, Mater. Chem. Phys., 2016, 177, 529–537 CrossRef CAS.
- D. Liu, W. Huang, L. Li, L. Liu, X. Sun, B. Liu, B. Yang and C. Guo, Nanotechnology, 2017, 28, 385702 CrossRef PubMed.
- H. Zhang, G. Wang, D. Chen, X. Lv and J. Li, Chem. Mater., 2008, 20, 6543–6549 CrossRef CAS.
- A. Wolcott, W. A. Smith, T. R. Kuykendall, Y. Zhao and J. Z. Zhang, Small, 2009, 5, 104–111 CrossRef CAS PubMed.
- R. Dom, H. G. Kim and P. H. Borse, CrystEngComm, 2014, 16, 2432–2439 RSC.
- X. Yang, H. Li, W. Zhang, M. Sun, L. Li, N. Xu, J. Wu and J. Sun, ACS Appl. Mater. Interfaces, 2017, 9, 658–667 CrossRef CAS PubMed.
- M. Ghobadifard and S. Mohebbi, New J. Chem., 2018, 42, 9530–9542 RSC.
| This journal is © The Royal Society of Chemistry 2019 |