
 Open Access Article
 This Open Access Article is licensed under a Creative Commons Attribution-Non Commercial 3.0 Unported Licence
Multi-color carbon dots for white light-emitting diodes†
Rigu Sua,
Qingwen Guana,
Wei Caia,
Wenjing Yanga,
Quan Xu *a,
Yongjian Guob,
Lipeng Zhangb,
Ling Feic and
Meng Xu*d
*a,
Yongjian Guob,
Lipeng Zhangb,
Ling Feic and
Meng Xu*d
aState Key Laboratory of Heavy Oil Processing, China University of Petroleum (Beijing), 102249, China. E-mail: xuquan@cup.edu.cn
bCollege of Energy, Beijing University of Chemical Technology, Beijing, 102200, China
cChemical Engineering Department, University of Louisiana at Lafayette, Lafayette, LA 70504, USA
dDepartment of Orthopedics, General Hospital of Chinese People's Liberation Army, Beijing 100853, China. E-mail: drxm301@163.com
First published on 27th March 2019
Abstract
Heteroatom doped carbon dots (CDs) with color adjustable properties have attracted extensive attention. The doping of elements can effectively tune the surface chemical properties of CDs, thus resulting in its multi-functional applications such as in bio-imaging, photocatalysis, and photothermal conversion. The facile preparation of single metal-doped CDs with color-tunable properties has been rarely reported yet. Herein, we report a one-step solvothermal method to synthesize CDs with different fluorescent emission varying from red to purple to blue. The luminescence characteristic of CDs can be tuned by simply controlling the ratio of precursors, with the emission wavelength correspondingly adjusted from 610 nm to 390 nm. XPS investigation further demonstrated that the color variation is mainly due to the doping of zinc, which will increase the degree of surface oxidation in the as-prepared CDs. For blue emission CDs, the content of graphitic carbon gradually decreases with the rising of zinc chloride addition, while oxygen content remains around 20%, compared with red emission CDs of which the oxygen content is only 4.42%. We also demonstrated with theoretical simulations that the Zn dopant and the functional groups including –C![[double bond, length as m-dash]](https://www.rsc.org/images/entities/char_e001.gif) O, –C–OH, –NH2, and pyrrolic N, play an important role in color change. Furthermore, the synthesized CDs have been successfully used into the fabrication of white LEDs. More than that, we produced a sensitive sensor from the prepared CDs for the effective detection of a variety of colorless transparent organic solvents utilizing the robust fluorescence properties of CDs, showing their great potential as fluorescent probes for chemical sensing.
O, –C–OH, –NH2, and pyrrolic N, play an important role in color change. Furthermore, the synthesized CDs have been successfully used into the fabrication of white LEDs. More than that, we produced a sensitive sensor from the prepared CDs for the effective detection of a variety of colorless transparent organic solvents utilizing the robust fluorescence properties of CDs, showing their great potential as fluorescent probes for chemical sensing.
Introduction
Carbon dots (CDs), as carbon materials, are fluorescent nanomaterials composed of carbon skeletons and surface functional groups with particle size less than 10 nm. They possess low toxicity,1 excellent optical and electrical properties,2,3 superior photo stability,4 high quantum yield (QY),5 exceptional productivity, and low cost,6 CDs have become a research hotspot for a long lifetime. Their unique optical properties and robust water solubility greatly expand their application fields, for instance, ions and DNA detection, catalysis, solar cells, and photothermal therapy.7–10 Since the first discovery of CDs in 2004, rapid development in synthetic methods has been seen in the past fourteen years, which can be attributed to two major categories, “Top-down” and “Bottom-up” synthesis. The former mainly includes methods like arc discharge,11 laser ablation12 and electrochemical etching,13 while the latter usually utilizes microwave,14 thermal combustion,15 template,16 and ultrasonic8 in the synthetic methods. Up to now, the quantum yield (QY) of CDs can reach up to 94% for bright blue emission17 and 53% for red emission.5However, efficient multicolor emissive CDs are still highly desired. There are only a few reports on the synthesis of multicolor emissive CDs available. For example, Ding et al. prepared multicolor emissive CDs with PL QY up to 35% via hydrothermal reaction processes with water as solvent and p-phenylenediamine (PPD) as a precursor.18 Guo et al. produced a series of CDs by varying the functional precursors, and concluded that variations in surface states and N contents were predominantly responsible for the PL red shift.19 Zhu et al. have reported three types of CDs with blue, green, and red emission by simply changing the reaction solvent and then successfully fabricated light emitting diodes (WLEDs).20 Recently, Miao's group synthesized multicolor CDs by modifying the thermal pyrolysis temperature and ratio of reactants, and ascribed the PL red shift to both the extent of graphitization and the amount of surface functional groups, –COOH.21 Despite these effort, the reported materials are still too expensive for practical applications and lack of clear understanding of their luminescence mechanism. Therefore, simple and facile synthesis routes are still highly desirable.
Herein, on the basis of predecessors'work,22 we report a synthesis strategy to prepare multiple color emissive CDs by tuning the effective conjugation length and the surface functional groups. The CDs were synthesized through controlling the molar ratios of PPD and ZnCl2 in ethanol solvent. By adjusting the precursor molar ratios, the maximum emission of the resulted CDs gradually shifts from red to blue light in the following order: red, purplish red, purplish blue, and blue, respectively. In another word, controlling the extent of graphitization and the amount of surface function groups can tune the emission wavelength of CDs from 390 to 610 nm. The relative photoluminescence quantum yields of the four CDs can reach up to 5.97%, 6.24%, 6.92%, and 19.81%, respectively. In short, we have prepared highly efficient multiple color emissive CDs from same precursors in a single step.23 We have also theoretically studied the reason why the synthesized four CDs samples show different PL emission by using the first principle theory simulation and Gaussian 09 package. We further fabricated pure white LEDs with coherent infrared energy (CIE) color coordinate of (0.3301, 0.3367), correlated color temperature (CCT) of 5598 K and color rendering index (CRI) of 89 by using the prepared CDs. Moreover, we demonstrated that the CDs can be dissolved in various polar organic solvents such as ethanol, dimethylformamide (DMF), dimethylsulfone (DMSO), dioxane, amine and so on and those can be used as robust bioprobes in environmental and biomedicine applications.
Results and discussion
The schematic synthesis process of CDs with red, purplish red, purplish blue, and blue emission, is shown in Fig. 1. In detail, PPD (p-phenylenediamine) and ZnCl2 was mixed in an ethanol solution, followed by solvothermal treatment at 200 °C with a reaction time of 4 h. Adding the appropriate amounts of zinc chloride based on the experimental design can result in the blue shifts of CDs in the photoluminescence (PL) emission (further details available in Experimental section). The yield of the Zn-CDs with precursor ratio of 1![[thin space (1/6-em)]](https://www.rsc.org/images/entities/char_2009.gif) :1 by this facile solvothermal strategy is as high as 19.81%, which is suitable for industrial-scale production.5 In addition, the as-prepared CDs can be dispersed within a variety of common solvents to form clear solutions. Their corresponding fluorescent powder can be obtained by further drying the CDs samples in the oven at 60 °C for 4 hours, which has good fluorescence effect and is stable for a long time as well.
:1 by this facile solvothermal strategy is as high as 19.81%, which is suitable for industrial-scale production.5 In addition, the as-prepared CDs can be dispersed within a variety of common solvents to form clear solutions. Their corresponding fluorescent powder can be obtained by further drying the CDs samples in the oven at 60 °C for 4 hours, which has good fluorescence effect and is stable for a long time as well.
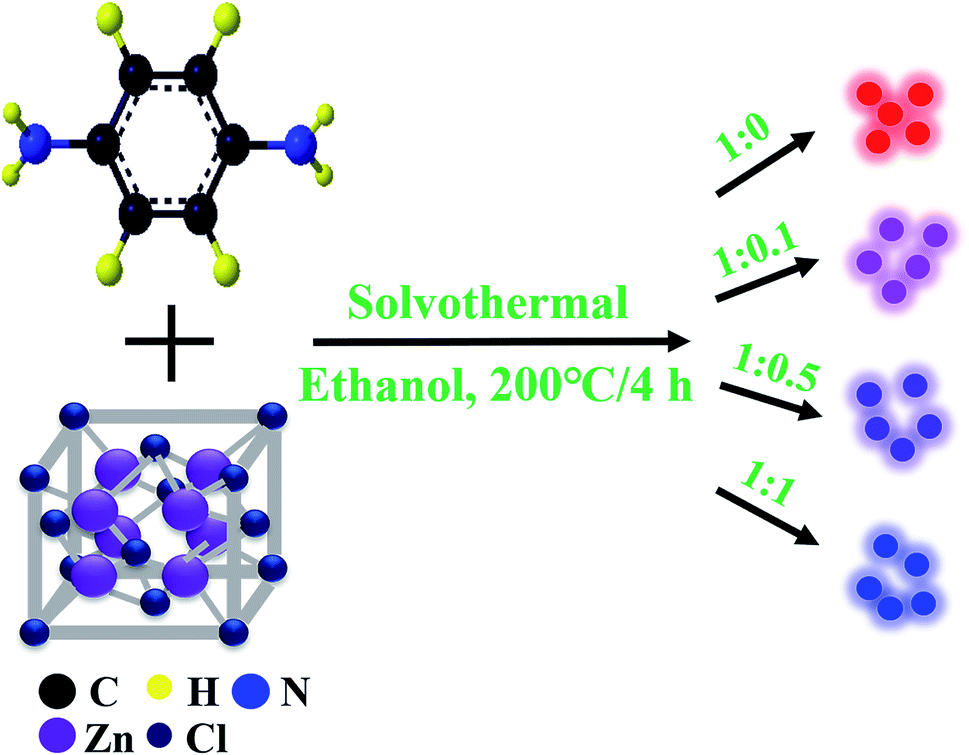 | ||
| Fig. 1 Schematic illustration of the solvothermal preparation process for CDs with different precursor ratios. | ||
To explore the morphology of the prepared CDs, both TEM and AFM images were taken in this research. Fig. 2(a) and (b) shows the typical TEM images of the two CDs samples with precursor ratio of 1:0 and 1:1. Insets are the particle size distribution maps. As can be seen, the CDs samples show different degrees of aggregation but with quite good dispersity in the solvent even observed under lower magnification. Moreover, they have very similar sizes distribution and morphologies. The average sizes of the two selected CDs were determined to be 5.24 and 5.15 nm, respectively. Corresponding AFM images are shown in Fig. 2(c) and (d), we can see that both of the two different CDs are monodisperse with an average topographic height of 4.56 and 4.12 nm, which is very close to the observation from their corresponding TEM images. The HRTEM images of the four different CDs are shown in Fig. 2(e–h), respectively, revealing a well-resolved lattice spacing of 0.21 nm, which can be attributed to the (100) lattice plane of graphite. It also can be observed that the CDs is highly monodispersed and has a shape of spheroid with similar size. Therefore, we can conclude that size effect can be neglected and the color change discussed in later sections has nothing to do with it.
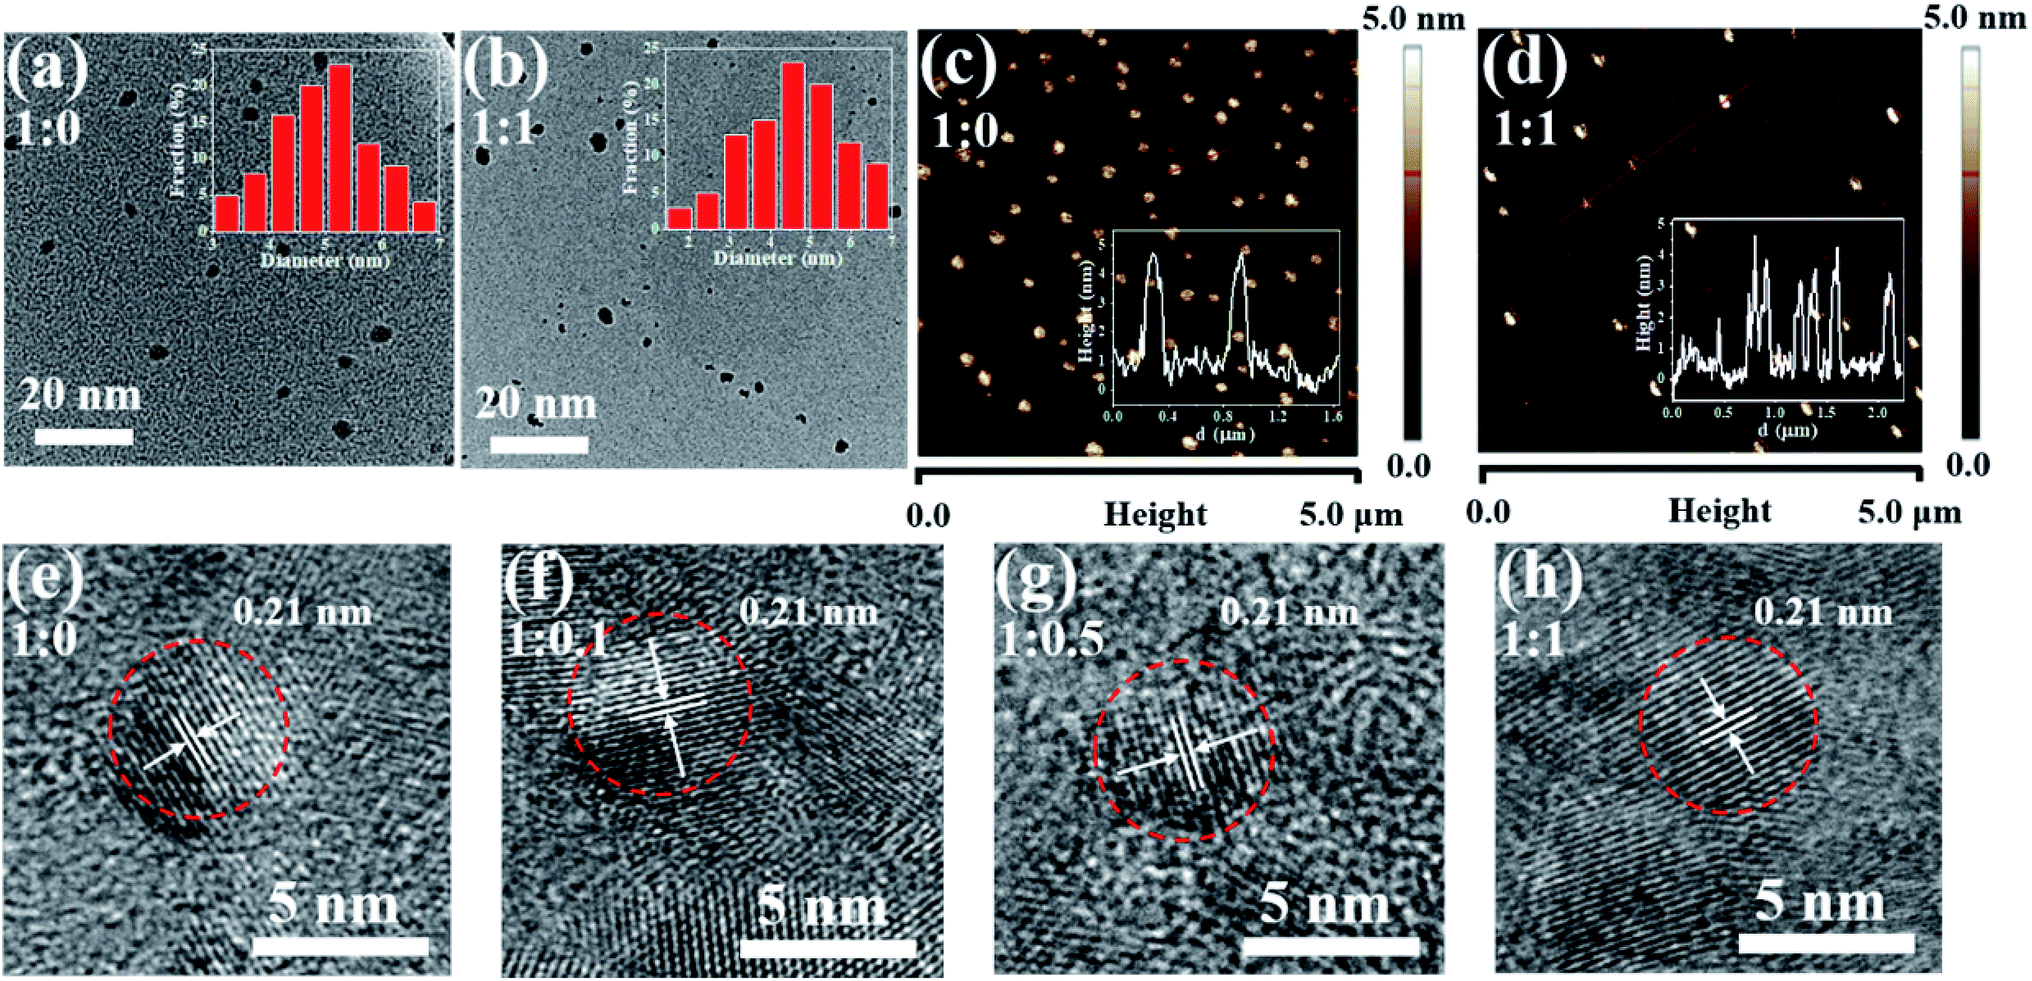 | ||
| Fig. 2 (a and b) Representative TEM (insets are the particle size distribution histogram of CDs) and (c and d) AFM topography image (insets are height distributions of CDs) of the two CDs samples with precursor ratio of 1:0 and 1:1. (e, f, g and h) HR-TEM images of the four different CDs samples with precursor ratio of 1:0, 1:0.1, 1:0.5, and 1:1, respectively. | ||
The PL of the as-synthesized CDs were studied in detail. The PL spectrum of CDs excited from 300 nm to 600 nm are shown in Fig. 3(a–d), indicating four different color-emissive CDs have been successfully synthesized. They are named red, purplish red, purplish blue and blue, respectively, corresponding to CDs with the precursor ratio of 1:0, 1:0.1, 1:0.5, and 1:1. The CDs–ethanol solution display bright fluorescent colors from red to blue under UV light, which can even be easily perceived with the naked eyes. The optimal excitation and emission wavelength of the four CDs are almost the same in red and blue band, which can be seen in Table 1. As the excitation wavelength changes, the emission peak position remains unchangeable, which again confirmed the homogeneous surface structure and narrow size distribution of the as-synthesized CDs. The blue band shows the classical excitation-dependent property and gradually increases, while the red band exhibits the opposite trend for CDs with precursor ratio of 1:0 to 1:1. This interesting phenomenon can be assigned to the intrinsic and defects emission.24,25 The contour plot (Fig. S1, ESI†) and 3D plot (Fig. S2, ESI†) of the four CDs show the corresponding photoluminescence spectra, which reflect the change trend of the fluorescence properties of the four CDs in a more intuitive way.
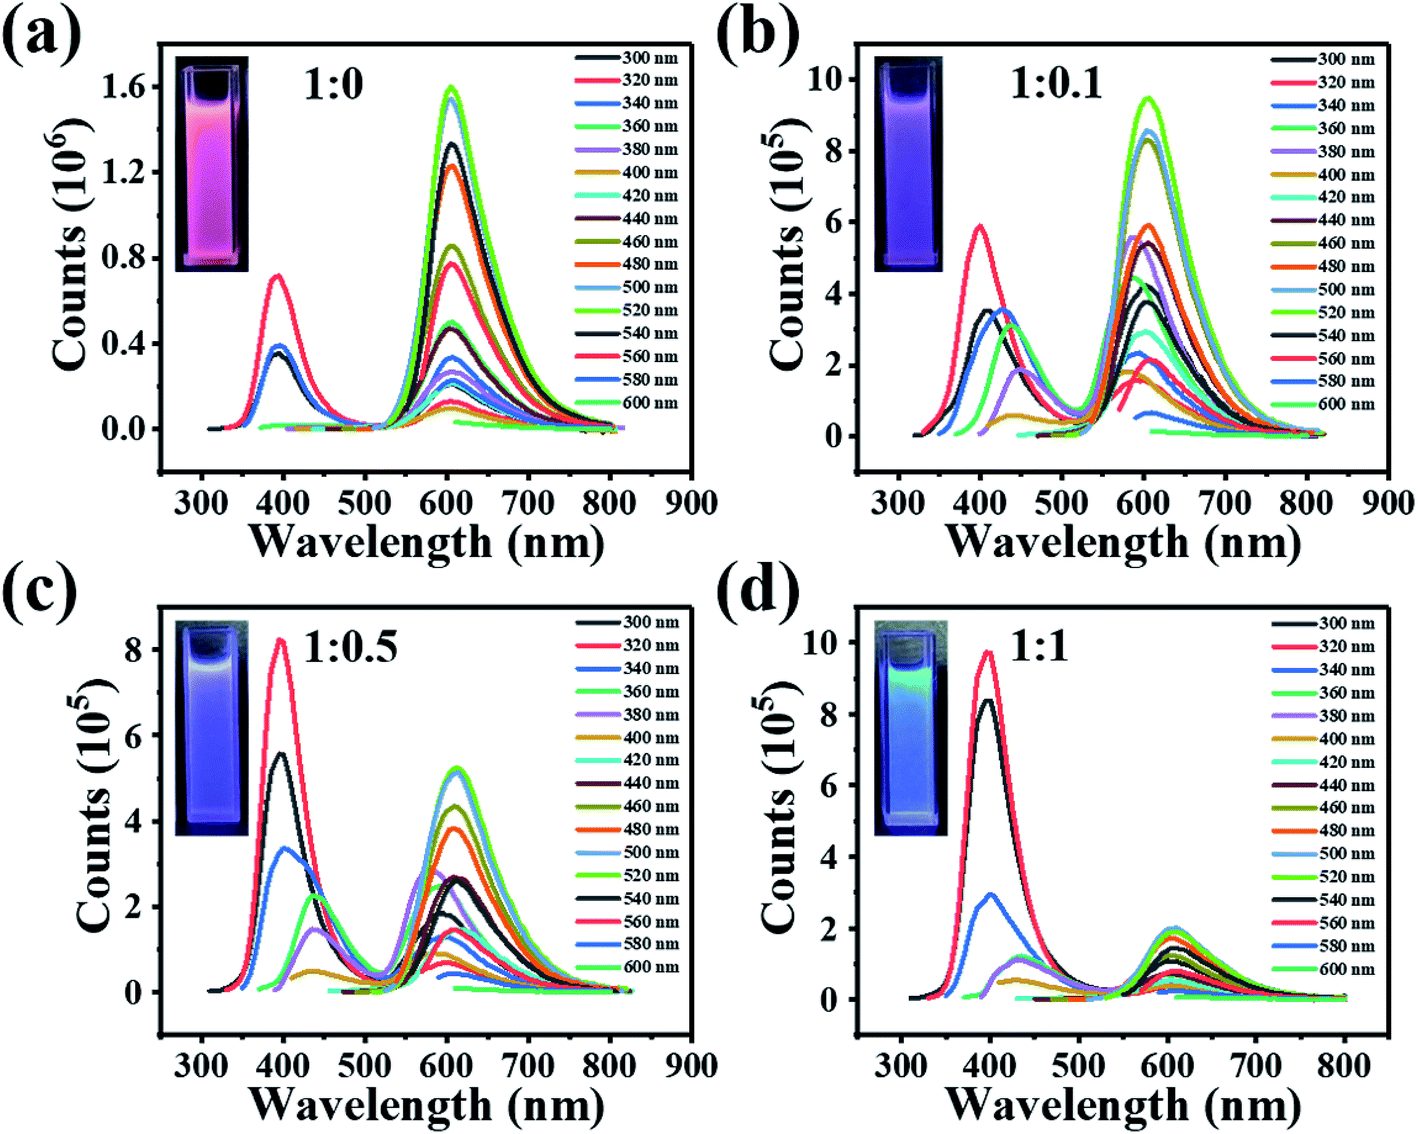 | ||
| Fig. 3 PL spectrum excited from 300 nm to 600 nm for the different CDs samples. (a) 1:0, (b) 1:0.1, (c) 1:0.5, and (d) 1:1. Insets in the left are the corresponding pictures of the four CDs samples under the UV lamp. | ||
:0, 1:0.1, 1:0.5, and 1:1
| Sample | Ex (nm) | Em (nm) | QY (%) | Lifetime (ns) | ||
|---|---|---|---|---|---|---|
| B band | R band | B band | R band | |||
| 1:0 |
320 | 520 | 390 | 610 | 5.97 | 9.184 |
| 1:0.1 |
320 | 520 | 390 | 610 | 6.24 | 9.001 |
| 1:0.5 |
320 | 520 | 390 | 610 | 6.92 | 8.998 |
| 1:1 |
360 | 520 | 450 | 610 | 19.81 | 8.154 |
The UV-vis absorption spectra of the four CDs were also measured and shown in Fig. 4(a). The spectra of the four different CDs display analogous characteristics. The absorption profiles of the samples demonstrate multiple electronic absorption transitions and can be divided into three bands, for simplicity, they are named as: band (I), (II), and (III), respectively. According to previous reports,25 band (I) from 200 nm to 270 nm could be assigned to intrinsic state (π–π*) transition from the aromatic sp2 domains (CC and CN). While band (II) from 280 to 380 nm comes from defect states (n–π*), which mainly include oxygen functional groups C–O and CO, and the hollow around 300 nm is a background from the spectrometry.26,27 Finally, a strong band (III) from 380 nm to 800 nm was also observed, which is usually assigned to the surface groups transition. However, in the lower-energy region, the four spectra exhibit similar absorption bands at 250, 300, 420, and 530 nm, indicating that these samples possessed similar surface states. Furthermore, as shown in Fig. 4(b), the two main photoluminescent excitation (PLE) bands around 240 nm and 320 nm match well with the absorption band (I) and band (II), indicating that the blue band is from a combination of intrinsic (sp2 graphite structures) and defects transitions (sp3 matrix).28 The red band demonstrates excitation-independent emission properties. From the corresponding PLE spectra (Fig. 4(c)), it can be seen that the three bands correspond to the absorption bands (I), (II), and (III), respectively.
 | ||
| Fig. 4 (a) Absorption spectra for the four different CDs samples with precursor ratio of 1:0, 1:0.1, 1:0.5, and 1:1, respectively. Photoluminescent excitation (PLE) spectra for (b) blue and (c) red bands for CDs of different precursor ratio. PL decay spectra of (d) CDs solution and (e) CDs phosphor from the four different CDs samples of precursor ratio of 1:0, 1:0.1, 1:0.5, and 1:1. (f) Zn2p analysis of the CDs at different mass ratios of phenylenediamine and zinc chloride. | ||
The fluorescent lifetime decay for the four CDs solutions and their corresponding solid samples after drying were also measured and shown in Fig. 4(d) and (e). The lifetime difference of the four CDs is not large, especially for their fluorescent powder. This again verifies that the four different CDs have similar size. Specifically, the lifetime of our CDs diluted 100 times in 99.7% ethanol at room temperature is 9.184, 9.001, 8.998, and 8.154 ns, respectively. Meanwhile, the lifetime of CDs phosphors is 3.195, 3.079, 2.876, and 2.510 ns, respectively. According to previous reports, this may be due to solvent effect between CDs and ethanol.29,30
To know more details about the surface chemistry, the CDs are further analyzed with XPS. The elemental content analysis in Table S1 (ESI†) demonstrates that all four CDs have the same elemental composition (i.e. C, N and O). Their deconvoluted spectra also indicate that they contain the same chemical bonds. Though Zn2p spectra (Fig. 4(f)) generated only a weak signal in XPS, the Zn LMM spectrum (Fig. 5(a)) provided very useful information on the chemical environment of Zn. As the precursor ratio increased, the Zn LMM peak was shifted to a higher binding energy, indicating the higher oxidation state of Zn.31 Through careful examination of XPS survey spectra (Fig. 5(b)) and the characterization data (Table S1, ESI†), only the oxygen (4.42%, 21.66%, 19.59% and 16.29% for the four CDs, respectively) and nitrogen content (19.23%, 1.58%, 5.62% and 10.01% for the four CDs, respectively) of the four different CDs were found to be distinctly different. These variations are believed, at least partly, to be responsible for the different PL characteristics of the four CDs, but more in-depth studies are still required to address this issue. TEM images of various carbon dots samples were measured, but there is no obvious relationship between the carbon dots particle size and their fluorescence. Although there are reports of fluorescence changes caused by nanoparticles' size, obviously, it is not the situation here. So the color change is not caused by size effect. XPS analysis indicates that the four kinds of CDs possess identical element composition (except for CDs-1 not containing Zn) and functional groups but only show difference in content, especially for carbonyl group, which the final result is a difference in the surface state, thus leading to different emission properties. Although the mechanism is not fully revealed, the tunable fluorescence of carbon-dots are related to the interfacial effect of the surface of carbon dots and passive surfactant. The C 1s spectrum (Fig. 5(c)) shows two characteristic peaks located at 284.3 and 288.4 eV, corresponding to the sp2 graphitic CC structure and CO, respectively. The CDs exhibited a large CO peak after adding ZnCl2, implying a higher oxidation state of CDs. The XPS peak fitting analysis is shown in Fig. S3 (ESI†). Combined with Table S2 (ESI†) we can clearly observe that graphitic carbon is decreasing but the degree of oxidation is rising, which is one of the reasons that CDs have the shift from red to blue. The O 1s spectra peaks were centered at 532.2 eV (Fig. 5(d)). This result confirms the oxidation in the structure of the carbon dots. It is also found that CDs with precursor ratio of 1:0 is distinctly different from the other three. As revealed in the O 1s peak fitting analysis spectra (Fig. S4, ESI†), unlike the other three samples, there is no carbonyl group in CDs with precursor ratio of 1:0. Table S3 (ESI†) lists specific values. N doping is confirmed with the high-resolution N 1s. The N 1s XPS spectra (Fig. 5(e)) has a comparatively weak signal, indicating an ultra-low doping of the N-CDs. The N 1s peak is located around 398 eV, implying the major state of the doped N is pyrrolic, rather than graphitic. This suggests that some N was doped in the edge or defect area of the CDs' graphitized structure. In addition, it is noted from Fig. S5 (ESI†) that the existence of the amino N increases as the reagent ratio increased. Table S4 (ESI†) shows the specific content change of two states of nitrogen. As the proportion of the precursor goes up, pyrrolic N decreases while amino N increases. Additionally, there's no amino N in CDs with precursor ratio of 1:0 and 1:0.1. This is another cause for the change in color.
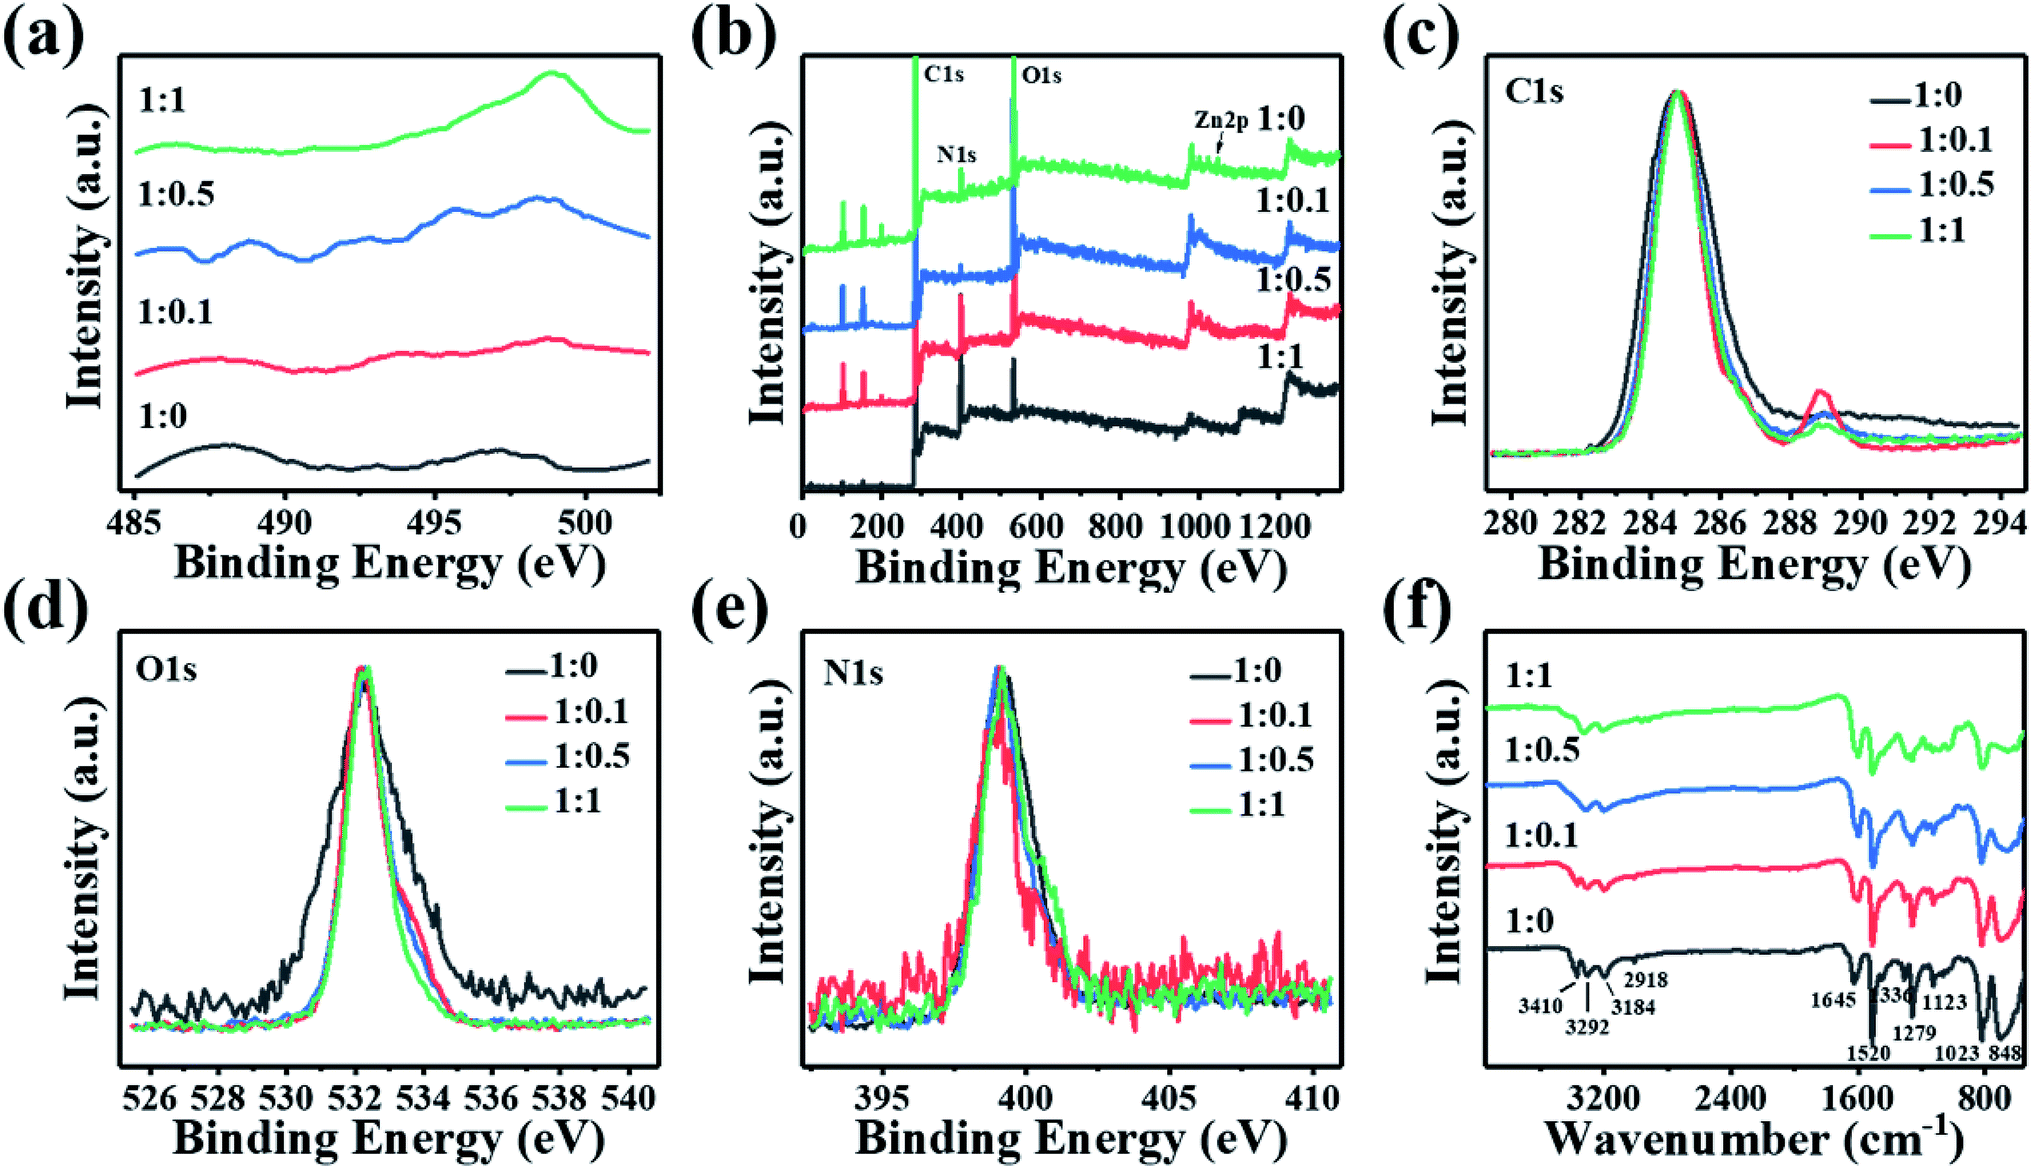 | ||
| Fig. 5 (a) LMM spectrum, and (b) XPS survey spectra of four different CDs samples of precursor ratio of 1:0, 1:0.1, 1:0.5, and 1:1, respectively. High-resolution (c) C1s, (d) O1s and (e) N1s spectra for the four different CDs samples. (f) FTIR spectra for the four different CDs samples. | ||
Fourier transform infrared (FTIR) were carried out to characterize the chemical bonds on these CDs. As shown in Fig. 5(f), the four CDs exhibit similar IR spectra, thus revealing the existence of similar chemical bondings. Notably, some characteristic peaks emerged at about 3300 cm−1 for all the four CDs, which correspond to two types of amino groups: primary amine (–NH2) and secondary amine (–NH–). The peaks at 2918 cm−1, 1336 cm−1, and 1123 cm−1 can be attributed to aliphatic C–H, C–N, and C–O stretching vibrations, respectively, implying decomposition, intermolecular cyclization, and condensation reactions occurred during the formation of CDs. Other functional groups can also be observed, including C–H (2918 cm−1), CN (1645 cm−1), CC (1520 cm−1), and H–N (1279 cm−1). It can be seen obviously from the FTIR spectra that the intensity of all the existing peaks gradually decreases as the CDs' precursor ratio goes from 1:0 to 1:1. For the peak at 3410 cm−1, it even disappeared in CDs with precursor ratio of 1:0.5 and 1:1.
Fig. 5(a), the LMM spectrum further proves the high oxidation state of Zn. Comprehensive analysis of the spectroscopic results pointed towards the mechanism behind the precursor ratio-dependent PLQY of Zn doped CDs. The OH groups due to their electron accepting nature can behave as a centre for fluorescence quenching.32 During primary stage, as more Zn was added to the reaction mixture, the inbound Zn will react with the OH groups reducing them (indicated by the decrease in the intensity of OH bending vibration in the IR spectrum) with a concomitant oxidation of Zn (as evidenced by the increase in the oxidation state of Zn in the LMM spectra). Hence, it can be concluded that during primary stage, Zn acts as a reducing agent for the OH group. However, in the latter stages, when the concentration of Zn becomes higher, in addition to reducing OH groups, the excess Zn can also react with CO on the CD's surface. This reaction results in the reduction of CO content. It is well established that CO is an important passivation resource for CDs and the presence of CO is critical for the PLQY. This understandably leads to the reduction of PLQY. It is also reported that external addition of Zn2+ can quench the fluorescence of carbon dots via a similar mechanism as the observed lower PLQY in CDs with a high Zn2+ content.33
In order to study the mechanism and the reason why the synthesized four CDs samples show different PL emission, we explored how the Zn dopant and the functional groups including –CO, –C–OH, –NH2, and pyrrolic N on CDs affect the PL emission spectrum by the first principle theory simulation. All calculations were carried out using the Gaussian 09 package.34 The ground state (S0) geometries of different CDs, which are listed in Tables S5 and S6 (ESI†), were optimized by the density functional theory (DFT) B3LYP (Becke's three-parameter hybrid function with the non-local correlation of Lee–Yang–Parr) method.35 We choose the basis set as the B3LYP/6-31G(d). The HOMO–LUMO energy gap of these CDs was calculated to explain how the Zn dopant and the radicals affect the PL emission spectrum.
In our CDs models, Zn heteroatom, pyrrolic N, –NH2, CO, C–OH have all been taken into consideration. Based on the HOMO–LUMO energy gap of CDs in Table S5 (ESI†), it can be observed that sole pyrrolic N has the blue-shift effect on the PL emission of the CDs, sole –NH2 has the red-shift effect, sole CO shows blue-shift effect, and sole –OH shows the red-shift effect.36 However, as simultaneously considering the effect of several functional groups, it is too complicated and too hard to say how a certain functional group affect the PL emission. For example, by comparing the HOMO–LUMO energy gap of CDs models a and d in Table S6 (ESI†), we can obtain that as the number of Zn dopants increase, the HOMO–LUMO energy gap increases (shown as Fig. 6(a) and (d)), corresponding to the observation that the PL emission spectrum gets blue-shift. However, by comparing the CDs models b and c in Table S6 (ESI†), we easily can find that the HOMO–LUMO energy gap of the former one is larger, in which the doping of Zn atoms was considered. The above results show that the Zn doping displays a red-shift effect on the PL emission. Here, we should also pay attention to the fact that the state of N on the two CDs models is also different in addition to the difference of Zn doping effect observed between the a and c models (or b and d models). The pyrrolic N on b CDs model was switched to the amino N on d CDs model. Based on the analysis above, we can obtain that the effect of Zn doping leading to either red-shift or blue-shift PL is depended on the functional groups on the CDs, which was demonstrated by comparing the HOMO–LUMO energy gap of different CDs models. In summary, among the CDs models we built, if the CDs show a lower oxidation state (containing less CO group), the Zn dopant and amino N synergistically make the PL emission blue-shift (shown as model d in Table S6 (ESI†) and Fig. 6(d)), while the Zn dopant and pyrrolic N make the PL emission red-shift (shown as model c in Table S6 (ESI†) and Fig. 6(c)); if the CDs show a higher oxidation state (containing more CO), the doped Zn and pyrrolic N synergistically make the PL emission blue-shift (shown as model f in Table S6 (ESI†) and Fig. 6(f)).
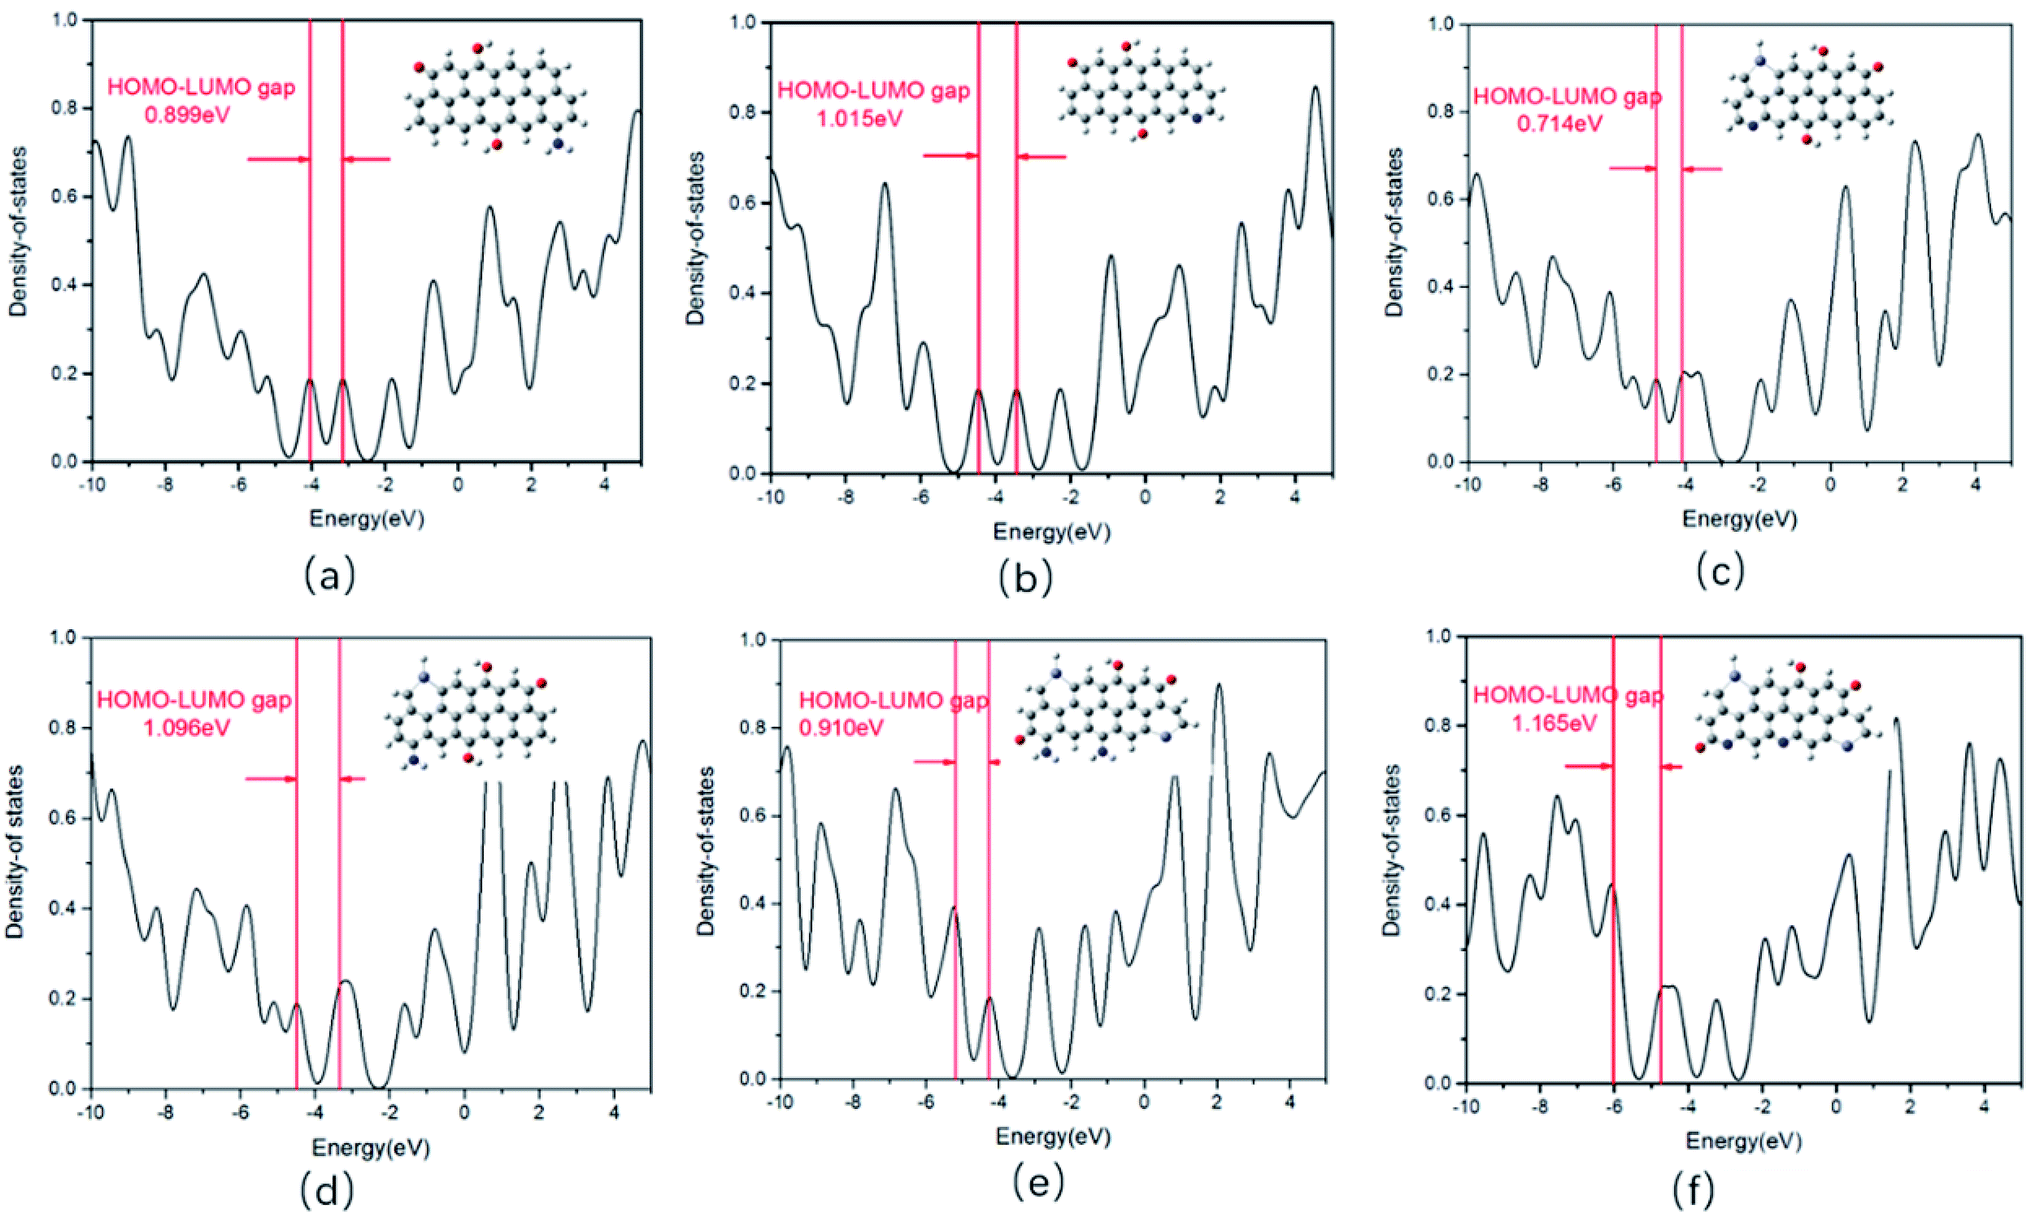 | ||
| Fig. 6 (a–f) Density of state and HOMO–LUMO energy gap for different CDs models. | ||
To fabricate the white LEDs, the two kinds of CDs with precursor ratio of 1:0 and 1:1 were mixed together into PVP with the volume ratio of 1:2. Then 5 mL of ethanol were added into the mixture. In the following step, the solution were drop-casted on the LED chip for the encapsulation of chip. By varying the volume ratios of two CDs, the emission spectra of white LEDs can be tuned to pure white light with optimize volume ratio of CDs in PVP composite which is 1:2. The coherent infrared energy (CIE) color coordinate of white LEDs is (0.3301, 0.3367) in white light region (Fig. 7(a)), which is closer to natural white light than previously reported WLEDs produced by the CDs.37,38 The correlated color temperature (CCT) and color rendering index (CRI) of the white LEDs are 5606 K and 89, respectively. The emitting light spectrum shown in Fig. 7(b) covers most of the visible-light from 400 to 670 nm, suggesting that the prepared CDs have great potential for white lighting application. There is no photo bleach for CDs based white LED devices. In addition, we also succeeded in producing red, yellow, blue, and white LEDs (Fig. 7(c)), which confirms the possibility of the CDs as potential phosphors for LEDs. The above data proves that the zinc doping method be a promising improvement for optoelectronic components. Particularly, the blue-shift effect of synthesized CDs will serve as a novel fluorescent nanomaterial that would lay a foundation for future enrichment in the optoelectronics field. Compared with other LEDs, it has the advantages of simple operation, low toxicity, simple preparation, long life and good fluorescence effect. Therefore, the as-prepared warm white-light emissive film shows promising potential for the lighting application.
 | ||
| Fig. 7 Characterization of white LEDs fabricated using the prepared CDs. (a) The CIE color coordinate, and (b) the emitting light spectrum of white LEDs. (c) The photographs of white and the monochrome red, yellow and blue LED devices by coating CDs/PVP on the different chips. | ||
Furthermore, we also use the prepared CDs for the detection of organic solvents. In this study, the synthesized-CDs were dissolved in a variety of colorless transparent organic solvents. Due to different solvent interaction strength, CDs fluorescence intensity is weakened to different degrees, which provides a strong theoretical basis for detecting different solvents. Here, fluorescence spectra of CDs with precursor ratio of 1:0 were measured by adding water and twelve other organic solvents (including ethyl acetate, ethanol, petroleum ether, acetone etc.), as shown in Fig. S6 (ESI†). From the image, we can see fluorescence intensity is extremely low in water and formamide, suggesting they can quench the fluorescence of the prepared CDs. It also gradually decreases in polyethylene glycol, cyclohexane, ethanol, and methanol. Moreover, there is obvious redshift in acetone, ethyl acetate, toluene and petroleum ether. With the above-mentioned phenomena, these solvents can be identified easily. Therefore, a fluorescence-based sensing method can be employed for the detection of a variety of solvents with good sensitivity, fast response, high selectivity, and ease of operation.
Conclusions
In summary, we successfully synthesized multicolor zinc atom doped carbon dots by controlling the proportion of precursor. TEM and AFM measurement suggest that prepared carbon dots are uniform in size and have identical morphologies. Therefore, we believe the color change has nothing to do with the size effect. Further analysis by XPS and FTIR confirmed that the doping of Zn atoms can increase the oxidation degree of CDs, making the graphitic carbon content less. It also indicates that the four CDs contains the same elements and functional groups. The difference is distinguished by the chemical bond content associated with oxygen: the red emission CDs are less abundant of it, and the blue one is the opposite. Theoretical simulation indicates that at a lower oxidation state (containing less CO group), the Zn dopant and amino N synergistically make the PL emission blue-shift, while the Zn dopant and pyrrolic N make the PL emission red-shift; at a higher oxidation state (containing more CO), the Zn dopant and pyrrolic N synergistically make the PL emission blue-shift. Finally, we succeed in making the prepared CDs into white, red, yellow, and blue LEDs, and applying CDs of precursor ratio of 1:0 to the detection of water and organic solvents. Other than the tested applications, they also have great potential for applications in fields of photoelectron conversion, bioimaging, and ion or molecular sensing due to their broad absorption, long wavelength excitation, and multiple surface functional groups.
Experimental section
Materials
Zinc chloride was obtained from Tianjin Guangfu Technology Development Co., Ltd. Anhydrous ethanol was purchased from Beijing Chemical Works. p-Phenylenediamine (PPD) was acquired from National Drug Reagent Co., Ltd. All chemicals were used as received. Polyvinylpyrrolidone K54–K65 (PVP) was obtained from Saen Chemical Technology (Shanghai) Co., Ltd. Its average Mw is around 360000. All the materials employed in the experiment are of AR grade except PPD, which is of CP. The microporous membrane (nylon 66, 0.22 μm) were purchased from Tianjin Jinteng Experimental Equipment Co. Ltd.
Synthesis of multicolor emissive CDs
The color-tunable Zn-doped CDs were synthesized by using different molar ratios of PPD to ZnCl2 in ethanol at the temperature of 200 °C. For instance, 0.1 g PPD and 0.01 g ZnCl2 were dissolved in 25 mL ethanol for the synthesis of red emissive Zn-doped CDs. The mixture was then transferred into 50 mL Teflon-lined stainless-steel autoclave and kept at 200 °C for 4 h. Subsequently, the reaction solution was cooled down and filtered by a cylindrical filtration membrane filter (0.22 μm). The supernatant was collected into a glass bottle and then put in the drying oven for 12 h to obtain the solid. For blue emissive Zn-doped CDs, the ratio of PPD and ZnCl2 is 1:1. Zn-doped CDs with different emissive colors can be synthesized by adjusting the ratios of PPD to ZnCl2 (1:0, 1:0.1, 1:0.5, 1:1).
Characterization
Photoluminescence (PL) spectrum, UV-vis absorption spectrum, QY as well as PL lifetime were recorded using fluorescence spectrometer (FLS980) from Techcomp (China). Transmission electron microscopy (TEM), Model JEM-2100 and JEM-2100F-JEOL, was used to characterize the surface morphology of the prepared CDs. Subsequently, high-resolution TEM (HRTEM) images of the as-prepared CDs were obtained with a Model JEM-2100 transmission electron microscope. The solution was drop-casted onto mica substrates for Atomic force microscopy (AFM) investigations by using the Bruker Scan-Dimension-Icon System. X-ray photoelectron spectroscopy (XPS) were collected on a Thermo Scientific ESCALAB 250 Multi-technique surface analysis. A Bruker Vertex 70 spectrometer were used to measure the Fourier transform infrared (FTIR) spectrum spectra. X-ray diffraction spectroscopic (XRD) patterns were carried out by an X-ray diffraction using Cu-Kα radiation (XRD, PANalytical X'Pert Pro MPD). The photographs of CDs were taken with a mobile phone under UV light excited at 365 nm.The LED devices preparation
The mixture of the two kinds of CDs with precursor ratio of 1:0 and 1:1 (volume ratio of 1:2), as well as PVP were stirred for 15 min and then added dropwise to the LED chip carefully. Afterwards the bubbles were eliminated with a resin vacuum extractor. Finally, the device was dried in an oven at 60 °C for 5 h. For the white LEDs, 0.5 mL B-CDs and 1 mL R-CDs were mixed with 1 g PVP, and then the homogeneous mixture was drop-casted on the LED chip (365 nm). For the blue LED, 1 mL B-CDs mixture was used to form composite with PVP and drop-casted on the LED chip (365 nm). Similarly, 1 mL R-CDs and PVP mixture solution was casted on the LED chip (520 nm) for the yellow LED. 1 mL pure R-CDs solution on LED chip (365 nm) were used for the red LED.
Detection of organic solvents
In this series of experiment, 3 μL amount of carbon dots (CDs with precursor ratio of 1:0) was slowly diluted to 3 mL with different solvents including dimethylformamide, acetamide, cyclohexane, dichloromethane etc., and the corresponding emission wavelength was all measured at a excitation wavelength of 520 nm.
Conflicts of interest
There are no conflicts to declare.Acknowledgements
Quan Xu would like to thank Beijing Nova Program Interdisciplinary Studies Cooperative project (No. Z181100006218138), Science Foundation of China University of Petroleum-Beijing (No. 2462018BJC004) for the support. Meng Xu would like to thank Translational Medicine Program of GHPLA (No. 1016TM-019), Military Youth Innovation Training Program (16 QNP145) for the support. Lipeng Zhang would like to thank Distinguished Scientist Program at BUCT (buctylkxj02) for the support.Notes and references
- J. Zhang, Y. Yuan, G. Liang and S. H. Yu, Adv. Sci., 2015, 2, 1500002 CrossRef PubMed.
- X. Zhang, Y. Zhang and Y. Wang, ACS Nano, 2013, 7, 11234 CrossRef CAS PubMed.
- H. Hou, C. E. Banks, M. Jing, Y. Zhang and X. Ji, Adv. Mater., 2015, 27, 7861 CrossRef CAS PubMed.
- X. Yan, X. Cui and L.-s. Li, J. Am. Chem. Soc., 2010, 132, 5944 CrossRef CAS PubMed.
- Z. Wang, F. Yuan, X. Li, Y. Li, H. Zhong, L. Fan and S. Yang, Adv. Mater., 2017, 29, 1702910 CrossRef PubMed.
- S. Gao, H. Fan, Y. Chen, L. Li, Y. Bando and D. Golberg, Nano Energy, 2013, 2, 1261 CrossRef CAS.
- A. H. Loo, Z. Sofer, D. Bousa, P. Ulbrich, A. Bonanni and M. Pumera, ACS Appl. Mater. Interfaces, 2016, 8, 1951 CrossRef CAS PubMed.
- S. Zhuo, M. Shao and S. T. Lee, ACS Nano, 2012, 6, 1059 CrossRef CAS PubMed.
- J. Briscoe, A. Marinovic, M. Sevilla, S. Dunn and M. Titirici, Angew. Chem., Int. Ed. Engl., 2015, 54, 4463 CrossRef CAS PubMed.
- W. Tao, X. Ji, X. Xu, M. Ariful Islam, Z. Li, S. Chen, P. E. Saw, H. Zhang, Z. Bharwani, Z. Guo, J. Shi and O. Farokhzad, Angew. Chem., Int. Ed., 2017, 129, 12058 CrossRef.
- X. Xu, R. Ray, Y. Gu, H. J. Ploehn, L. Gearheart, K. Raker and W. A. Scrivens, J. Am. Chem. Soc., 2004, 126, 12736 CrossRef CAS PubMed.
- Y.-P. Sun, B. Zhou, Y. Lin, W. Wang, K. S. Fernando, P. Pathak, M. J. Meziani, B. A. Harruff, X. Wang and H. Wang, J. Am. Chem. Soc., 2006, 128, 7756 CrossRef CAS PubMed.
- H. Li, X. He, Z. Kang, H. Huang, Y. Liu, J. Liu, S. Lian, C. H. Tsang, X. Yang and S. T. Lee, Angew. Chem., Int. Ed. Engl., 2010, 49, 4430 CrossRef CAS PubMed.
- X. Qin, W. Lu, A. M. Asiri, A. O. Al-Youbi and X. Sun, Sens. Actuators, B, 2013, 184, 156 CrossRef CAS.
- Q. Xu, T. Kuang, Y. Liu, L. Cai, X. Peng, T. Sreenivasan Sreeprasad, P. Zhao, Z. Yu and N. Li, J. Mater. Chem. B, 2016, 4, 7204 RSC.
- J. Zhou, Y. Yang and C. Y. Zhang, Chem. Commun., 2013, 49, 8605 RSC.
- M. C. Kim, K. S. Yu, S. Y. Han, J.-J. Kim, J. W. Lee, N. S. Lee, Y. G. Jeong and D. K. Kim, Eur. Polym. J., 2018, 98, 191 CrossRef CAS.
- H. Ding, S.-B. Yu, J.-S. Wei and H.-M. Xiong, ACS Nano, 2016, 10, 484 CrossRef CAS PubMed.
- L. Guo, J. Ge, W. Liu, G. Niu, Q. Jia, H. Wang and P. Wang, Nanoscale, 2016, 8, 729 RSC.
- J. Zhu, X. Bai, J. Bai, G. Pan, Y. Zhu, Y. Zhai, H. Shao, X. Chen, B. Dong, H. Zhang and H. Song, Nanotechnology, 2018, 29, 085705 CrossRef PubMed.
- X. Miao, D. Qu, D. Yang, B. Nie, Y. Zhao, H. Fan and Z. Sun, Adv. Mater., 2018, 30, 1704740 CrossRef PubMed.
- S. Hu, A. Trinchi, P. Atkin and I. Cole, Angew. Chem., Int. Ed., 2015, 54, 2970 CrossRef CAS PubMed.
- H. Ding, J. S. Wei, P. Zhang, Z. Y. Zhou, Q. Y. Gao and H. M. Xiong, Small, 2018, 14, 1800612 CrossRef PubMed.
- S. Vempati, A. Celebioglu and T. Uyar, Nanoscale, 2015, 7, 16110 RSC.
- T. Zhang, J. Zhu, Y. Zhai, H. Wang, X. Bai, B. Dong, H. Wang and H. Song, Nanoscale, 2017, 9, 13042 RSC.
- D. Sun, R. Ban, P.-H. Zhang, G.-H. Wu, J.-R. Zhang and J.-J. Zhu, Carbon, 2013, 64, 424 CrossRef CAS.
- K. Hola, Y. Zhang, Y. Wang, E. P. Giannelis, R. Zboril and A. L. Rogach, Nano Today, 2014, 9, 590 CrossRef CAS.
- Y. Dong, H. Pang, H. B. Yang, C. Guo, J. Shao, Y. Chi, C. M. Li and T. Yu, Angew. Chem., Int. Ed. Engl., 2013, 52, 7954 CrossRef.
- K. S. Babu, T. R. Kumar, P. Haridoss and C. Vijayan, Talanta, 2005, 66, 160 CrossRef CAS PubMed.
- P. Chawla, G. Sharma, S. P. Lochab and N. Singh, Bull. Mater. Sci., 2009, 33, 535 CrossRef.
- Q. Xu, Y. Liu, R. Su, L. Cai, B. Li, Y. Zhang, L. Zhang, Y. Wang, Y. Wang, N. Li, X. Gong, Z. Gu, Y. Chen, Y. Tan, C. Dong and T. S. Sreeprasad, Nanoscale, 2016, 8, 17919 RSC.
- E. N. Tsiok, D. E. Dudalov, Y. D. Fomin and V. N. Ryzhov, Phys. Rev. E: Stat., Nonlinear, Soft Matter Phys., 2015, 92, 032110 CrossRef CAS PubMed.
- X. Zhang, J. Rong, L. Wang, L. Yu, W. Jie, B. Geng and G. Wang, CrystEngComm, 2013, 15, 1173 RSC.
- K. Hola, M. Sudolska, S. Kalytchuk, D. Nachtigallova, A. L. Rogach, M. Otyepka and R. Zboril, ACS Nano, 2017, 11, 12402 CrossRef CAS PubMed.
- A. D. Becke, J. Chem. Phys., 1993, 98, 5648 CrossRef CAS.
- X. K. Chen, Y. Tsuchiya, Y. Ishikawa, C. Zhong, C. Adachi and J. L. Bredas, Adv. Mater., 2017, 29, 1702767 CrossRef PubMed.
- Y. Zhang, R. Yuan, M. He, G. Hu, J. Jiang, T. Xu, L. Zhou, W. Chen, W. Xiang and X. Liang, Nanoscale, 2017, 9, 17849 RSC.
- C. Sun, Y. Zhang, K. Sun, C. Reckmeier, T. Zhang, X. Zhang, J. Zhao, C. Wu, W. W. Yu and A. L. Rogach, Nanoscale, 2015, 7, 12045 RSC.
Footnote |
| † Electronic supplementary information (ESI) available. See DOI: 10.1039/c8ra09868a |
| This journal is © The Royal Society of Chemistry 2019 |