
 Open Access Article
 This Open Access Article is licensed under a Creative Commons Attribution-Non Commercial 3.0 Unported Licence
Protection of silver and gold LSPR biosensors in corrosive NaCl environment by short alkanethiol molecules; characterized by extinction spectrum, helium ion microscopy and SERS†
Hazuki Haraguchia,
Natalie Freseb,
Armin Gölzhäuserb and
Hiroyuki Takei *cd
*cd
aGraduate School of Life Sciences, Toyo University, Gunma 374-0193, Japan
bPhysics of Supramolecular Systems and Surfaces, Bielefeld University, 33615 Bielefeld, Germany
cFaculty of Life Sciences, Toyo University, Gunma 374-0193, Japan. Tel: +81-276-82-9020E-mail: h_takei@toyo.jp
dBio-Nano Electronics Research Centre, Toyo University, Saitama 350-0815, Japan
First published on 26th March 2019
Abstract
We investigated the utility of localized surface plasmon resonance sensors in a biologically relevant environment containing NaCl. Our sensors are fabricated by depositing gold or silver on a monolayer of adsorbed monodisperse SiO2 nanospheres. While silver nanostructures are rather unstable in air and water as assessed by drifts in the extinction peak, even gold nanostructures have been found to drift at elevated NaCl concentrations. In an attempt to protect these nanostructures against NaCl, we modified them with alkanethiols with different lengths in the vapor phase and found that shorter chain alkanethiols such as 1-butanethiol are particularly effective against even 250 mM NaCl, rather than longer-chain alkanethiols more suitable for robust SAM formation. A vapor phase treatment method, in contrast to widely used solution phase treatment methods, was selected with the intention of reducing the solvent effect, i.e. destruction of intricate nanostructures upon contact with a solvent when nanostructures have been prepared in a vacuum system. Moreover, the treatment with 1-butanethiol led to an enhanced sensitivity as expressed by peak shift in nm per refractive index unit, nm per RIU. We show the results of evaluating alkanethiol-protected silver and gold nanostructures by extinction spectroscopy, helium ion microscopy and surface-enhanced Raman spectroscopy. The vapor phase treatment method with short chain alkanethiols is an effective way to protect intricate gold and silver nanostructures prepared in a vacuum system.
1. Introduction
Various kinds of noble metal nanostructures have been prepared, and studies exploiting their unique optical properties for novel analytical methods have been receiving increasing attention.1–8 Some of these analytical techniques are surface-enhanced Raman spectroscopy (SERS), surface-enhanced fluorescence spectroscopy (SEF) and localized surface plasmon resonance (LSPR) sensing which find uses in areas such as environmental monitoring, forensic science and clinical diagnostics.1,9–17 With SERS and SEF, adsorption of target molecules on noble metal nanostructures enhances respectively Raman scattering and fluorescence from the adsorbed molecules, and LSPR sensors exploit the sensitivity of the extinction peak of nanostructures toward the refractive index within the immediate vicinity of the sensor surface. These analytical techniques can be carried out using freely suspended colloidal systems,4,18 or surface-adsorbed systems as we will discuss in this paper. Colloidal systems are sufficiently effective and conceptually simple, but surface-adsorbed systems are easier to manipulate and have a greater potential for miniaturization and multiplexing.LSPR sensing exploits the so-called near-field, an intense localized electromagnetic field that is generated in the close vicinity (tens of nm) of a noble metal nanostructure when it is irradiated by a propagating electromagnetic field with an appropriate frequency.13,19,20 Gold and silver are known for their low resistivity which allows free electrons inside the nanostructure to oscillate resonantly, reflected by a prominent extinction peak. Expressed in an alternative way, the dielectric constant of noble metals is characterized by a small imaginary part, across the entire visible light region for silver and a longer wavelength region above a wavelength of 500 nm for gold. The fact that the value for silver is lower for a wider wavelength region makes it theoretically a more desirable material because a wider range of excitation wavelengths can be employed. If a local change in the refractive index occurs due to adsorption or desorption of molecules at the surface, the resonant frequency shifts, resulting into a red-shift in the extinction peak wavelength.21–26 By exploiting this property, it is possible to monitor molecular interactions in real-time. The LSPR sensor has the advantage of relative immunity from the presence of other substances so long as they do not come into the near-field and become bound to the surface. While this property is shared by surface plasmon resonance (SPR) sensor exploiting propagating surface plasmon travelling along the surface of a thin noble metal film, LSPR sensing promises to become a less expensive sensing platform due to simplicity in construction.27,28 To promote its use, it is necessary to gain a good understanding of its behavior under various conditions likely to be encountered with biological specimen.20,29,30 While biological specimen are complex media defying a simple description, one common difficulty is the presence of corrosive NaCl. In this paper, we will discuss how noble metal nanostructures can be protected in such environments.
Many studies have exploited freely suspended noble metal colloids and produced convincing results,17,18,28 but we limit ourselves to discussions on surface-bound nanostructures because they are easier to manipulate, i.e., washing of loosely and nonspecifically bound materials is rather straightforward. With freely suspended systems, on the other hand, washing would require centrifugation or trapping colloids by a filter, making it a cumbersome proposition. Another challenge with a colloidal system is the dilution effect upon addition of the sample to the colloidal suspension, making accurate measurements of the extinction peak wavelength more challenging. Furthermore, with a colloidal system, one needs to separate two different mechanisms involved in color change, i.e., sample-induced aggregation of colloids and molecular adsorption on the surface of individual colloids. Moreover, surface-bound systems are better suited for multiplexing, simultaneous detection of multiple target molecules if the sensor surface are modified with a number of different capture molecules in a miniaturized format.
One method widely used for making an LSPR sensor is through attachment of noble metal colloids on a solid surface.7,17,23,31–35 As alternatives, a wide variety of gold and silver nanostructures with different sizes and shapes, such as spheres, nanoshells, prisms, and rods can be either produced in individual laboratories or obtained from commercial vendors. They can be readily attached onto a solid surface through silane chemistry or thiol chemistry. At the other end of the spectrum in terms of fabrication complexity, electron-beam lithography has been exploited to form noble metal nanostructures of almost any arbitrary shape.36–39 It is supremely suited for fundamental studies of plasmonic phenomena and optimization of nanostructure shapes. When practicality is to be taken into consideration, however, a desirable fabrication method should be characterized by ease of preparation while the sensor must also possess qualities such as uniform quality, reproducibility and high sensitivity.37 With this goal in mind, we have been working with a version of the metal film-on-nanosphere (MFON) technique, which we call random MFON. The first letter in the abbreviation, M, is substituted by the name of a specific metal so that when the metal is gold, for example, it is referred to as AuFON. Traditionally MFON structures are formed from a regular array of highly monodisperse nanospheres adsorbed on a solid surface.40,41 In contrast, random MFON structures are characterized by use of randomly adsorbed nanospheres.42 The MFON structure can be said to originate from an earlier technique called nanosphere lithography (NSL), whereby a monodisperse nanosphere layer is employed as a mask through which a metal is deposited.1,2 For some reason, random MFON structures have not been reported wildly, but structures described by Schneider and Van Duyne may belong to this category.2,41
Our random MFON LSPR sensor consists of a glass slide, a 20 nm thick gold layer, a monolayer of mildly monodisperse SiO2 nanospheres and a top metal layer of varying thicknesses.21 The first gold layer is necessary for formation of an optical cavity structure for an enhanced extinction. Without this layer, the extinction peak becomes significantly diminished.25,42 Fig. 1 shows extinction spectra of random Au- and AgFON LSPR sensors prepared with 150 nm SiO2 nanospheres, with the top layer either 17 or 22 nm thick. Included in Fig. 1 are also helium ion microscopy (HIM) images of nanospheres covered by Au of comparable thicknesses. For comparison, solid gold colloids adsorbed on a substrate such as a glass slide typically exhibit a peak of less than 0.5.23,35 Pronounced peaks facilitate more accurate determination of the extinction peak wavelength. Moreover, the figure of merit, peak shift in nm per refractive index unit (nm per RIU), is in the range of 130–150 nm per RIU, which is close to the upper limit for LSPR sensors operating in the visible region.43–45 When comparison is limited to other surface-bound sensors which tend to show slightly lower figures of merit due to the interference from the underlying solid surface, its advantage becomes great. Incidentally, as the top layer thickness is increased from under 17 to over 22 nm, adjacent Au nanoparticles become connected as seen in the insets. We found this connectivity influences the physical stability of the structure while some reduction sensitivity occurs. Our LSPR sensor need to be prepared with the top layer in this thickness range.45
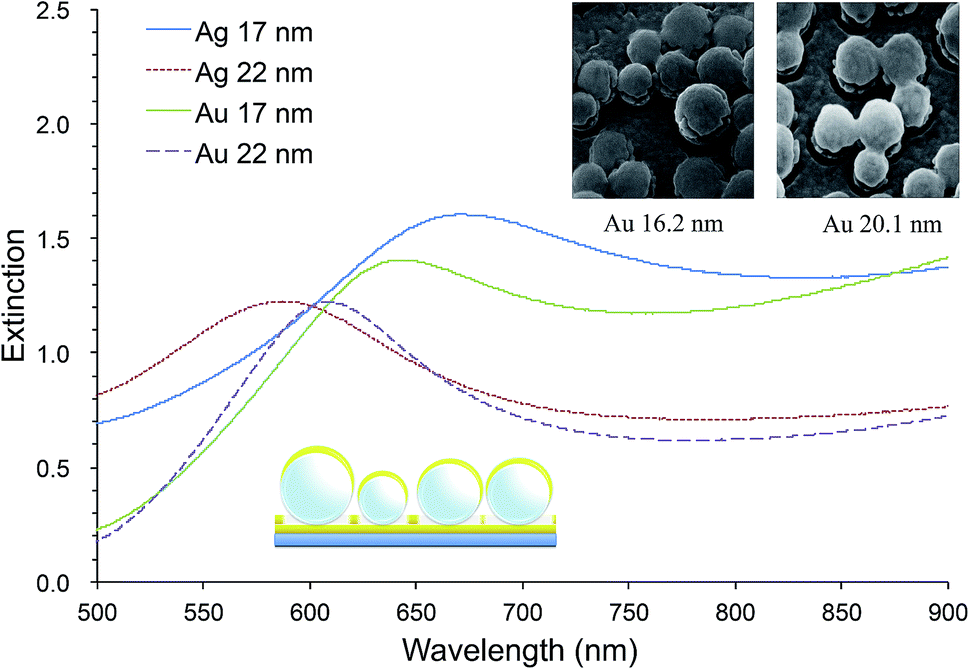 | ||
| Fig. 1 Extinction spectra of random Au- and AgFON LSPR sensors prepared with 150 nm SiO2 nanospheres with 17 and 22 nm thick top layers. HIM images are of nanospheres covered by 16.2 and 20.1 nm thick Au. | ||
While we do not delve into details here, the same system exhibits another peak in the near-IR region.45 In accordance with the general observation that nanostructures with red-shifted extinction peaks are characterized by improved figures of merits,24,46,47 the near-IR peak is characterized by figures of merit of 506 nm per RIU.45
Overall, the prominent extinction peak, respectable figures of merit, and ease of preparing samples with areas greater than cm2 with high uniformity make random MFON LSPR sensor a good candidate for practical application.42,45 It should also be mentioned that preparation of random MFON nanostructures does not require highly monodisperse nanospheres, unlike regular MFON nanostructures, allowing use of significantly less expensive nanospheres for preparation.
While our LSPR sensor possesses these beneficial properties, there are some technical hurdles to be overcome. For one, the stability of the extinction peak, reflecting the morphology of the nanostructure, is of fundamental importance. While gold nanoparticles are in general considered rather stable, there have been reports on so-called solvent effect whereby gold nanostructures prepared in vacuum or air can undergo morphological changes upon immersion into a solvent, observed as a shift in the extinction peak wavelength.30,36,43 While nanostructures such as spheres, nanoshells, prisms, and rods, are mostly prepared in solution phase so that they are already protected with a capping agent, more intricate structures that are often prepared in a vacuum system such as electron-beam lithography would be readily destroyed in contact with a solvent. This effect has also been found to afflict our random MFON LSPR sensors. The situation is made worse in the presence of corrosive NaCl. Phosphate buffer saline (PBS) buffer (140 mM NaCl), for example, can induce a noticeable shift in the extinction peak. To solve this problem, we decided first to evaluate effects of various solutions containing NaCl often encountered in biosensing.48–51 We monitored the time-course change in the extinction spectrum. Then, we proceeded to investigate whether random MFON LSPR sensors can be protected by alkanethiol treatment because self-assembled monolayers (SAM) have been reported to protect the underlying metal surface as well as molecules themselves from oxidation.43,52,53
Protection becomes a greater issue for metals other than gold.35 We have included silver in our investigation because silver has dielectric constants better suited for LSPR sensing than gold.54 Among others,43,55–57 Van Duyne et al. for example, confirmed this experimentally with LSPR sensors made from silver and copper. They have performance superior to that of a similar sensor fabricated from gold.58 There are also reports on composite structures making use of silver and/or copper along with gold for further improvements in sensing performance.4,59,60 Protection of silver is difficult enough in the absence of NaCl, but we need to show that silver nanostructures can be made to resist NaCl. There are many reports on protection of silver and copper surfaces with SAM under mild conditions,61–63 but it was not clear whether SAMs could mitigate the corrosive effect of NaCl. We decided here to use alkanethiol vapors rather than solutions to prevent the solvent effect.43 As mentioned earlier, it is necessary to protect the surface. It is particularly crucial for intricate structures such as needles, spikes, stars etc. so that the original morphology necessary for plasmonic effects can be retained. It should be mentioned that there are reports on other methods for protection such as an additional gold layer or SiO2 layer,64–66 but we decided to concentrate on an SAM-based approach because of its simplicity both in terms of the protocol and necessary equipment.
We selected relatively short alkanethiols that vaporize readily, 1-butanethiol (1-BT), 1-hexanethiol (1-HT) and 1-octanethiol (1-OT). Gold and silver nanostructures were exposed to these alkanethiol molecules through vaporization and then immersed into water, phosphate buffer saline (PBS) or aqueous NaCl solutions of various concentrations. Without alkanethiol protection, AgFON LSPR sensors are unstable even in pure water. AuFON LSPR sensors, on the other hand, become unstable in 250 mM NaCl solution. With alkanethiol protection, however, both Au- and AgFON LSPR sensors became significantly stable, even in 250 mM NaCl solution. HIM images confirmed that unprotected AgFON became completely obliterated upon exposure to NaCl while the alkanethiol protection allowed AgFON nanostructures to retain their original morphology. Among three alkanethiol molecules, it was unexpectedly the shortest alkanethiol, 1-BT, that was most effective. 1-HT and 1-OT did show protection effects, but they were not as effective as 1-BT. Moreover, when we explored how long these alkanethiols retained their protective effect after treatment, we found that 1-BT treatment remained effective even after two weeks while results for the other two longer chain alkanethiols were not as long lasting or reproducible as with 1-BT.
We also characterized alkanethiol-protected MFON nanostructures with SERS. It so happens that random MFON nanostructures are also suitable for SERS measurements. It is rather common that one noble metal platform can be used for different plasmonic applications.16,41,42,67,68 Adsorption processes of sulfur compounds have been observed with SERS measurements before.69,70 It is possible to learn about cleavage of the S–H bond, crystallinity of the adsorbed layer and semi-quantitative evaluation of the amount of adsorbed molecules. We observed that the alkanethiol treatment needs to be carried out overnight for effective protection, but SERS observations show that characteristic peaks of 1-BT, 1-HT and 1-OT saturate within 15 min. The ν(C–S) at ca. 700 cm−1 and ν(C–C) at ca. 1100 cm−1 peaks reveal crystalline structures for the inner and outer sections of the alkanethiols.71 The former peak grows faster than the latter, and it also shifts toward higher wavenumbers as adsorption progresses. Beyond 480 min, no further changes are observed except of reduced peak intensities for 1-BT. The shift of the 700 cm−1 peak is more pronounced for 1-HT and 1-OT, but it is almost complete after 30 min exposure. Difference in the time-course changes of SERS measurements and the time necessary for formation of an effective protective layer reveals that more than simple adsorption is necessary for formation of the protective layer.
2. Materials and method
2.1 Materials and reagents
Materials used for forming the MFON LSPR sensors were glass slides from Matsunami (SF17399 Micro Slide Glass, cat. no. TF2404 Osaka, Japan), silica nanoparticles from Polysciences Inc., (0.15 ± 0.03 μm, cat. no. 24320 Warrington, USA), aminopropyltrimethoxysilane (APTMS) from Wako Pure Chemical Industries, Ltd. (cat. no. 323-74352 Osaka, Japan), and gold and silver from the Nilaco Corporation (cat. no. 171484, 99.95% and cat. no. 400025, 99.9%, respectively, Tokyo, Japan). Alkanethiols for modifying MFON nanostructures were 1-butanethiol, 1-hexanethiol and 1-octanethiol from Wako Pure Chemical Industries Ltd. (cat. no. 022-03742, cat. no. 088-08181 and cat. no. 157-00703 respectively), used without further purification. Antibodies from Santa Cruz Biological were used as a primary antibody (normal mouse IGG SCB 2025) and a secondary antibody (anti-mouse IgG goat poly, ALP, SCB 2058).2.2 Fabrication of random MFON LSPR sensors
We prepare random MFON LSPR sensors with a protocol consisting of four steps. In step 1, we deposited a 20 nm thick Au film on a glass slide using a vacuum evaporator, VFR-200M/ERH (ULVAC KIKO, Inc., Miyazaki, Japan) with the vacuum pressure of 5 × 10⁻³ Pa or better at a typical evaporation rate of 0.2 nm s−1. In step 2, we immersed the Au-coated glass slide into 1 vol% APTMS solution for 5 min, followed by rinsing with distilled water and drying. This procedure was necessary for promoting adsorption of SiO2 nanospheres in the subsequent step. In step 3, suspension of SiO2 nanospheres was placed on the APTMS-treated glass slide for 5 min, followed by rinsing with distilled water and drying. Addition of 20 mM MgCl2 aqueous solution to the nanosphere suspension in a 1![[thin space (1/6-em)]](https://www.rsc.org/images/entities/char_2009.gif) :1 volume ratio increased the adsorption density by reduction in the repulsive force among nanospheres. After rinsing with deionized water, the glass slide was dried in a home-built oven at 50 °C. In step 4, a thin film of Au or Ag with a highly controlled thickness was formed on top of the adsorbed SiO2 nanospheres by vacuum evaporation.
:1 volume ratio increased the adsorption density by reduction in the repulsive force among nanospheres. After rinsing with deionized water, the glass slide was dried in a home-built oven at 50 °C. In step 4, a thin film of Au or Ag with a highly controlled thickness was formed on top of the adsorbed SiO2 nanospheres by vacuum evaporation.
2.3 Alkanethiol adsorption for formation of a protective layer
To avoid undesirable morphological change in random MFON nanostructures due to the solvent effect, sensors were exposed to vapors of various alkanethiols in the following manner. An alkanethiol in the form of liquid (10 μL) was placed in a 1.5 mL tube with a pinhole. The tube was suspended in a closed glass jar, into which LSPR sensors were placed. The incubation time was set at 5, 15, 30, 120, 480 min and overnight. For SERS observation, the duration of overnight treatment was specifically 28 hours.For investigation on durability of the alkanethiol protection, sensors were stored under the ambient condition as well as in N2 enriched environment with reduced oxygen content of 4% (a tube containing sensors was evacuated with a vacuum pump down to 0.02 M Pa and refilled with dry nitrogen) for periods up to two weeks.
2.4 Protocol for obtaining extinction spectra for evaluating stability and antigen–antibody reaction
Extinction spectra were obtained with a set-up based on the Ocean Optics USB 4000 spectrometer and the LS-1-LL light source, with a custom-made bifurcated optical fiber in the reflection mode. For the measurement of the figure of merits, glucose solutions of different concentrations were prepared. Their refractive indices were measured with a refractometer (ATAGO PAL-RI, Tokyo, Japan).For evaluation of sensor stability, we investigated effects of phosphate buffer with/without NaCl, and aqueous NaCl solutions on extinction spectra by immersing sensors into (1) distilled water, (2) phosphate buffer (PB) and phosphate buffer saline (PBS: 140 mM NaCl) and (3) aqueous NaCl solutions with concentrations of 63, 130, 250, and 500 mM. A sensor was immersed in 40 μL of each solution and spectra were obtained in real-time for up to 5 min.
For antigen–antibody reactions, it was necessary to mix the solution constantly. For this, a unique feature of the custom-built bifurcated optical fiber was exploited. Fig. S1† shows an optical fiber equipped with one hollow tube, which was connected to a modified air pump sending alternating air pulses. A small volume of solution that was sucked into the end of the tube due to a capillary force was made to vibrate along the direction of the tube. This in turn generated a whirling flow in the solution.
2.5 Surface-enhanced Raman spectroscopy
To confirm binding of alkanethiol molecules onto the surface, LSPR sensors exposed to 1-BT, 1-HT, and 1-OT vapors for various times were assessed with a Raman spectrometer (Thermo Fisher Scientific, NICOLET ALMEGA XR). The excitation wavelength was 633 nm with exposure time of 1 s, averaged over 16 scans. Spectra were averages of measurements from five randomly selected spots. The only processing applied to these spectra are base line subtraction and shifting of spectra along the y axis for ease of viewing in relevant figures. To obtain a Raman spectrum of a liquid sample, a glass capillary was filled with it and sealed at two ends prior to laser irradiation.2.6 Other characterization techniques; HIM and element analysis
HIM is an ideal imaging technique, as the charge compensation allows to acquire images of electrically insulating samples without prior coating of a conductive layer. HIM observations were carried out with a Zeiss Orion Plus® with a helium ion beam of 34–36 kV acceleration voltage at a current of 0.5 pA. We used a 10 μm Aperture at Spot Control 5. Secondary electrons were collected by an Everhart–Thornley detector at 500 V grid voltage. The working distance was about 10 mm and the dwell time per pixel was 30 μs. All micrographs were recorded with a pixel size of 0.49 nm. For element analysis, a Hitachi Swift ED3000 was used.3. Results
3.1 Figures of merit for the random AuFON LSPR sensor
One way of evaluating an LSPR sensor is to measure shifts in the extinction peak wavelength upon immersion of the sensor into solutions with different refractive indices. The slope of the graph showing the extinction peak wavelength as a function of the refractive index, is the figure of merit. Fig. 2 shows such graphs for AuFON LSPR sensors with the 17 and 22 nm thick top layers. Their slopes are 149.49 and 129.29 nm per RIU respectively. Sensors prepared with less than 17 nm of Au became increasingly less stable, and those with the top layer thicker than 22 nm showed decreasing figures of merit so that these sensors represent the lower and upper limits for the useable film thickness.45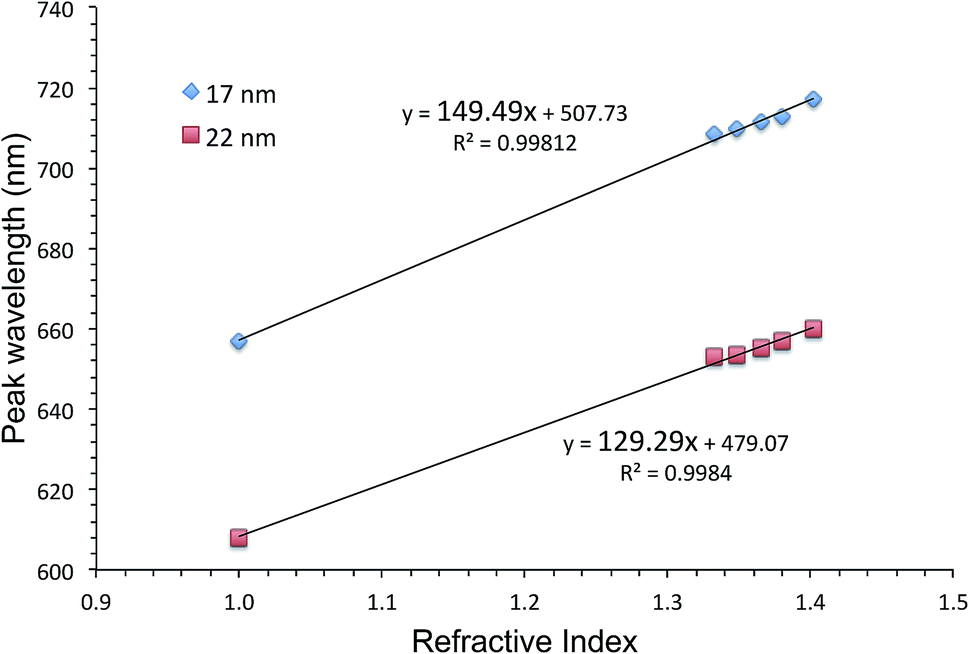 | ||
| Fig. 2 The extinction peak wavelength as a function of the refractive index for AuFON LSPR sensors. Results from sensors with 17 and 22 nm thick top layers are shown for comparison. | ||
3.2 Stability of unprotected sensors
Fig. 3 shows time-course changes of the extinction spectra of unprotected LSPR sensors in various solutions. Responses of AuFON LSPR sensors in PBS and 250 mM NaCl solution are shown in (a) and (b) respectively. Those for AgFON LSPR sensors are shown in (c) and (d) respectively. The time interval was 20 s. The AuFON LSPR sensor was already unstable in PBS, but at an elevated NaCl concentration of 250 mM, the peak became noticeably more unstable. The peak red-shifted while its height diminished. As for AgFON LSPR sensors, exposure to even PBS, not to mention 250 mM NaCl, lead to a total loss of the peak within half a minute.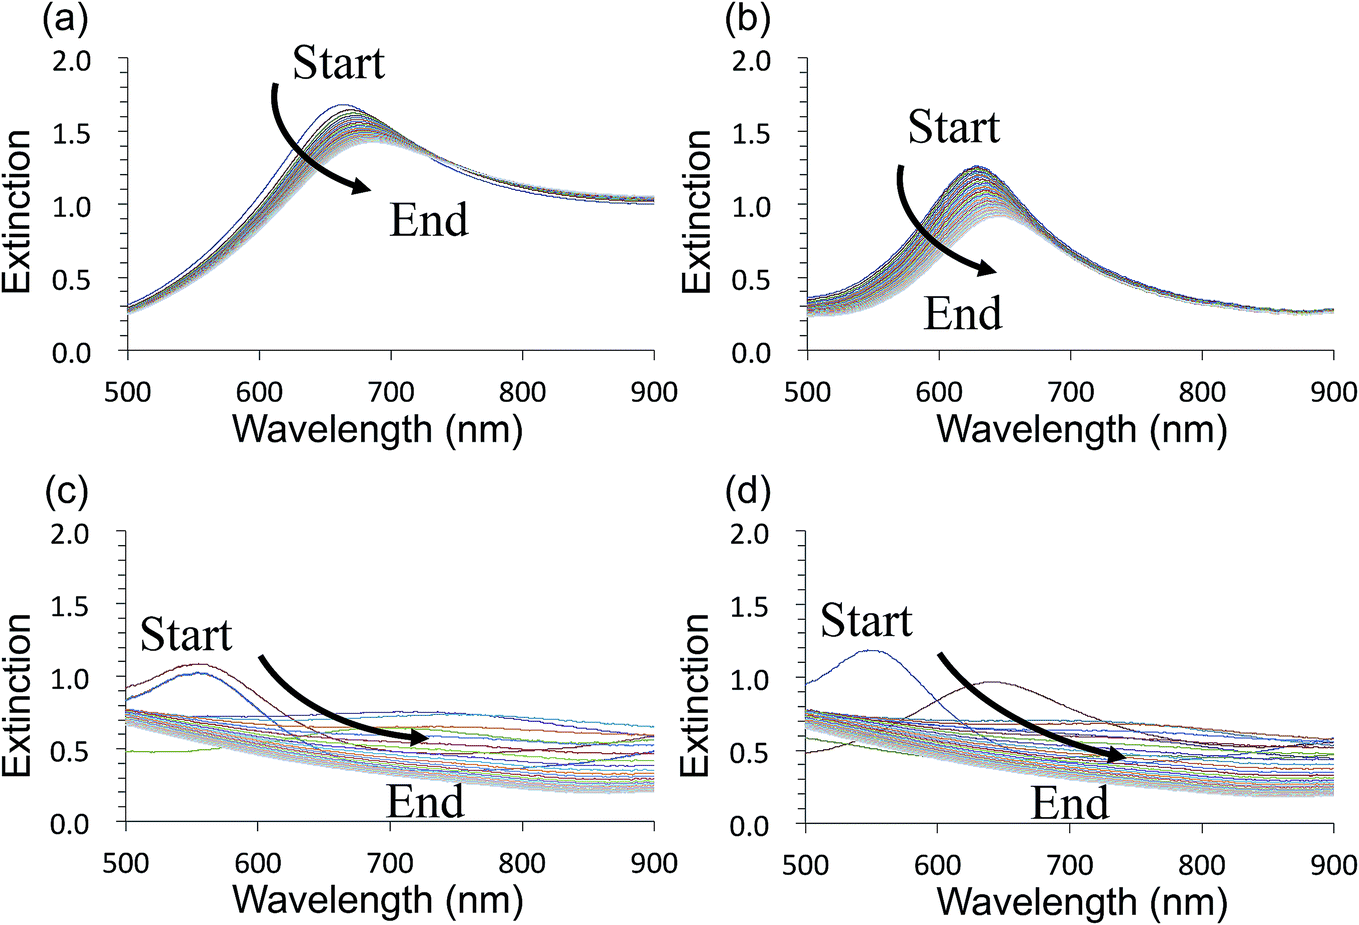 | ||
| Fig. 3 Time-course changes of the extinction spectra of untreated Au- and AgFON LSPR sensors during the first 5 min, with a 20 s time interval. (a) Immersion of a AuFON LSPR sensor into PBS. (b) Immersion of a AuFON LSPR sensor into 250 mM NaCl solution. (c) Immersion of a AgFON LSPR sensor into PBS. (d) Immersion of a AgFON LSPR sensor into 250 mM NaCl solution. | ||
Table 1 is an attempt at semi-quantitative descriptions of all unprotected sensors under various conditions we explored in terms of the extinction peak wavelength shift and change in the extinction peak height. Letters a to d correspond to the following responses in the peak wavelength shift (nm), a: 0 ≦ v < 10; b: 10 ≦ v < 25; c: 25 ≦ v; d: peak lost. For extinction, the same set of letters correspond to the following; a: 0 ≦ v < 0.05, b: 0.05 ≦ v < 0.2, c: 0.2 ≦ v, and d: peak lost.
| Solution | Au-based sensor | Ag-based sensor | ||||||
|---|---|---|---|---|---|---|---|---|
| Peak shift | Extinction change | Peak shift | Extinction change | |||||
| Deposition thickness | Deposition thickness | |||||||
| 17 nm | 22 nm | 17 nm | 22 nm | 17 nm | 22 nm | 17 nm | 22 nm | |
| a For peak wavelength shift (nm), a: 0 ≦ v < 10; b: 10 ≦ v < 25; c: 25 ≦ v; d: peak lost. For peak change (O.D.) a: 0 ≦ v < 0.05; b: 0.05 ≦ v < 0.2; c: 0.2 ≦ v; d: peak lost. | ||||||||
| Distilled water | a | a | a | a | c | c | c | c |
| PB | a | a | a | a | d | d | d | d |
| PBS | c | a | c | a | d | d | d | d |
| 0.063 M NaCl | c | b | b | b | d | d | d | d |
| 0.13 M NaCl | c | b | c | c | d | d | d | d |
| 0.25 M NaCl | c | b | c | c | d | d | d | d |
| 0.50 M NaCl | c | b | c | c | d | d | d | d |
The AgFON LSPR sensor was significantly less stable than the AuFON LSPR sensor. In distilled water, during the first 5 min it retained its extinction peak. AgFON LSPR sensors were susceptible to corrosion in all solutions. With even a trace amount of NaCl, extinction peaks of AgFON LSPR sensors were completely lost, making Ag a poor material for sensing in the unprotected form. Table 1 also shows differences in stability due to different metal thicknesses. Sensors with a 17 nm thick top layer were less stable than those with a 22 nm thick top layer upon immersion into PBS. The difference in these sensors is connectivity among adjacent nanostructures. As mentioned earlier, HIM images in Fig. 1 shows that with the 17 nm thick top layer, adjacent nanostructures are more or less isolated, but with the increased thickness, they become connected. Table 1 shows, however, that the enhanced stability through a thicker top layer applies only to Au- but not to AgFON LSPR sensors.
3.3 Stability of protected sensors
Au- and AgFON LSPR sensors were subjected to the SAM formation protocol described in Section 2.3. They were then immersed into the same set of solutions as for the evaluation of unprotected AuFON and AgFON sensors. Upon treatment with 1-BT, both Au- and AgFON LSPR sensors became significantly stabilized.Fig. 4 shows time-course changes of the extinction spectra of protected Au- and AgFON LSPR sensors in various solutions. Responses of AuFON LSPR sensors in PBS and 250 mM NaCl solution are shown in (a) and (b) respectively. Those for AgFON LSPR sensors are shown in (c) and (d) respectively; peaks do not shift. Although not shown, 1-HT and 1-OT were also effective to a certain extent, more for AuFON LSPR sensors than AgFON LSPR sensors but reproducibility suffered somewhat in comparison to 1-BT. Moreover, when we investigated how long the alkanethiol treatment retained its effectiveness, superiority of 1-BT stood out. Responses of Ag- and AuFON LSPR sensors which were treated with 1-BT, 1-HT and 1-OT were different upon immersion to 250 mM NaCl solution. Their responses after one- and two-week periods are summarized in Table S1.† AuFON LSPR sensors were equally well protected by all three alkanethiols after two weeks, but only 1-BT was able to protect AgFON LSPR sensors. The storage condition, either under the ambient condition or N2 enriched environment, had a negligible influence. It is well-known that longer alkanethiols with the number of carbon atoms more than ten form highly ordered SAMs,52,72,73 but shorter alkanethiols fail to do so due to reduced van der Waals forces among molecules.74 1-BT molecules are speculated to lie flat on the gold layer and form clusters which are highly mobile.75 While we will discuss in more detail below, it was unexpected that 1-BT would turn out to be the most effective.
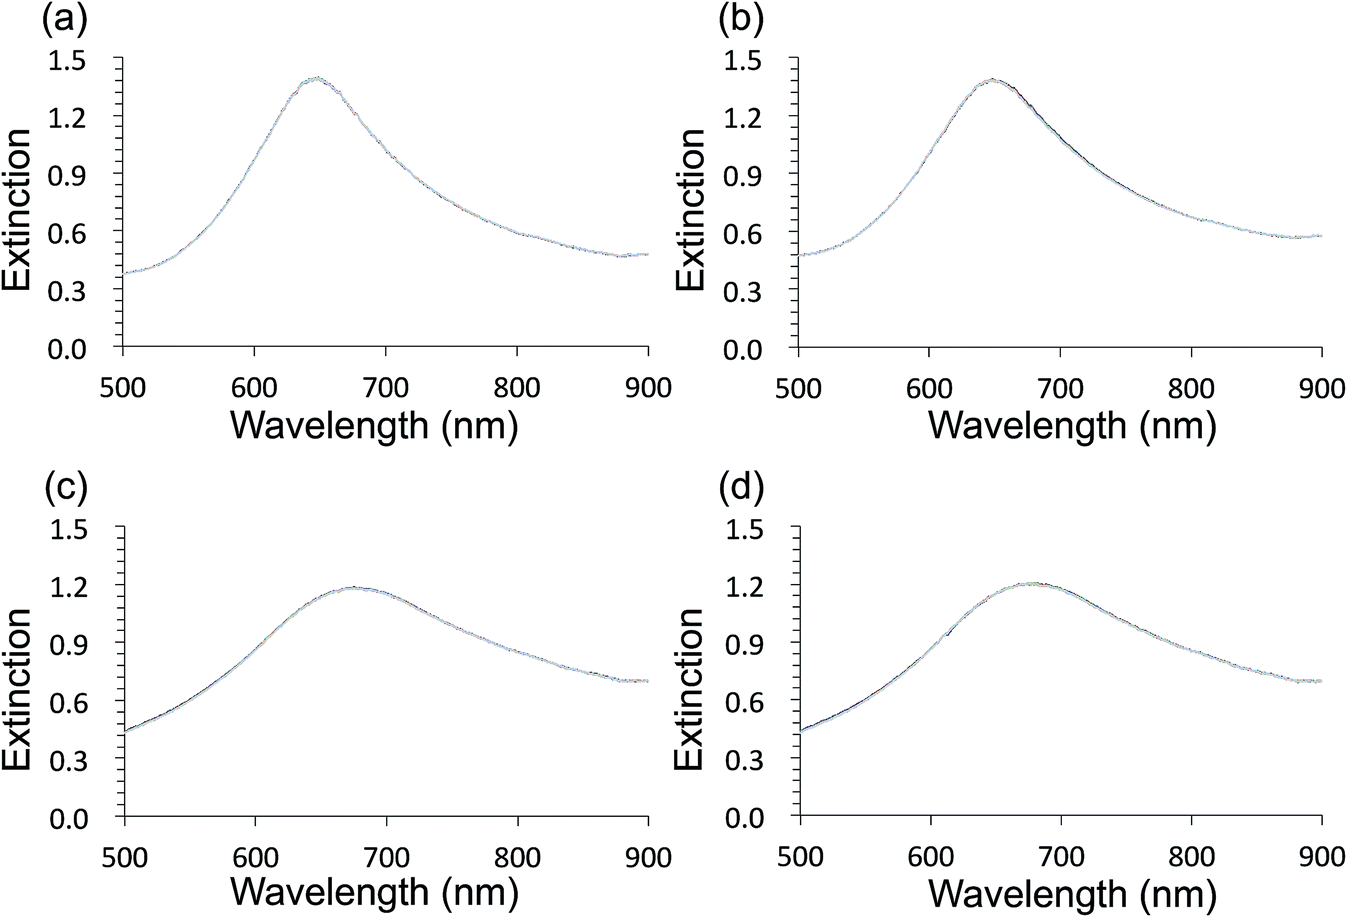 | ||
| Fig. 4 Time-course changes of the extinction spectra of the protected Au- and AgFON LSPR sensors during the initial 5 min, with a 20 s time interval. (a) Immersion of the AuFON LSPR sensor into PBS. (b) Immersion of the AuFON LSPR sensor into 250 mM NaCl solution. (c) Immersion of the AgFON LSPR sensor into PBS. (d) Immersion of the AgFON LSPR sensor into 250 mM NaCl solution. | ||
3.4 HIM observation of unprotected and protected MFON LSPR sensors
Fig. 5 shows HIM images showing morphology of AgFON LSPR sensors upon 5 min immersion to 250 mM NaCl solution. With the 1-BT treatment, there is little change in morphology before (a) and after (b) though some slight color change is noticed in the photographs. Without the treatment, nanostructures undergo a drastic change, from (c) to (d). The original cap-shaped nanostructure becomes detached, as seen in lighter-shaded debris on the left in (d). The color is also completely lost. An identical set of HIM images for AuFON LSPR sensors are shown in Fig. S2.† There is very little change in morphology with/without 1-BT treatment.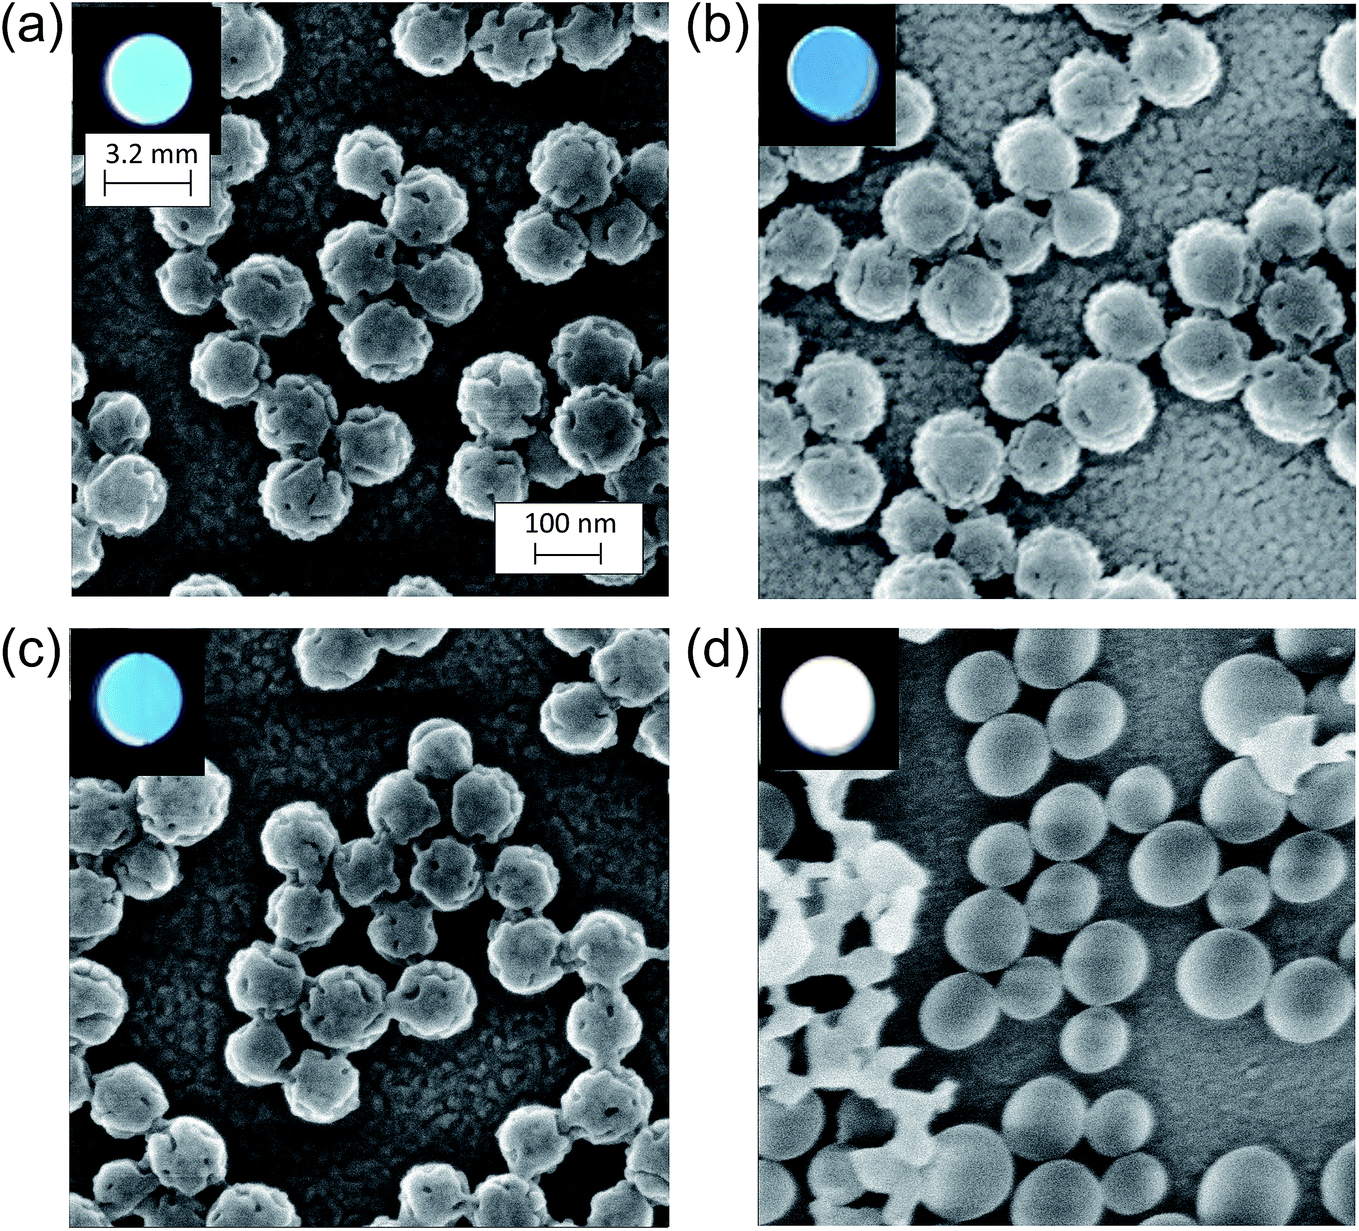 | ||
| Fig. 5 HIM images showing morphology of AgFON LSPR sensors upon 5 min immersion to 250 mM NaCl solution. With the 1-BT treatment, there is little change in morphology before (a) and after (b). Without the treatment, nanostructures undergo a drastic change, from (c) to (d). The insets are photographs of these sensors. | ||
Fig. 6 shows the extinction peak wavelength as a function of the refractive index for 1-BT treated Au- and AgFON LSPR sensors, with 17 and 22 nm thick top layers. For AuFON LSPR sensors, comparison with the graphs in Fig. 2 reveals improvements in the figure of merit from 149.49 to 159.65 nm per RIU and from 129.2 to 138.14 nm per RIU with 17 and 22 nm thick top layers, respectively. Although the extent of improvements was not significant in itself, the fact that their values did not diminish upon alkanethiol treatment was contrary to our expectation. Normally as molecules adsorb onto the sensor surface, the response of the sensor would diminish. When the entire volume of the near-field is filled with molecules, the figure of merit would diminish to zero.43 Thus, adsorbing 1-BT onto the surface for surface protection was expected to reduce the figure of merit. As for AgFON LSPR sensors, once they are protected by 1-BT, they showed figures of merit superior to those of AuFON LSPR sensors.
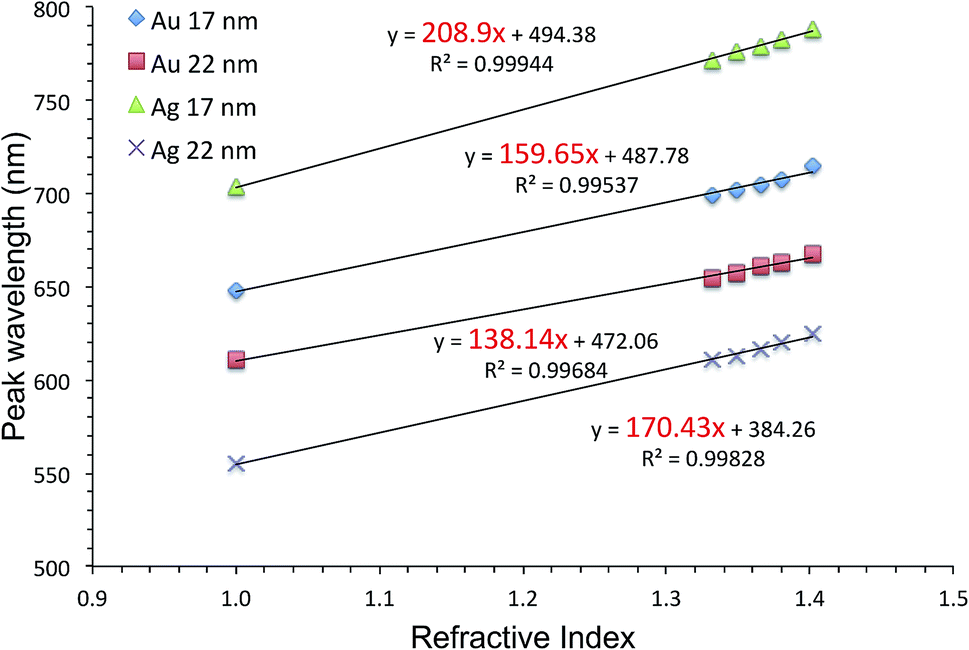 | ||
| Fig. 6 The extinction peak wavelength as a function of the refractive index for 1-BT treated Au- and AgFON LSPR sensors, with 17 and 22 nm thick top layers. | ||
There have been reports that under some circumstance, a protective layer can enhance the figure of merit when coated with Au and SiO2.65,76,77 Thus, we conclude that the 1-BT treatment not only succeeded in stabilizing the sensor but also lead to improvements in the figure of merit, 208.9 and 170.43 nm per RIU for the 17 and 22 nm thick AgLSPR sensors respectively.
3.5 Antigen-antibody reaction
Fig. 7 shows that the improvement in the figure of merit translates into enhanced biosensing capability. The sensor was placed under the optical fiber for monitoring of the extinction spectrum and the space between the sensor and the fiber was filled completely with a buffer solution. The mixing mechanism shown in Fig. S1† was turned on. The sensor was first incubated in the primary antibody solution for a few minutes, followed by rinsing with PBS. Subsequently, 30 mL of the secondary antibody solution was pipetted in gently; after dilution, the final concentration was reduced by half. AgFON LSPR sensors are not only capable of monitoring antigen–antibody reactions but they are also superior to AuFON LSPR sensors.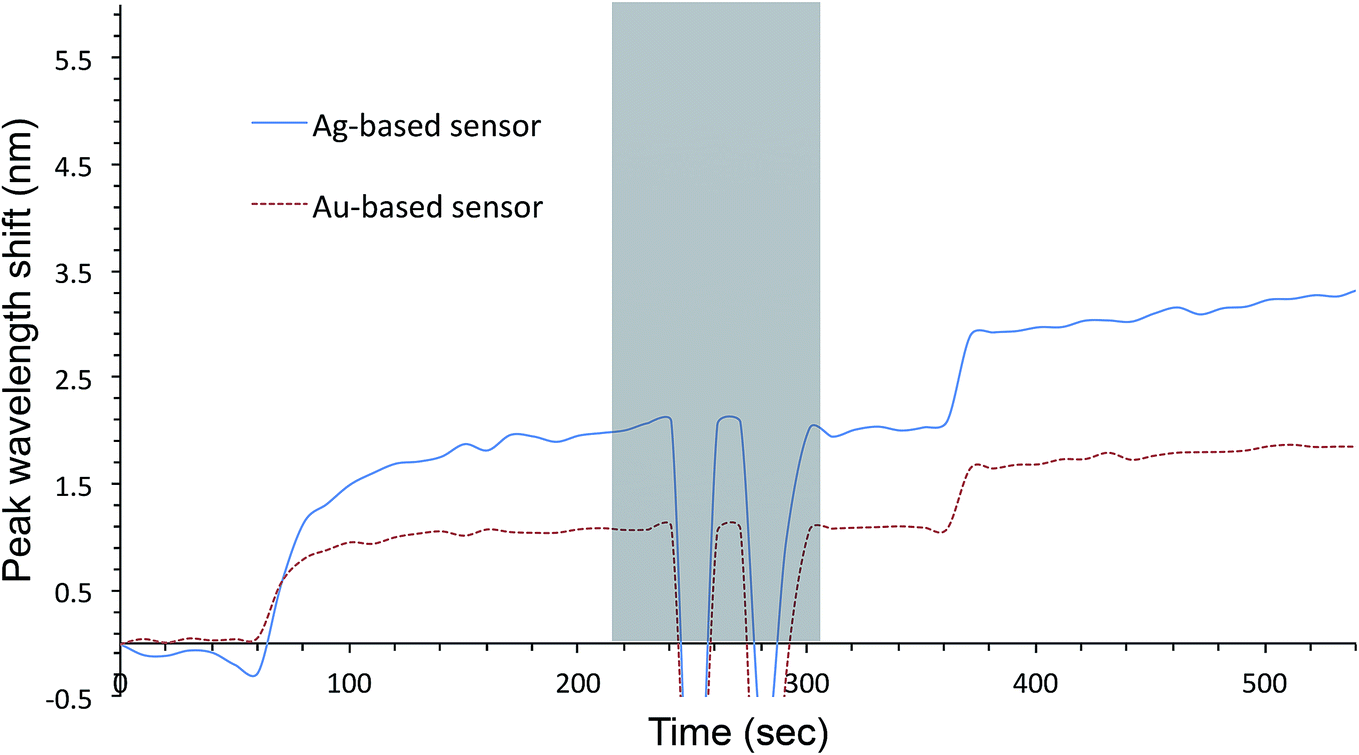 | ||
| Fig. 7 Response of a 1-BT treated sensor as a biosensor. The sensor was first incubated in the primary antibody solution for a few minutes, followed by rinsing with PBS. Subsequently, 30 μL of the secondary antibody solution was pipetted in gently; after dilution, the final concentration was reduced by half. | ||
3.6 Adsorption of 1-BT, 1-HT and 1-OC characterized with SERS
SERS spectra of AgFON LSPR sensors exposed to 1-BT, 1-HT and 1-OT vapors for 30 min are shown in Fig. 8. These SERS spectra closely resemble those in the literature.69,70 Specifically for 1-BT, the peak at 699 cm−1 is most likely due to the trans ν(C–S) while there is no peak around 637 cm−1 where the gauche ν(C–S) might appear.71 The same authors attributed a peak at ca. 1103 cm−1 to the trans ν(C–C). The former peak reflects the crystallinity of the inner section and the latter reflects that of the outer section. Both inner and outer sections are crystalline. The inset in Fig. 8 show Raman spectra of liquid 1-BT held in a glass capillary and an empty glass capillary, and a SERS spectrum of 1-BT adsorbed on a sensor. The total absence of the 2575 cm−1 peak shows that the alkanethiol exists as thiolate form.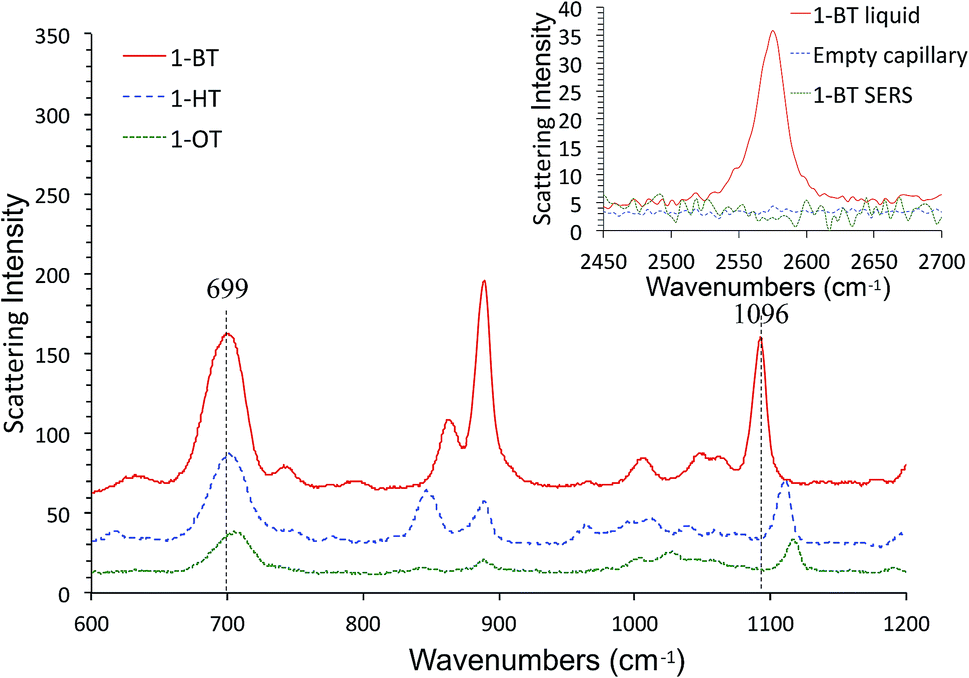 | ||
| Fig. 8 SERS spectra of 1-BT, 1-HT and 1-OT after 30 min exposure to their vapors. The inset shows Raman spectra of liquid 1-BT held in a glass capillary and an empty glass capillary, and a SERS spectrum of 1-BT in the S–H stretch region. | ||
Fig. 9 show time-course change of the 1-BT SERS spectrum with different exposure times, ranging from 5 min to 28 hours. Equivalent spectra for 1-HT and 1-OT are shown in Fig. S3 and S4† respectively. The ν(C–S)T peak ca. at 700 cm−1 is full-fledged only after 5 min exposure, but the ν(C–C)T peak ca. at 1100 cm−1 becomes saturated only after 15 min. This is illustrated by the inset in Fig. 9. This behavior applies to 1-HT and 1-OT as well, Fig. S3 and S4.† Another observation is that the ν(C–S)T peak (∼700 cm−1) shifts toward higher energies with increasing exposure time. For 1-BT, it shifts from 697 cm−1 to 706 cm−1. Similar shifts are also observed for 1-OT and 1-HT.
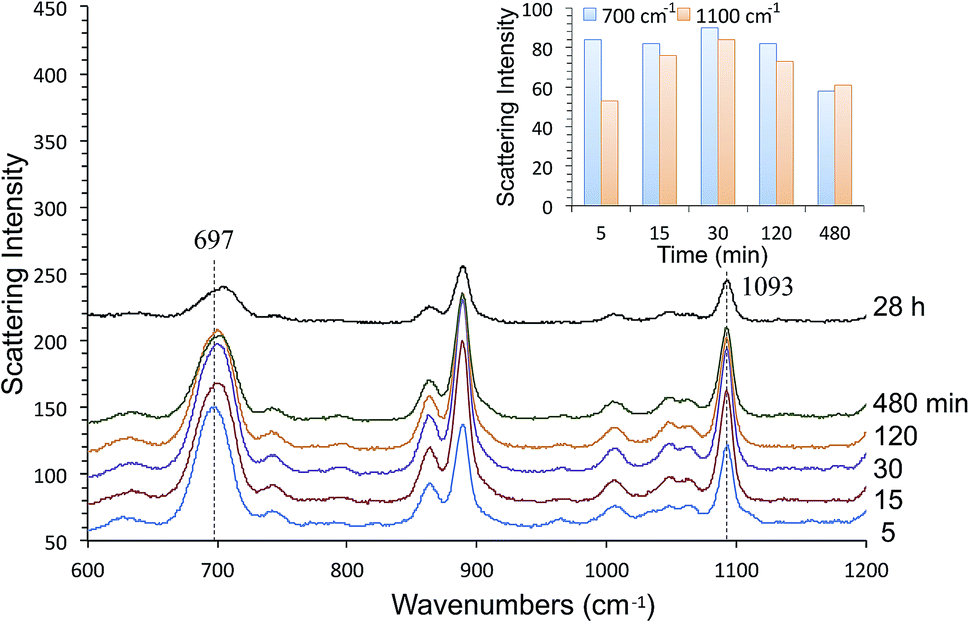 | ||
| Fig. 9 The 1-BT adsorption process evaluated by time-course changes in SERS measurements. The inset shows time-course changes of the 700 cm−1 and 1100 cm−1 peaks. | ||
4. Discussion
4.1 Instability of AgFON nanostructures
Even with 60 mM NaCl, the lowest concentration we investigated, the extinction peak disappeared within 30 s, making unprotected AgFON LSPR sensors totally inadequate. Element analysis detected little chloride in absolute term, less than 0.1% in comparison to silver in the mass ratio. In relative terms, there was an increase of some 79% after immersion into 250 mM NaCl solution, as shown in Fig. S5.† The amount of silver itself did not change significantly, a reduction of less than 10%. We speculate that even though morphology changed drastically upon immersion in NaCl solutions as shown in Fig. 5, most silver remained on the surface. Presence of NaCl may induce mobility of Ag atoms. Previous works on SEF spectroscopy demonstrated that immersion of silver substrates to a NaCl solution improved the enhancement ratio at lower concentrations.9As for gold, HIM images in Fig. S2† reveal very little change in morphology upon immersion into 250 mM NaCl solution even though its extinction spectrum undergoes noticeable change as shown in Fig. 3. Any effect by halogen such as I−,78 and Cl− and Br−,79 taking place around the gap area is most likely to affect the spectrum, but in the past, we observed that an increase in the gap distance among adjacent nanospheres in our random MFON nanostructure lead to blue-shifts rather than red-shifts.80
4.2 Longer term protection by alkanethiol molecules
Effectiveness of the alkanethiol treatment was examined over different time periods. While it had been found that sensors immediately after the treatment were stable even in the presence of high concentration NaCl, we were concerned that short alkanethiols might desorb from the sensor surface, thus rendering the treatment short-lived.53 To find out, we evaluated stability of treated sensors by immersed into 250 mM NaCl solution after the storage periods up to two weeks. Results are summarized in Table S1.†1-BT was an unlikely candidate as a protective layer for silver surfaces because studies on gold surfaces have shown that SAMs are formed only by longer alkanethiols with the cut-off number of carbon atoms in the range of 5–11.61,72 Adsorption of 1-BT onto gold has been studied in detail more recently.75,81 Along with 1-methanethiol and 1-pentanethiol, 1-BT exhibited negligible van der Waals interaction, and they were found to be all rather mobile by STM observation. With 1-BT, the steric interaction dominates the adsorption process and molecules are reported to lie flat on the surface as clusters.
Protection of copper and silver surfaces has been studied from early days of SAM investigation.52,61,62,82 Laibinis et al. studied oxidation of thiol-protected copper surfaces with XPS and found that copper and thiolates became oxidized at the same rate and the oxidation rate decreased by 50% when the length of SAM was increased by four CH2 units.52 With IR spectroscopy and impedance measurements, they further found that an unoxidized copper surface was protected with SAM with the number of carbon atoms greater than 16, exposure to even pure O2 at 100% relative humidity failed to oxidize the surface.62
Pemberton et al. studied oxidation of alkanethiols adsorbed on silver surfaces.61 When they compared alkanethiols with various numbers of carbon atoms, n = 2, 11, and 17, the shortest alkanethiol was oxidized only after two hours. Once oxidized into sulfinate or sulfonate, molecules were readily removed from the surface. They also reported that it was mostly ozone rather than oxygen which was responsible for oxidation, but they did not specifically mention the effect of ozone on the silver surface itself.
Van Duyne et al. studied silver nanoparticles coated by a wide range of alkanethiols, including 1-BT.43 Their paper includes data suggesting that treatment of their NSL-based LSPR sensors with ethanolic solution of 1-BT did not eliminate the extinction peak. Our study shows that ethanol also has a corrosive effect on silver nanostructures so that the fact that 1-BT suspended in ethanol did not eliminate the peak is suggestive of a possibility that 1-BT functioned as a protective layer in their experiment.
Use of curved surfaces rather than atomically flat surfaces, as in this study, may have some effect.73 While previous studies on SAM systems on regular colloids suggest unless the radius of the colloid is much smaller than 10 nm, no significant difference exists from the view point of surface protection. It is reported that stress within the SAM structure can increase for longer alkanethiols, but overall surface roughness is thought not to have a large influence. On the other hand, atomic edges may be effective for anchoring alkanethiol molecules. Our HIM images show irregular surfaces and further detailed studies are called for.
The solvent effect by water or alcohol is, however, still rather minor when compared to cases where halogen is involved. Even gold can be affected significantly by halogen such as Cl− and Br−.79 By using a wide range of analytical tools such as electrochemistry, FTIR and STM, they concluded that longer alkanethiols were more effective as a protective layer. Less well-ordered SAMs formed from hydrophilic thiols were mobile and thus able to cover exposed areas by lying horizontally. Scrisombat et al. showed that CH3SH was endowed with electrochemical blocking characteristics even though CH3SH, along with CH3CH2SH and CH3(CH2)5SH, was quite mobile and forms a 2-D liquid phase.53,74 On the other hand they reported that defects were resistant against displacement. Poirier et al. also reported that CH3CH2SH and CH3(CH2)5SH were both in liquid phase with the latter also possessing solid domains.
While short alkanethiols do not form a well-ordered SAM due to their negligible van der Waals force, our investigation clearly shows that 1-BT has a stabilizing effect on both Au- and AgFON LSPR sensors. Without the 1-BT protective layer, morphology underwent drastic change as confirmed by HIM images, and element analysis suggests that hardly any AgCl is formed on the surface and little silver is lost in terms of its total mass. The 1-BT protective layer, however, shows a remarkable ability to resist corrosion of the underlying gold and silver layers.
1-BT is more likely to be oxidized and become desorbed from the surface than 1-HT and 1-OT, but it is more effective as a protective layer after a storage period. Malinsky et al. reported that it was effective for a few days for Ag-based LSPR sensors.43
With the 1-BT treatment, both Au- and AgFON LSPR sensors remained stable. For the former, there was no noticeable difference in the effect of various alkanethiols under different storage conditions, and all retained similar abilities to resist NaCl. Nonetheless, it is shorter alkanethiols whose effect was more reproducible. For the AgFON LSPR sensor, different alkanethiols showed different behaviors under various storage conditions. With 1-HT and 1-OT treatments followed by storage under the ambient condition, the spectrum shift was reduced but not completely suppressed. Storage under the N2 enriched environment turned out be better suited.
4.3 Adsorption process as interpreted by SERS measurements
The thiol treatment had to be carried out overnight for effective protection against NaCl. Shorter treatments lead to unsatisfactory results. While shorter alkanethiols are thought not to form robust SAMs, our SERS measurements show that both inner and outer sections of the SAM are crystalline for all three alkanethiols studied. Looking at relative intensities of the ν(C–C)T (∼1100 cm−1) and ν(C–S)T (∼700 cm−1) peaks as a function of time reveals that the C–C section continues to undergo change after the initial rapid formation of the Ag–S bond during the first 5 min. This may reflect a slow reorientation process. On the other hand, it has been reported that SERS peak intensities do not necessarily reflect the packing density,83 but the density affects the conformation. As no conformational change is supported by neither ν(C–S)T peak nor and ν(C–C)T peak, the adsorption, at least in hot spots, is almost complete within the first 5 min. As a matter of fact, hot spots making a significant contribution are thought to occupy a relatively small portion of the surface, the gap region between adjacent nanospheres. If hot spots responsible for SERS signals are quickly occupied by 1-BT molecules on the order of 15 min, and it might take many more hours before a fully effective SAM protective layer is formed.84 SERS observations in our study are not likely to reveal what happens on top of the cap-shaped nanoparticles, away from the gap region. SERS spectra of 1-HT and 1-BT in Fig. S3 and S4† show these alkanethiols do adsorb on the sensor. Their time-course changes seen Fig. S3 and S4† are as rapid as that of 1-BT, even though their peak intensities are reduced in comparison to those of 1-BT as seen Fig. 8. Reduction in peak intensities for longer alkanethiols is, however, consistent with results from Ansar et al.835. Conclusions
We have described LSPR sensors fabricated from random Au- and AgFON nanostructures. Both gold and nanostructures were unstable against high concentration of NaCl, but we found that short alkanethiols, particularly 1-BT, were effective for protecting these nanostructures as monitored by the peak wavelength of the extinction peak and observed by HIM. The peak wavelength was steady and there was no discernible change in morphology. It was surprising because such short alkanethiols have van der Waals interactions too weak to form a SAM. Moreover, they are reported to be quite mobile and should readily desorb from the surface. Nonetheless we showed that protection of Ag- and AuFON nanostructures with short alkanethiols is rather effective, even against 250 mM NaCl. 1-BT treated AgFON LSPR sensors have better figures of merit over treated as well as untreated AuFON LSPR sensors.Characterization of our random MFON nanostructures with SERS measurements revealed that the alkanethiol adsorption takes place in multiple phases as revealed by the time course changes of the ν(C–S)T (∼700 cm−1) and ν(C–C)T (∼1100 cm−1) peaks. The former peak becomes saturated within the first 5 min whereas the latter requires at least 15 min to reach its full intensity. In the early phase, hot spots become fully occupied by alkanethiol molecules relatively quickly. In the middle phase beyond the initial 15 min, the inner section of the alkanethiol continue to undergo changes as revealed by the higher energy shift of the 700 cm−1 peak. While SERS measurements do no show further changes after 30 min, alkanethiol molecules continue to adsorb onto the rest of the metal surface in the last phase until the entire surface becomes covered, as evinced by the longer time necessary to form a fully protective coating. This may be due to our inability to monitor molecular events outsides hot spots, away from the gap region.
The method for protecting silver nanostructures is useful not only for LSPR sensing but also for those used in other optical techniques such as SERS and SEF. It is particularly a pressing issue for intricate nanostructures prepared in a vacuum system whereby nanostructures are not protected by a capping agent during the preparation procedure.
Conflicts of interest
There are no conflicts to declare.References
- C. L. Haynes and R. P. Van Duyne, J. Phys. Chem. B, 2001, 105, 5599 CrossRef CAS.
- J. N. Anker, W. P. Hall, O. Lyandres, N. C. Shah, J. Zhao and R. P. Van Duyne, Nat. Mater., 2008, 7, 442 CrossRef CAS PubMed.
- S. Lal, N. K. Grady, J. Kundu, C. S. Levin, J. B. Lassiter and N. J. Halas, Chem. Soc. Rev., 2008, 37, 898 RSC.
- C. J. DeSantis and S. E. Skrabalak, Langmuir, 2012, 28, 9055 CrossRef CAS PubMed.
- P. C. Angelomé, H. H. Mezerji, B. Goris, I. Pastoriza-Santos, J. Pérez-Juste, S. Bals and L. M. Liz-Marzán, Chem. Mater., 2012, 24, 1393 CrossRef.
- F. P. Zamborini, L. Bao and R. Dasari, Anal. Chem., 2012, 84, 541 CrossRef CAS PubMed.
- L. Soares, A. Csáki, J. Jatschka, W. Fritzsche, O. Flores, R. Franco and E. Pereira, Analyst, 2014, 139, 4964 RSC.
- R. N. Cassar, D. Graham, I. Larmour, A. W. Wark and K. Faulds, Vib. Spectrosc., 2014, 71, 41 CrossRef CAS.
- T. Yamaguchi, T. Kaya and H. Takei, Anal. Biochem., 2007, 364, 171 CrossRef CAS PubMed.
- F. Le, D. W. Brandl, Y. A. Urzhumov, H. Wang, J. Kundu, N. J. Halas, J. Aizpurua and P. Nordlander, ACS Nano, 2008, 2, 707 CrossRef CAS PubMed.
- J. R. Lakovicz, K. Ray, M. Chowdhury, H. Szmacinski, Y. Fu, J. Zhang and K. Nowaczyk, Analyst, 2008, 133, 1308 RSC.
- G. McNay, D. Eustace, W. E. Smith, K. Faulds and D. Graham, Appl. Spectrosc., 2011, 65, 825 CrossRef CAS PubMed.
- M. A. Garcia, J. Phys. D: Appl. Phys., 2011, 44, 283001 CrossRef.
- M. Rycenga, C. M. Cobley, J. Zeng, W. Li, C. H. Moran, Q. Zhang, D. Qin and Y. Xia, Chem. Rev., 2011, 111, 3669 CrossRef CAS PubMed.
- M. Bauch, K. Toma, M. Toma, Q. Zhang and J. Dostalek, Plasmonics, 2014, 9, 781 CrossRef CAS PubMed.
- H. Takei, J. Saito, K. Kato, H. Vieker, A. Beyer and A. Gölzhäuser, J. Nanomater., 2015, 316189 Search PubMed.
- K. S. McKeating, M. Couture, M.-P. Dinel, S. Garneau-Tsodikova and J.-F. Masson, Analyst, 2016, 141, 5120 RSC.
- D. E. Charles, D. Aherne, M. Gara, D. M. Ledwith, Y. K. Gun’ko, J. M. Kelly, W. J. Blau and M. E. Brennan-Fournet, ACS Nano, 2010, 4, 55 CrossRef CAS PubMed.
- U. Kreibig and M. Vollmer, Optical Properties of Metal Clusters, Springer Series in Materials Science, Springer, Berlin, Heidelberg, vol. 25, 1995 Search PubMed.
- S. Unser, I. Bruzas, J. He and L. Sagle, Sensors, 2015, 15, 15684 CrossRef PubMed.
- M. Himmelhaus and H. Takei, Actuators, B, 2000, 63, 24 CrossRef CAS.
- Y. Sun and Y. Xia, Anal. Chem., 2002, 74, 5297 CrossRef CAS PubMed.
- N. Nath and A. Chilkoti, Anal. Chem., 2004, 76, 5370 CrossRef CAS PubMed.
- M. M. Miller and A. A. Lazarides, J. Phys. Chem. B, 2005, 109, 21556 CrossRef CAS PubMed.
- T. Endo, K. Kerman, N. Nagatani, H. M. Hiepa, D.-K. Kim, Y. Yonezawa, K. Nakano and E. Tamiya, Anal. Chem., 2006, 78, 6465 CrossRef CAS PubMed.
- H. Chen, X. Kou, Z. Yang, W. Ni and J. Wang, Langmuir, 2008, 24, 5233 CrossRef CAS PubMed.
- A. B. Dahlin, S. Chen, M. P. Jonsson, L. Gunnarsson, M. Käll and F. Höök, Anal. Chem., 2009, 81, 6572 CrossRef CAS PubMed.
- S. Dutta, K. Saikia and P. Nath, RSC Adv., 2016, 6, 21871 RSC.
- D. A. Schultz, Curr. Opin. Biotechnol., 2003, 14, 13 CrossRef CAS PubMed.
- S. Jayabal, A. Pandikumar, H. N. Lim, R. Ramaraj, T. Sun and N. M. Huang, Analyst, 2015, 140, 2540 RSC.
- S.-H. Park, J.-H. Im, J.-W. Im, B.-H. Chun and J.-H. Kim, Microchem. J., 1999, 63, 71 CrossRef CAS.
- T. Okamoto, I. Yamaguchi and T. Kobayashi, Opt. Lett., 2000, 25, 372 CrossRef CAS PubMed.
- T. Okamoto and I. Yamaguchi, J. Phys. Chem. B, 2003, 107, 10321 CrossRef CAS.
- L. Guo, A. R. Ferhan, K. Lee and D.-H. Kim, Anal. Chem., 2011, 83, 2605 CrossRef CAS PubMed.
- G. K. Joshi, P. J. McClory, S. Dolai and R. Sardar, J. Mater. Chem., 2012, 22, 923 RSC.
- S. S. Aćimović, M. P. Kreuzer, M. U. González and R. Quidant, ACS Nano, 2009, 3, 1231 CrossRef PubMed.
- M. P. Raphael, J. A. Christodoulides, S. P. Mulvaney, M. M. Miller, J. P. Long and J. M. Byers, Anal. Chem., 2012, 84, 1367 CrossRef CAS PubMed.
- S. Kaye, Z. Zeng, M. Sanders, K. Chittur, P. M. Koelle, R. Lindquist, U. Manne, Y. Lin and J. Wei, Analyst, 2017, 142, 1974 RSC.
- C.-Y. Tsai, S.-P. Lu, J.-W. Lin and P.-T. Lee, Appl. Phys. Lett., 2011, 98, 153108 CrossRef PubMed.
- R. P. Van Duyne, J. C. Hulteen and D. A. Treichel, J. Chem. Phys., 1993, 99, 2101 CrossRef CAS.
- J. Stropp, G. Trachta, G. Brehm and S. Schneider, J. Raman Spectrosc., 2003, 34, 26 CrossRef CAS.
- H. Takei, J. Vac. Sci. Technol., B: Microelectron. Nanometer Struct.--Process., Meas., Phenom., 1999, 17, 1906 CrossRef CAS.
- M. D. Malinsky, K. L. Kelly, G. C. Schatz and R. P. Van Duyne, J. Am. Chem. Soc., 2001, 123, 1471 CrossRef CAS.
- K. M. Mayer and J. H. Hafner, Chem. Rev., 2011, 111, 3828 CrossRef CAS PubMed.
- H. Takei, N. Bessho, A. Ishii, T. Okamoto, A. Beyer, H. Vieker and A. Gölzhäuser, Langmuir, 2014, 30, 2297 CrossRef CAS PubMed.
- M. Toma, K. Cho, J. B. Wood and R. M. Corn, Plasmonics, 2014, 9, 765 CrossRef CAS.
- E. M. Larsson, J. Alegret, M. Käll and D. S. Sutherland, Nano Lett., 2007, 7, 1256 CrossRef CAS PubMed.
- J. A. Huber, R. P. Van Duyne, E. M. Hicks and C. R. Yonzon, Nanoscale, 2006, 3, 39 Search PubMed.
- S. Chen, M. Svedendahl, R. P. Van Duyne and M. Käll, Nano Lett., 2011, 11, 1826 CrossRef CAS PubMed.
- S. S. Zhao, M. A. Bichelberger, D. Y. Colin, R. Robitaille, J. N. Pelletier and J.-F. Masson, Analyst, 2012, 137, 4742 RSC.
- J.-F. Masson, ACS Sens., 2017, 2, 16 CrossRef CAS PubMed.
- P. E. Laibinis and G. M. Whitesides, J. Am. Chem. Soc., 1992, 114, 9022 CrossRef CAS.
- L. Srisombat, A. C. Jamison and T. R. Lee, Colloids Surf., A, 2011, 390, 1 CrossRef CAS.
- J. S. Sekhon and S. S. Verma, Plasmonics, 2011, 6, 311 CrossRef CAS.
- H. Takei and T. Yamaguchi, Phys. Chem. Chem. Phys., 2010, 12, 4505 RSC.
- Y. He, G. K. Larsen, W. Ingram and Y. Zhao, Nano Lett., 2014, 14, 1976 CrossRef CAS PubMed.
- D.-K. Kim, S. M. Yao, T. J. Park, H. Yoshikawa, E. Tamiya, J. Y. Park and S. Y. Lee, Anal. Chem., 2011, 83, 6215 CrossRef CAS PubMed.
- G. H. Chan, J. Zhao, E. M. Hicks, G. C. Schatz and R. P. Van Duyne, Nano Lett., 2007, 7, 1947 CrossRef CAS.
- S. Uchida, N. Zettsu, K. Endo and K. Yamamura, Nanoscale Res. Lett., 2013, 8, 274 CrossRef PubMed.
- A. Bansal, J. S. Sekhon and S. S. Verma, Plasmonics, 2014, 9, 143 CrossRef CAS.
- M. H. Schoenfisch and J. E. Pemberton, J. Am. Chem. Soc., 1998, 120, 4502 CrossRef CAS.
- G. K. Jennings, J. C. Munro, T.-H. Yong and P. E. Laibinis, Langmuir, 1998, 14, 6130 CrossRef CAS.
- M. Ishibashi, M. Itoh, H. Nishihara and K. Aramaki, Electrochim. Acta, 1996, 41, 241 CrossRef CAS.
- C. Radloff and N. J. Halas, Appl. Phys. Lett., 2001, 79, 674 CrossRef CAS.
- M. J. Banholzer, N. Harris, J. E. Millstone, G. C. Schatz and C. A. Mirkin, J. Phys. Chem. C, 2010, 114, 7521 CrossRef CAS.
- C. Gao, Z. Lu, Y. Liu, Q. Zhang, M. Chi, Q. Cheng and Y. Yin, Angew. Chem., Int. Ed., 2012, 51, 5629 CrossRef CAS PubMed.
- H. Takei and T. Okamoto, Anal. Sci., 2016, 32, 287 CrossRef CAS PubMed.
- I. Tijunelyte, E. Guenin, N. Lidgi-Guigui, F. Colas, J. Ibrahim, T. Toury and M. L. Lamy de la Chapelle, Nanoscale, 2016, 8, 7105 RSC.
- R. L. Garrell, J. E. Chadwick, D. L. Severance, N. A. McDonald and D. C. Myles, J. Am. Chem. Soc., 1995, 117, 11563 CrossRef CAS.
- M. Lewis, M. Tarlov and K. Carron, J. Am. Chem. Soc., 1995, 117, 9574 CrossRef CAS.
- M. A. Bryant and J. E. Pemberton, J. Am. Chem. Soc., 1991, 113, 8284 CrossRef CAS.
- M. D. Porter, T. B. Bright, D. L. Allara and C. E. D. Chidsey, J. Am. Chem. Soc., 1987, 109, 3559 CrossRef CAS.
- C. Vericat, M. E. Vela, G. Benitez, P. Carro and R. C. Salvarezza, Chem. Soc. Rev., 2010, 39, 1805 RSC.
- G. E. Poirier, M. J. Tarlov and H. E. Rushmeier, Langmuir, 1994, 10, 3383 CrossRef CAS.
- J. Yan, R. Ouyang, P. S. Jensen, E. Ascic, D. Tanner, B. Mao, J. Zhang, C. Tang, N. S. Hush, J. Ulstrup and J. R. Reimers, J. Am. Chem. Soc., 2014, 136, 17087 CrossRef CAS PubMed.
- L. Song, L. Zhang, Y. Huang, L. Chen, G. Zhang, Z. Shen, J. Zhang, Z. Xiao and T. Chen, Sci. Rep., 2017, 7, 3288 CrossRef PubMed.
- C. Li, Y. Li, Y. Ling, Y. Lai, C. Wu and Y. Zhao, Nanotechnology, 2014, 25, 045704 CrossRef PubMed.
- R. G. Nuzzo, F. A. Fusco and D. L. Allara, J. Am. Chem. Soc., 1987, 109, 2358 CrossRef CAS.
- F. P. Zamborini and R. M. Crooks, Langmuir, 1998, 14, 3279 CrossRef CAS.
- H. Takei and M. Himmelhaus, in Progress in Nano-Electro-Optics III, Springer, Berlin, 2005 Search PubMed.
- Y. Wang, Q. Chi, N. S. Hush, J. R. Reimers, J. Zhang and J. Ulstrup, J. Phys. Chem. C, 2011, 115, 10630 CrossRef CAS.
- G. K. Jennings and P. E. Laibinis, Colloids Surf., A, 1996, 116, 105 CrossRef CAS.
- S. M. Ansar, M. Gadogbe, K. Siriwardana, J. Y. Howe, S. Dogel, H. Hosseinkhannazer, W. E. Collier, J. Rodriguez, S. Zou and D. Zhang, J. Phys. Chem. C, 2014, 118, 24925 CrossRef CAS.
- S. R. Beeram and F. Zamborini, J. Am. Chem. Soc., 2009, 131, 11689 CrossRef CAS PubMed.
Footnote |
| † Electronic supplementary information (ESI) available. See DOI: 10.1039/c8ra09778j |
| This journal is © The Royal Society of Chemistry 2019 |