
 Open Access Article
 This Open Access Article is licensed under a
 Creative Commons Attribution 3.0 Unported Licence
Influence of surface tension-driven network parameters on backflow strength†
Yonghun Lee,
Islam Seder and
Sung-Jin Kim *
*
Department of Mechanical Engineering, Konkuk University, Seoul, 05029, Republic of Korea. E-mail: yahokim@konkuk.ac.kr; Fax: +82-0504-435-9201; Fax: +82-2-447-5886; Tel: +82-2-450-0517
First published on 2nd April 2019
Abstract
Surface tension-driven flow is widely used, owing to its spontaneous motion, in microfluidic devices with single channel structures. However, when multiple channels are used, unwanted backflow often occurs. This prevents precise and sophisticated solution flow, but has been rarely characterized. We hypothesize that, with an analytical model, the parameters that influence backflow can be systematically characterized to minimize the backflow. In a microfluidic network, inlet menisci and channels are modeled as variable pressure sources and fluidic conductors, respectively. Through the model and experiment, the influence of each network element on the backflow strength is studied. Backflow strength is affected by the interplay of multiple inlet-channel elements. With the decrease (increase) of the fluidic channel conductance (inlet size), the backflow pressure of the corresponding inlet decreases. On the other hand, backflow volume reaches its peak value during the radius change of the corresponding inlet. In networks consisting of five inlet-channel elements, backflow pressure decreases with increasing step number. Our results provide the foundations for microfluidic networks driven by the Laplace pressure of inlet menisci.
1. Introduction
Surface tension-driven flows are increasingly used in microfluidics, because they generate spontaneous solution flow and eliminate the need for external pumping systems. To date, studies have focused on the dynamics of surface tension-driven flows in a simple single channel.1–7 Such studies helped in characterizing the basic traits of the flow8–10 and developing surface tension-driven devices.11–15 Then, due to the recent demands for sequential and parallel assays, surface tension-driven devices have had increased numbers of channels and input solutions.16–18 Compared to flow behavior in the single channel, behavior in the multiple channels is more complex and is hard to orchestrate. However, flow characteristics in the network have been rarely studied with an analytical model.One problem observed in a surface tension-driven microfluidic network is the backflow of liquids. Backflow can occur in the surface tension-driven devices including polymer and even paper microfluidic devices, if the devices have at least three channels with a junction and Laplace pressure difference in their inlets. For the surface tension-driven flow, inlet menisci generate inlet pressures (i.e., the Laplace pressure). Importantly, this pressure significantly affects the motion of the flow. When multiple channels are prefilled with solutions and a solution is injected to an inlet, the inlet of the solution has high Laplace pressure and pushes other solutions to their corresponding inlets. The ideal case is that the initial flow direction in each channel is maintained until the flow stops. However, the flow direction in several channels can often reverse unexpectedly, resulting in backflows. Even when the filling of channels occurs by capillary action, backflow occurs. For example, when liquid fronts of two solutions merge at Y-junction and move to the junction downstream, one solution from an inlet unexpectedly moves back to the other inlet through the Y-junction.19–22 Such unwanted motion occurs by the imbalance of the Laplace pressure of inlets. To date, such unwanted backflows have been reported in the process of immunoassay,18,19 micromixing,20 blood typing,21 and cell-based assay.22 In the case of unexpected backflows in a surface tension-driven bioassay chip, the designed sequence of fluidic motion is changed unintentionally, and the detection of targets will fail. Thus, reducing backflow in network channels is a crucial challenge that must be overcome for such applications. Our recent study showed that backflow results from the difference between the time constant ratios of a network's inlet-channel elements.23 However, the contributions of network elements including channel fluidic conductance, inlet radius, and pressure to backflow strength were not analyzed in detail.
In this paper, we study the effect of each element of a surface tension-driven network on backflow strength. We model inlet menisci as variable pressure sources, and channels as fluidic conductors. Using the model, we characterize how the fluidic conductance of channels, and the radius and initial pressures of inlets, influence backflow strength. This analysis systematically explains the complex relations between network elements that affect backflow. Our model is first applied to characterize backflow in a surface tension-driven network with three inlets, and then extended to a network with five inlets.
2. Working process and theoretical modeling
In this section, we explain the process of capillary filling and backflow generation, and then discuss the corresponding theoretical model. Backflow can occur in a channel network consisting of multiple channels, Y-junctions, and multiple branched junctions. During the merging process of the solutions at the junctions, backflows occur by the pressure difference of inlets. To describe the basic process of backflow generation, we used a network with three inlets and three channels. This is the minimum element condition that can describe the backflow in a channel network. Three steps are used to fill the network and generate the backflow. Fig. 1a depicts the fluidic motion in the network in the last step; the motion is driven by the Laplace pressure of the inlet menisci. Fig. 1b presents each step. In step 1, solution 1 (green) injected at inlet 1 stops at a capillary valve24 of channel 1. In step 2, solution 2 (red) injected at inlet 2 moves through channel 2 to channel 1. The fluidic motion continues until the two inlet pressures equilibrate. Backflow does not occur because only two inlet pressures are involved for fluidic motion. Step 3 consists of two parts (steps 3a and 3b). In step 3a, solution 3 (clear) injected at inlet 3 moves into channels 1 and 2. Then in step 3b, the flow direction in either channel 1 or 2 is reversed and backflow may occur. The right panels of Fig. 1b present two cases with different backflow strengths. In case 1, solution 2 exits inlet 2 and moves back from channel 2 to channel 1, resulting in the strong backflow of solution 2. If channel 1 is the target channel that each solution needs to move into sequentially, then the sequence is disrupted in step 3 by the backflow. In case 2, although the backflow of solution 2 occurs, the flow stops in channel 2 without entering channel 1, and the backflow strength is weak. Thus, the three solutions were successfully injected into channel 1 in a sequential manner.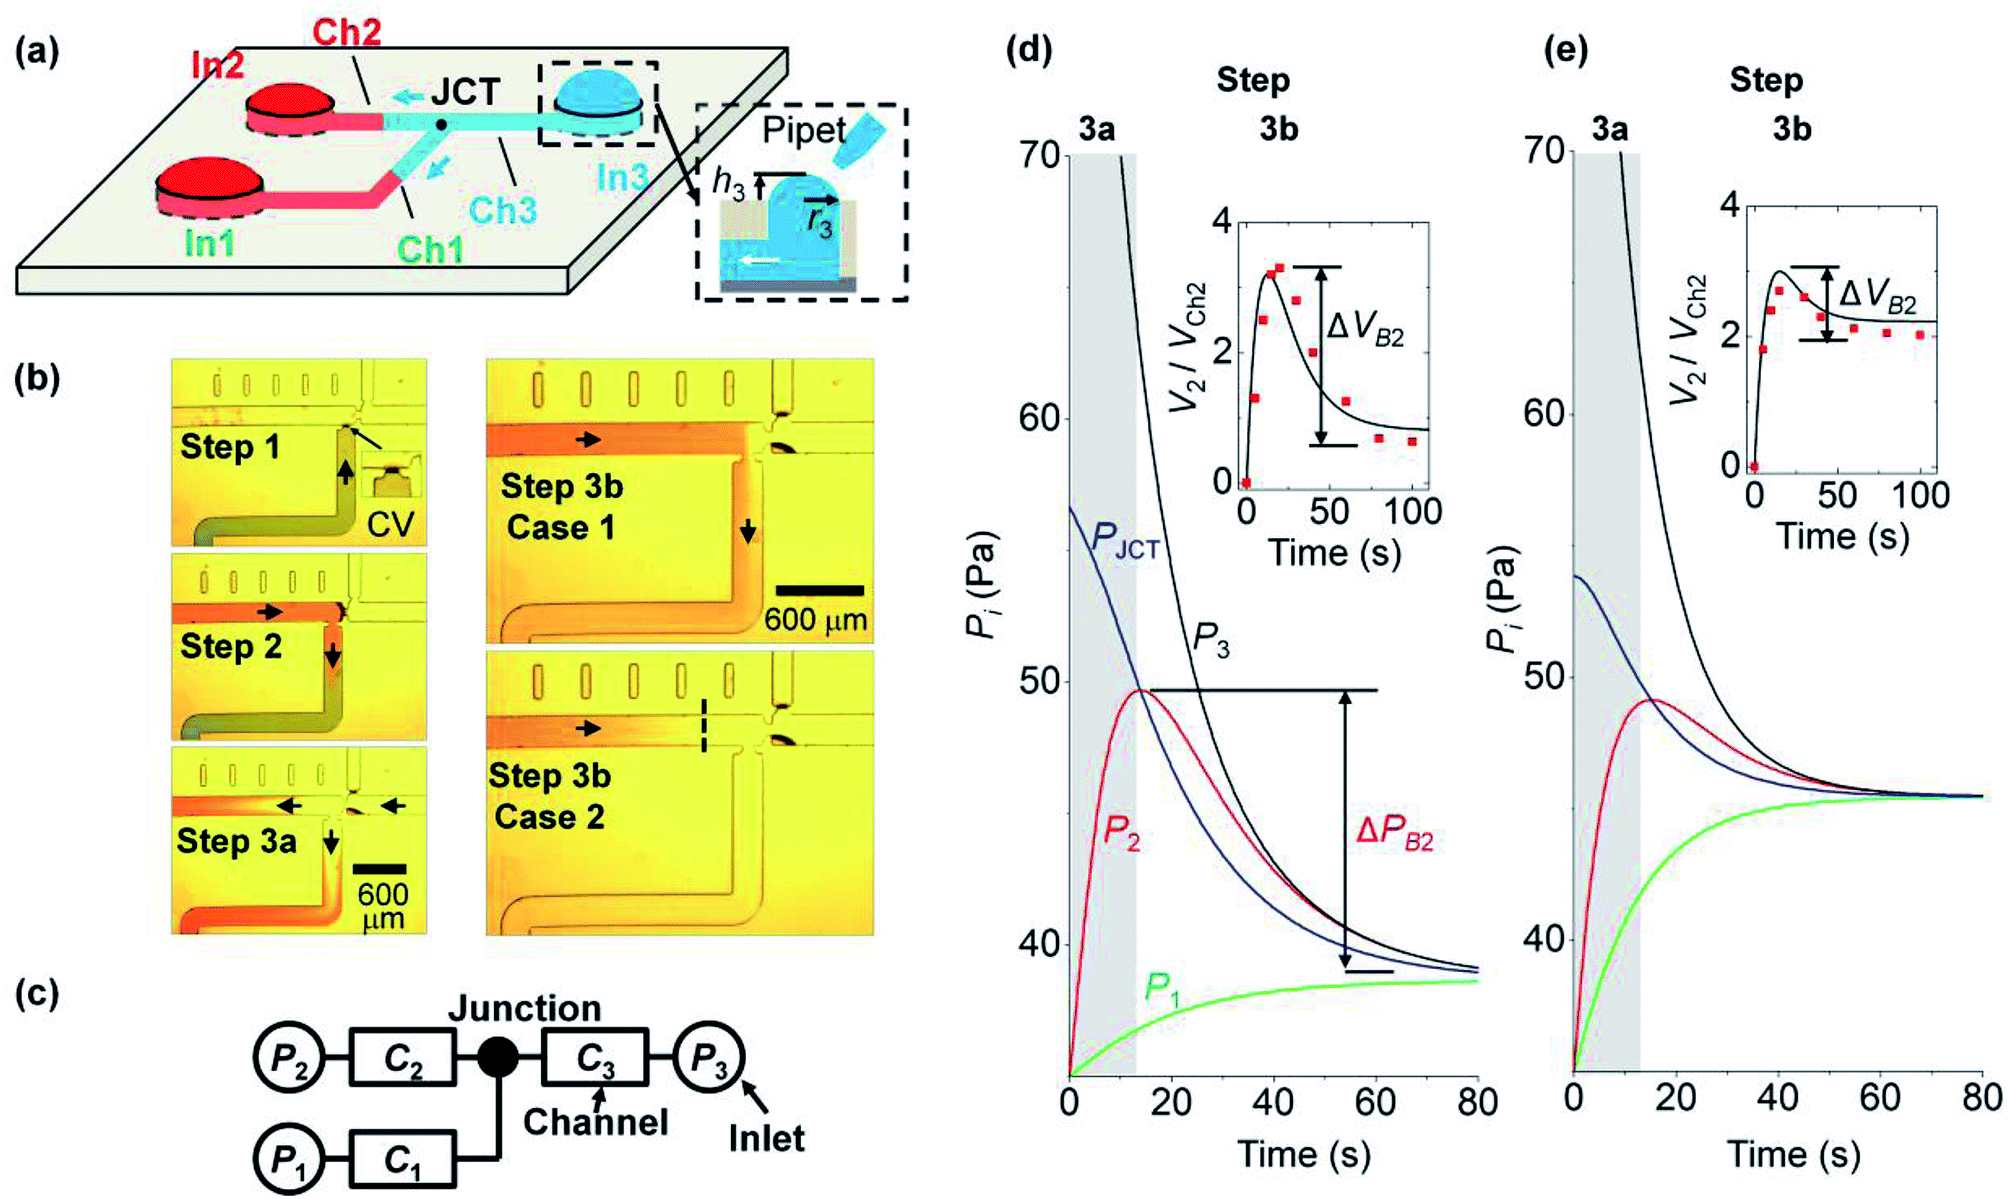 | ||
| Fig. 1 Surface tension-driven network showing backflow. (a) Generation of fluidic motion by the pressure difference of inlet menisci. Inlets (In i, i = 1 to 3) are connected to each other through channels (Ch i) and the junction (JCT). The inset shows the cross-section of inlet 3 with inlet radius r3 and meniscus height h3. (b) Photographs showing backflow generation process. The process consists of three steps, and backflow occurs in step 3b. Cases 1 and 2 show strong and weak backflows, respectively. In step 3, the initial pressures of inlet i (PIi) were the same for both cases with PIi = 35, 35, and 100 Pa (i = 1 to 3). (c) Circuit diagram of the capillary network. Pi is the pressure of inlet i with radius ri, and Ci is fluidic conductance of channel i. (d and e) Temporal change in inlet pressures in step 3. Lines and points are the theoretical and experimental values, respectively. Inlet i has pressure Pi in step 3. ΔPB2 is the backflow pressure of inlet 2, and ΔVB2 is the normalized backflow volume. In (d), ri = 2, 1, and 1 mm (i = 1 to 3), and Ci = 9, 9, and 9 (×10−12) m5 N−1 s−1. In (e), ri = 1.5, 1, and 1 mm, and Ci = 12, 9, and 9 (×10−12) m5 N−1 s−1. | ||
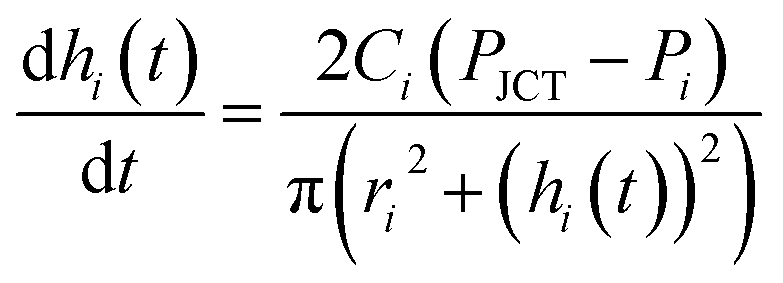
We modeled the process of backflow generation in a surface tension-driven network (Fig. 1c). The inlet menisci were modeled as variable pressure sources because the volume of each meniscus changes in each step, which temporally varies inlet pressures. The channels were modeled as fluidic conductors. The detailed derivation process is explained in Sections 1 and 2 of ESI.† The pressure (Pi) of inlet i is obtained by
 | (1) |
The pressure (PJCT) at the junction of the channels is obtained by the analogy of Kirchhoff's current law and is given by
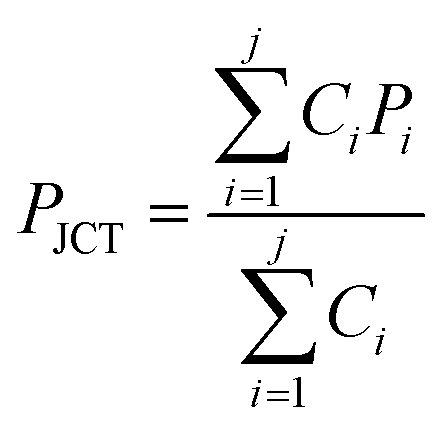 | (2) |
 | (3) |
Eqn (3) is obtained by the condition where change rate of inlet volume is the same with the flow rate in the channel that connects the corresponding inlet and the junction. In addition, for eqn (2) and (3) we use Poiseuille's law, which neglects the contribution of flow inertia in the relation between pressure and flow rate. This is because the Reynolds number is small (Re < 0.5) in our system. In eqn (3), the number of hi increases with increasing step number. For example, in step 2, h1 and h2 are used; and in step 3, h1, h2, and h3 are used. The corresponding numbers of Pi, ri, and Ci also increase with increasing step number. To solve the simultaneous differential form of eqn (3), we measured the initial values of hi in each step, and used them as the initial condition of each step. The equations were numerically solved with MATLAB.
3. Experimental
We fabricated devices using soft lithography technique.25 The devices have two layers. The top layer was produced from hydrophobic polydimethylsiloxane (PDMS) with channel features, while the bottom layer was comprised of hydrophilic slide glass. The hydrophilicity of the slide glass was increased by an air plasma machine (Femto Science) so that the solutions injected at the inlets can spontaneously fill the channels and meet at the junction. The dimensions of inlets and channels were measured to calculate the fluidic conductance of each channel. The channel dimensions were in the range 60–100 μm (h) × 180–400 μm (w) × 1.4–50 mm (l), with inlet radii ranging from 1 to 2.5 mm. The channel dimensions varied Ci in the range of 7 × 10⁻¹⁴ to 9 × 10⁻¹² m5 N−1 s−1. We used a stereo microscope (Olympus) and digital microscope (Dino-lite) to measure the meniscus height of each inlet. We used de-ionized water for the working solution and food dyes were added for flow visualization.4. Results and discussion
4.1. Backflow formation process
We analyze backflow formation with our model. Fig. 1d and e show the theoretical change in pressures that correspond to cases 1 (strong backflow) and 2 (weak backflow) in Fig. 1b, respectively. The solutions move from high to low pressure positions. In step 3a (gray region in Fig. 1d and e), the pressure condition is P3 > PJCT > P2 (PI2 = PI1). Thus, solution 3 at inlet 3 moves through the junction to inlets 1 and 2. Owing to the fluidic motions, P3 decreased and P1 and P2 increased. In step 3b (white region), P2 becomes greater than PJCT, which reverses the flow direction of solution 2 from inlet 2 to the junction. Thus, because P2 > PJCT > P1, solution 2 moves through the junction toward channel 1 and inlet 1. We note that the backflow volume of solution 2 is different for the two cases. The insets of Fig. 1d and e present the volume ratio (V2/VCh2) of the inlet meniscus volume (V2) and channel 2 volume (VCh2). VCh2 was fixed at 30 nL, and the initial value of V2 was expressed as 0 by subtracting its initial volume from V2. During backflow, V2/VCh2 decreases because solution 2 is released from inlet 2. To quantify the backflow volume at inlet 2, we define normalized backflow volume (ΔVB2, see the insets) at inlet 2 as ΔVB2 = (V2P − V2E)/VCh2, where V2P and V2E are the volumes of inlet 2 meniscus at the peak and equilibrium states of P2, respectively. The corresponding backflow pressure at inlet 2 (ΔPB2) is defined in Fig. 1d. If ΔVB2 > 1 (i.e., V2P − V2E > VCh2), then the volume that goes out of inlet 2 is greater than the channel 2 volume, so the backflow of solution 2 moves through channel 2 to another channel. This case is shown in the inset of Fig. 1d, where ΔVB2 = 2.8 > 1 (case 1 in Fig. 1b). In contrast, in the inset of Fig. 1e, ΔVB2 = 0.6 < 1, so solution 2 does not go out of channel 2 even for its backflow (case 2 in Fig. 1b). We analyzed how PIi, ri, and Ci influence the backflow strength at inlet 2.We note that the backflow shown in this system does not result from inertia of fluids. This is because the Reynolds number (Re), which is the ratio of inertia to viscous force, was Re < 0.5 in our system. For the inertia effect to be dominant, Re needs to be high. Indeed, the studies that reported backflows even in single channel systems had Re > 10, owing to large channel size and high inlet pressure driven by repeated injection of small drops.26–29 In addition, we used a solution containing food dye with the same concentration (3.6% by weight). Thus, there was no flow induced by concentration gradient.
4.2. Effect of fluidic conductance and channel size on the backflow
We study the effect of the fluidic conductance of channel i (Ci, i = 1 to 3) on the backflow. When one fluidic conductance was changed, the others were fixed at 7 × 10⁻¹² m5 N−1 s−1. In step 3, inlet 3 releases solution 3 to the other inlets, inlet 2 is the place where backflow occurs, and inlet 1 takes the backflow solution. We analyze the backflow of inlet 2 under the change of Ci. Fig. 2a shows that high C1 decreases ΔPB2 and ΔVB2. This behavior is explained by the fast rise of P1 and its resultant small difference between P1 and P2. When C1 increases, solution 3 injected from inlet 3 can easily move to inlet 1 rather than inlet 2. This is because comparatively high fluidic conductance of channel 1 allows rapid fluidic transport through channel 1 to inlet 1. As a result, P1 rapidly increases, according to the comparison P1 in the gray region of Fig. 1e and d. When P1 becomes high, the difference between P2 and P1 decreases (step 3b in Fig. 1d and e). Thus, the backflow that moves from inlet 2 toward inlet 1 decreases. Compared to C1, high C2 increases ΔPB2 and ΔVB2 (Fig. 2b). This is because, with high C2, solution 3 can easily move through channel 2 to inlet 2, thereby causing a more rapid increase in P2 in step 3a. Similar to C2, C3 increases ΔPB2 and ΔVB2 (Fig. 2c). With high C3, inlet 3 releases solution 3 more rapidly to the other channels through channel 3. This significantly increases P2 in step 3a and leads to high ΔPB2 and ΔVB2 in step 3b. In addition, when the size of channel 2 increases under constant condition of C2, ΔVB2 decreases. This result is analyzed in Section 4 of ESI.† | ||
| Fig. 2 Influence of Ci on the backflow of inlet 2. When one fluidic conductance was changed, the others were fixed at 7 × 10⁻¹² m5 N−1 s−1. Here, ri = 2, 1, and 1 mm (i = 1 to 3). In step 3, PIi = 35, 35, and 75 Pa. Variations of ΔPB2 and ΔVB2 by C1 are shown in (a), by C2 in (b), and by C3 in (c). Lines and points are the theoretical and experimental (n = 3) values, respectively. | ||
The backflow of inlet 2 by the change of Ci can be collectively explained. High C2 and C3 increase backflow of inlet 2. This is because, at step 3a, solution 3 moves more rapidly to inlet 2 through channels 2 and 3 owing to high C2 and C3. On the other hand, high C1 decreases the backflow of inlet 2. This is because solution 3 moves more to inlet 1 rather than inlet 2 by the high fluidic conductance of channel 1 in step 3a and finally reduces the backflow of inlet 2 by the small pressure difference between inlets 1 and 2.
4.3. Influence of inlet radius and inlet pressure on the backflow
Here, we analyze the effect of inlet radius on the backflow of inlet 2. Fig. 3a shows how the three inlets influence ΔPB2. First, the left panel of Fig. 3a shows that high r1 increases ΔPB2. This is because high r1 makes the change of P1 gradual (eqn (1)), leading to larger difference between P1 and P2 at the end of step 3a (Fig. 1d). As a result, ΔPB2 increases in step 3b. For the two cases of Ci (7, 7, and 7; and 5, 9, and 10 (×10−12) m5 N−1 s−1), this trend is maintained. Second, the middle panel of Fig. 3a shows that high r2 decreases ΔPB2. This is because increasing r2 reduces the change rate of P2 (eqn (1)), and P2 gradually increases in step 3a (Fig. 1d). Thus, difference between P1 and P2 at the end of step 3a in Fig. 1d becomes small, thereby reducing ΔPB2. Third, unlike the cases of r1 and r2, increasing r3 does not monotonously vary ΔPB2 (right panel of Fig. 3a). When r3 increases from 0.6 to 1.2 mm, ΔPB2 increases. Herein, the initial pressure of inlet 3 was kept at PI3 = 75 Pa regardless of r3. To meet the constant PI3 condition even for increasing r3, the initial meniscus volume of inlet 3 increases (Section 5 of ESI†). Consequently, a larger amount of solution 3 goes from inlet 3 to inlet 2, thereby increasing ΔPB2. On the other hand, when r3 becomes greater than 1.2 mm, ΔPB2 decreases. We explain this result by using the difference between P2 and PJCT that influences the flow from inlet 2 to the junction. Backflow occurs in step 3b only when P2 > PJCT (Fig. 1d). Importantly, backflow decreases if P2 − PJCT is small in step 3b; compare Fig. 1d and e. High r3 let PJCT stay at a high value through P3 in step 3b (Fig. 1d). This is because PJCT is considered as the weighted average of inlet pressures including P3 (eqn (2)) and slow decrease of P3 by high r3 let PJCT remain at a high value. Accordingly, pressure difference between PJCT and P2 decreases in step 3b, decreasing ΔPB2.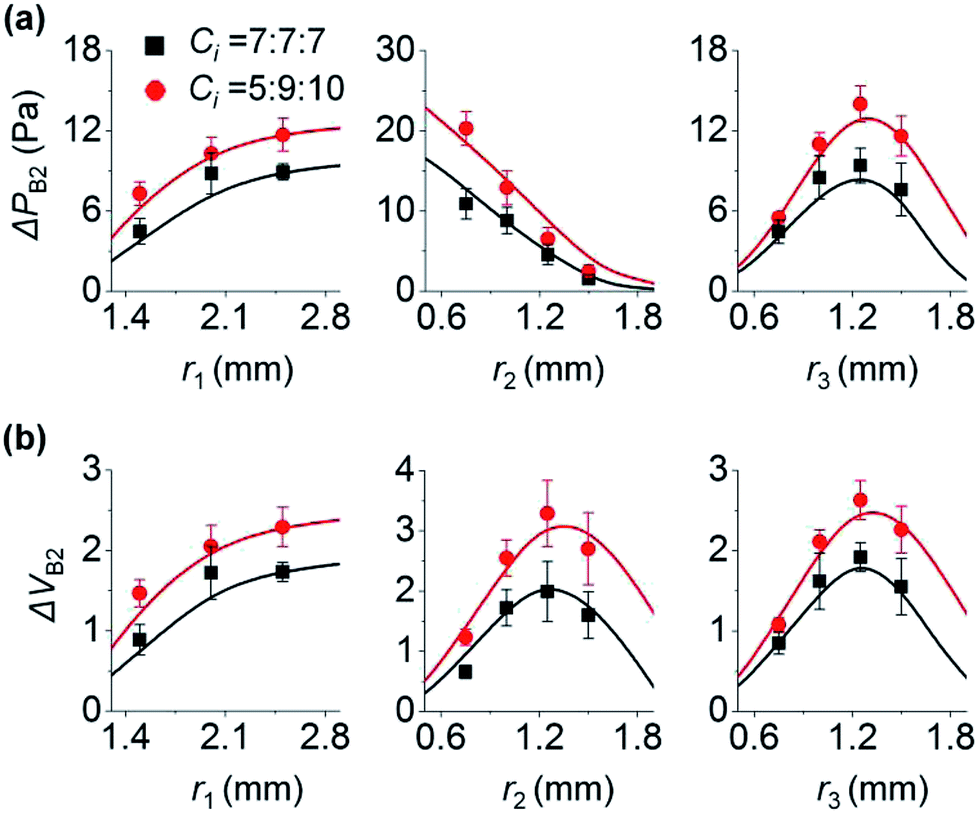 | ||
| Fig. 3 Influence of inlet radius ri on the backflow of inlet 2. Unless otherwise noted, r1 = 2 mm, and r2 = r3 = 1 mm. In step 3, PIi = 35, 35, and 75 Pa (i = 1 to 3). ΔPB2 and ΔVB2 are shown in (a) and (b), respectively. Lines and points are the theoretical and experimental (n = 3) values, respectively. | ||
Collectively, when inlet 1 receives backflow from inlet 2, high r1 decreases the difference between P1 and P2 at step 3a, leading to lower ΔPB2 at step 3b. Oppositely, high r2 increases the difference between P1 and P2, thus increasing ΔPB2 at step 3b. Increasing r3 rises ΔPB2 at first because of large volume of inlet 3 meniscus, and then reduces decreases ΔPB2 because of the low difference between P2 and PJCT at step 3b.
The change in ΔVB2 follows the trend of ΔPB2 when r1 and r3 vary (left and right panels of Fig. 3). As shown in Fig. 2, with Ci variation, ΔVB2 and ΔPB2 changed in the same manner. On the other hand, ΔVB2 varied differently with ΔPB2 with the change in r2 (middle panels of Fig. 3). ΔVB2 increases when r2 increases from 0.6 to 1.2 mm, and then decreases when r2 > 1.2 mm. The increasing r2 lets inlet 2 take more fluids from inlet 3 in step 3a (Section 6 of ESI†). This allows inlet 2 to release a greater amount of backflow volume in step 3b for 0.6 < r2 < 1.2 mm. However, with increasing r2, the reduction of P2 becomes more gradual in step 3b while PJCT insignificantly changes by r2. This leads to the reduced difference between PJCT and P2, thus decreasing ΔVB2 for r2 > 1.2 mm in step 3b.
To study the effect of the initial inlet pressures (PIi) in step 3 on the backflow, PIi values were varied and the backflow at inlet 2 was measured. Here, PI3 was 75 Pa for different values of PI2, with PI2 = PI1. We used three sets of Ci, as shown in Fig. 4. Under this condition, ΔPB2 and ΔVB2 unanimously increased with the increasing PI3 − PI2. This is because at higher PI3 − PI2, a comparatively larger amount of inlet meniscus volume is used for inlet 3, which results in higher ΔPB2 and ΔVB2.
 | ||
| Fig. 4 Effect of initial pressure (PIi) of inlet i in step 3 on the backflow of inlet 2. Lines and points are the theoretical and experimental (n = 3) values, respectively. | ||
4.4. The effect of increasing step on reducing the backflow
So far, we have studied the backflow in surface tension-driven networks with three inlets and three channels. Now, we expand our understanding to surface tension-driven networks with five inlets and five channels with one junction. Fig. 5a shows the circuit diagram of the surface tension-driven network. Solution i was injected at inlet i in step i, and the initial pressures of inlet i in step i were 35, 35, 75, 75, and 75 Pa, respectively. The left to right panels of Fig. 5b show the change in ΔPBi and ΔVBi at inlet i (i = 1 to 3). For example, inlet 4 (right panel) shows the changes in ΔPB4 and ΔVB4 only in step 5 without steps 3 and 4. This is because the injection to inlet 4 occurs in step 4, and inlet 4 is empty before step 4. Similarly, inlet 3 (middle panel) shows the variations in ΔPB3 and ΔVB3 only in steps 4 and 5, without step 3.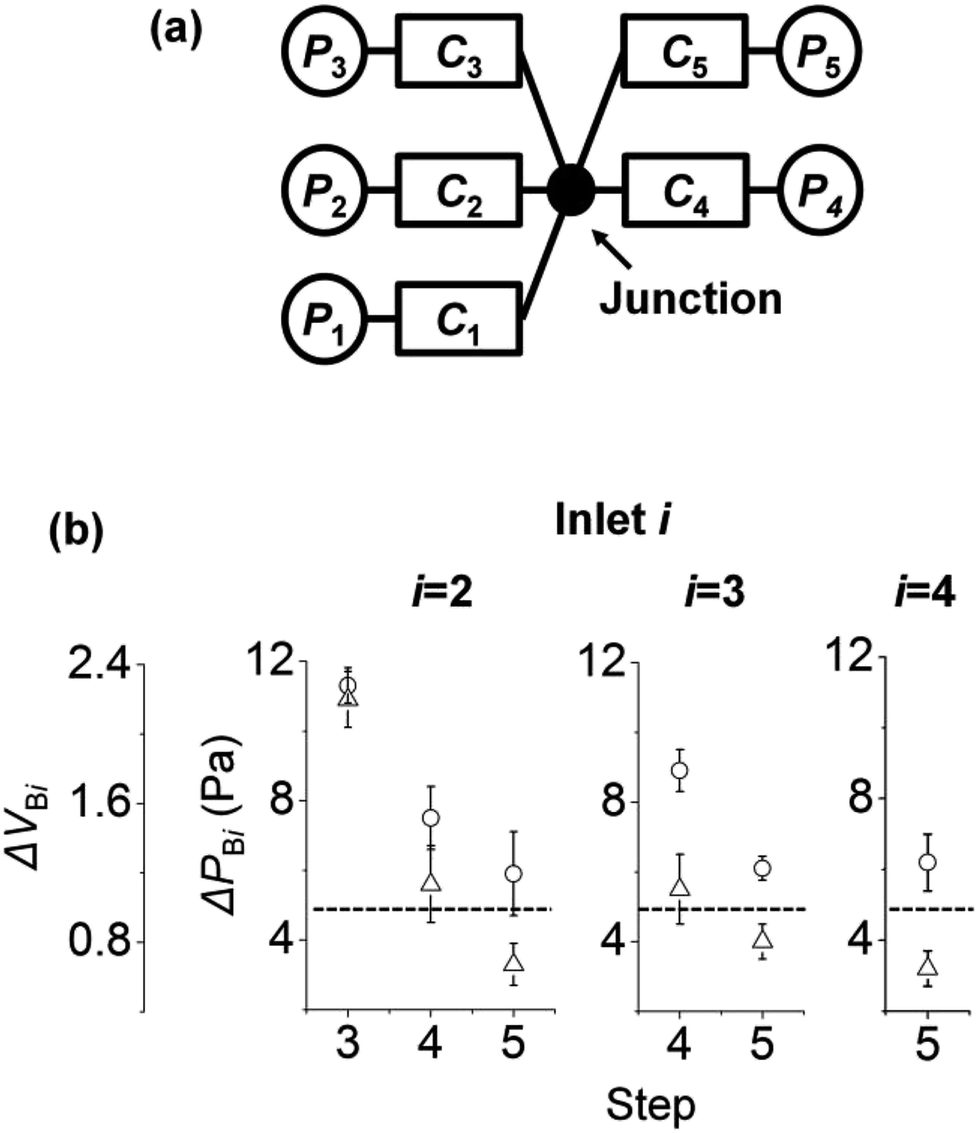 | ||
| Fig. 5 Backflow in surface tension-driven networks with five inlets and five channels. (a) Circuit diagram of the surface tension-driven network. (b) Change of ΔPBi and ΔVBi at inlet i (i = 2 to 4). Symbols designate subsets: circles for case 1; triangles for case 2. In case 1, Cj = 5, 10, 9, 13, and 13 (×10−12) m5 N−1 s−1 (j = 1 to 5). In case 2, Cj = 5, 10, 9, 5, 4 (×10−12) m5 N−1 s−1. For both cases, rj = 2, 1, 1, 1, and 1 mm. For ΔVBi < 1 (under the dashed line), the backflow of inlet i stays in channel i and does not go into other channels. The error bars were obtained from five experiments. | ||
For inlets 2 and 3, ΔPBi and ΔVBi decrease as the step number increases. The initial pressures of inlets increase with increasing step number. This is because by adding solutions to inlets, the volumes of inlet menisci increase as the step number increases. On the other hand, we set the initial pressure of inlet i in step i (i = 3 to 5) as constant at 75 Pa. As a result, the initial pressure difference between inlet i and the other inlets in step i decreased. In Fig. 4, we explained that the backflow pressure at inlet 2 decreases if the pressure difference between PI3 and PI2 is reduced in step 3. Thus, similar to the case in Fig. 4, ΔPBi and ΔVBi decrease with increasing step number. In addition, if ΔVBi is under the dashed lines (ΔVBi < 1) in Fig. 5b, then the backflow of inlet i stays in channel i and does not go into other channels.
In addition, our model is broadly applicable to analyze the backflow of the paper microfluidic devices as well as polymer devices. This is because, even for a paper device with porous layer, its inlet pressure can be modeled as variable pressure source by Laplace pressure and its channels can be modeled as fluidic conductor. Specifically, although paper channels follow Darcy's law and polymer channels obey Poiseuille's law, in the two laws flow rate (Q) is commonly proportional to pressure difference (ΔP). That is, Q = CΔP, where C is fluidic conductance of a channel. C is Ak/(μL) in a paper channel and is πr4/(8μL) in a polymer channel with circular cross section. Here, A is cross sectional area of channel, μ is viscosity, L is filled channel length, k is permeability, r is channel radius. Thus, because of the similarity between the two channel types, our model is applicable to paper microfluidic devices.
5. Conclusion
Our main contributions for a surface tension-driven network, where the pressure difference of the inlet menisci drives fluidic motions, are as follows: (i) developing a detailed model that describes the backflow strength of the surface tension-driven network; (ii) analyzing the contributions of network parameters (e.g., fluidic conductance of channels, inlet radius, and initial pressure of inlets) to the backflow strength; (iii) characterizing the nonlinear relation between backflow volume and backflow pressure by the change of inlet radius; and (iv) presenting the change in backflow pressure with increasing step numbers.We showed that each network element, including channel and inlet, has distinct characteristics that affect the change in inlet pressure. A large inlet size makes the change in the corresponding inlet pressure slow. Low fluidic conductance of a channel also makes the pressure change of the inlet directly connected to the channel slow. These two characteristics result in the complex behaviors of inlet pressures when the network elements constitute a surface tension-driven network. Backflow pressure decreases with the decrease (increase) in the corresponding fluidic channel conductance (inlet size). On the other hand, backflow volume reaches its peak value in the middle of the radius change of the corresponding inlet. This is because the inlet pressure was strongly affected by the radius change, but other inlet pressures were insignificantly influenced. In addition, we showed that backflow strength decreases when the initial pressure difference between the inlets decreases. Finally, we showed that in networks consisting of five inlet-channel elements, backflow pressure decreases as the step number increases because the pressure difference between the inlet where the solution is injected and the other inlets decreases. Findings in this study provide useful guidelines for controlling backflow in surface tension driven networks. Further studies could be performed to analyze and prevent backflows in more complex microfluidic networks with multiple junctions.
Conflicts of interest
There are no conflicts of interest to declare.Acknowledgements
This study was supported by Konkuk University in 2016.References
- G. M. Walker and D. J. Beebe, A passive pumping method for microfluidic devices, Lab Chip, 2002, 2(3), 131–134 RSC.
- E. Berthier and D. J. Beebe, Flow rate analysis of a surface tension driven passive micropump, Lab Chip, 2007, 7(11), 1475–1478 RSC.
- A. Javadi, M. Habibi, F. S. Taheri, S. Moulinet and D. Bonn, Effect of wetting on capillary pumping in microchannels, Sci. Rep., 2013, 3, 1412 CrossRef PubMed.
- T. T. Al-Housseiny, P. A. Tsai and H. A. Stone, Control of interfacial instabilities using flow geometry, Nat. Phys., 2012, 8(10), 747 Search PubMed.
- E. Elizalde, R. Urteaga and C. L. Berli, Rational design of capillary-driven flows for paper-based microfluidics, Lab Chip, 2015, 15(10), 2173–2180 RSC.
- E. Elizalde, R. Urteaga, R. R. Koropecki and C. L. Berli, Inverse problem of capillary filling, Phys. Rev. Lett., 2014, 112(13), 134502 CrossRef PubMed.
- M. Zimmermann, H. Schmid, P. Hunziker and E. Delamarche, Capillary pumps for autonomous capillary systems, Lab Chip, 2007, 7(1), 119–125 RSC.
- V. G. Levich and V. S. Krylov, Surface-tension-driven phenomena, Annu. Rev. Fluid Mech., 1969, 1(1), 293–316 CrossRef.
- E. Boucher, Capillary phenomena: properties of systems with fluid/fluid interfaces, Rep. Prog. Phys., 1980, 43(4), 497 CrossRef.
- J. W. Van Honschoten, N. Brunets and N. R. Tas, Capillarity at the nanoscale, Chem. Soc. Rev., 2010, 39(3), 1096–1114 RSC.
- I. Meyvantsson, J. W. Warrick, S. Hayes, A. Skoien and D. J. Beebe, Automated cell culture in high density tubeless microfluidic device arrays, Lab Chip, 2008, 8(5), 717–724 RSC.
- J. Warrick, I. Meyvantsson, J. Ju and D. J. Beebe, High-throughput microfluidics: improved sample treatment and washing over standard wells, Lab Chip, 2007, 7(3), 316–321 RSC.
- T. J. Clark, P. H. McPherson and K. F. Buechler, The triage cardiac panel: Cardiac markers for the triage system, Point of Care, 2002, 1(1), 42–46 Search PubMed.
- E. Delamarche, D. Juncker and H. Schmid, Microfluidics for processing surfaces and miniaturizing biological assays, Adv. Mater., 2005, 17(24), 2911–2933 CrossRef CAS.
- M. Choi, Y. Na and S. J. Kim, Hydrophilic strips for preventing air bubble formation in a microfluidic chamber, Electrophoresis, 2015, 36(23), 2896–2901 CrossRef CAS PubMed.
- A. Olanrewaju, M. Beaugrand, M. Yafia and D. Juncker, Capillary microfluidics in microchannels: from microfluidic networks to capillaric circuits, Lab Chip, 2018, 18(16), 2323–2347 RSC.
- S.-J. Kim, S. Paczesny, S. Takayama and K. Kurabayashi, Preprogrammed, parallel on-chip immunoassay using system-level capillarity control, Anal. Chem., 2013, 85(14), 6902–6907 CrossRef CAS PubMed.
- S.-J. Kim, S. Paczesny, S. Takayama and K. Kurabayashi, Preprogrammed capillarity to passively control system-level sequential and parallel microfluidic flows, Lab Chip, 2013, 13(11), 2091–2098 RSC.
- S.-J. Kim, Y. T. Lim, H. Yang, Y. B. Shin, K. Kim, D.-S. Lee, S. H. Park and Y. T. Kim, Passive microfluidic control of two merging streams by capillarity and relative flow resistance, Anal. Chem., 2005, 77(19), 6494–6499 CrossRef CAS PubMed.
- A. R. Rezk, A. Qi, J. R. Friend, W. H. Li and L. Y. Yeo, Uniform mixing in paper-based microfluidic systems using surface acoustic waves, Lab Chip, 2012, 12(4), 773–779 RSC.
- Y. Zhai, A. Wang, D. Koh, P. Schneider and K. W. Oh, A robust, portable and backflow-free micromixing device based on both capillary-and vacuum-driven flows, Lab Chip, 2018, 18(2), 276–284 RSC.
- E. Berthier, J. Warrick, B. Casavant and D. J. Beebe, Pipette-friendly laminar flow patterning for cell-based assays, Lab Chip, 2011, 11(12), 2060–2065 RSC.
- Y. Lee, M. Choi and S.-J. Kim, Method to prevent backflow in a capillarity network for bioassays: Exploiting time constant ratios, Sens. Actuators, B, 2018, 255, 3630–3635 CrossRef CAS.
- A. Gliere and C. Delattre, Modeling and fabrication of capillary stop valves for planar microfluidic systems, Sens. Actuators, A, 2006, 130, 601–608 CrossRef.
- Y. Xia and G. M. Whitesides, Soft lithography, Angew. Chem., Int. Ed., 1998, 37(5), 550–575 CrossRef CAS PubMed.
- P. J. Resto, E. Berthier, D. J. Beebe and J. C. Williams, An inertia enhanced passive pumping mechanism for fluid flow in microfluidic devices, Lab Chip, 2012, 12(12), 2221–2228 RSC.
- J. Ju, J. Y. Park, K. C. Kim, H. Kim, E. Berthier, D. J. Beebe and S.-H. Lee, Backward flow in a surface tension driven micropump, J. Micromech. Microeng., 2008, 18(8), 087002 CrossRef.
- P. J. Resto, B. J. Mogen, E. Berthier and J. C. Williams, An automated microdroplet passive pumping platform for high-speed and packeted microfluidic flow applications, Lab Chip, 2010, 10(1), 23–26 RSC.
- B. Lavi, A. Marmur and J. Bachmann, Porous media characterization by the two-liquid method: effect of dynamic contact angle and inertia, Langmuir, 2008, 24(5), 1918–1923 CrossRef CAS PubMed.
Footnote |
| † Electronic supplementary information (ESI) available: Modeling pressures of inlet meniscus and channel junction. Modeling the relation between meniscus height and inlet pressure. Change of meniscus height and volume of inlet by inlet radius. Change of volume ratio and inlet pressures by radius of inlet 2. See DOI: 10.1039/c8ra09756a |
| This journal is © The Royal Society of Chemistry 2019 |