
 Open Access Article
 This Open Access Article is licensed under a
 Creative Commons Attribution 3.0 Unported Licence
Numerical simulation of oscillatory oblique stagnation point flow of a magneto micropolar nanofluid
Muhammad Adil Sadiqa,
Arif Ullah Khan*bd,
S. Saleem *c and
S. Nadeemb
*c and
S. Nadeemb
aDepartment of Mathematics, DCC-KFUPM, Box 5084, Dhahran 31261, Saudi Arabia
bDepartment of Mathematics, Quaid-i-Azam University, 45320, Islamabad 44000, Pakistan. E-mail: aukhan@math.qau.edu.pk
cDepartment of Mathematics, College of Sciences, King Khalid University, Abha 61413, Saudi Arabia. E-mail: saakhtar@kku.edu.sa
dDepartment of Mathematics, University of Science and Technology, Bannu, KPK, Pakistan
First published on 6th February 2019
Abstract
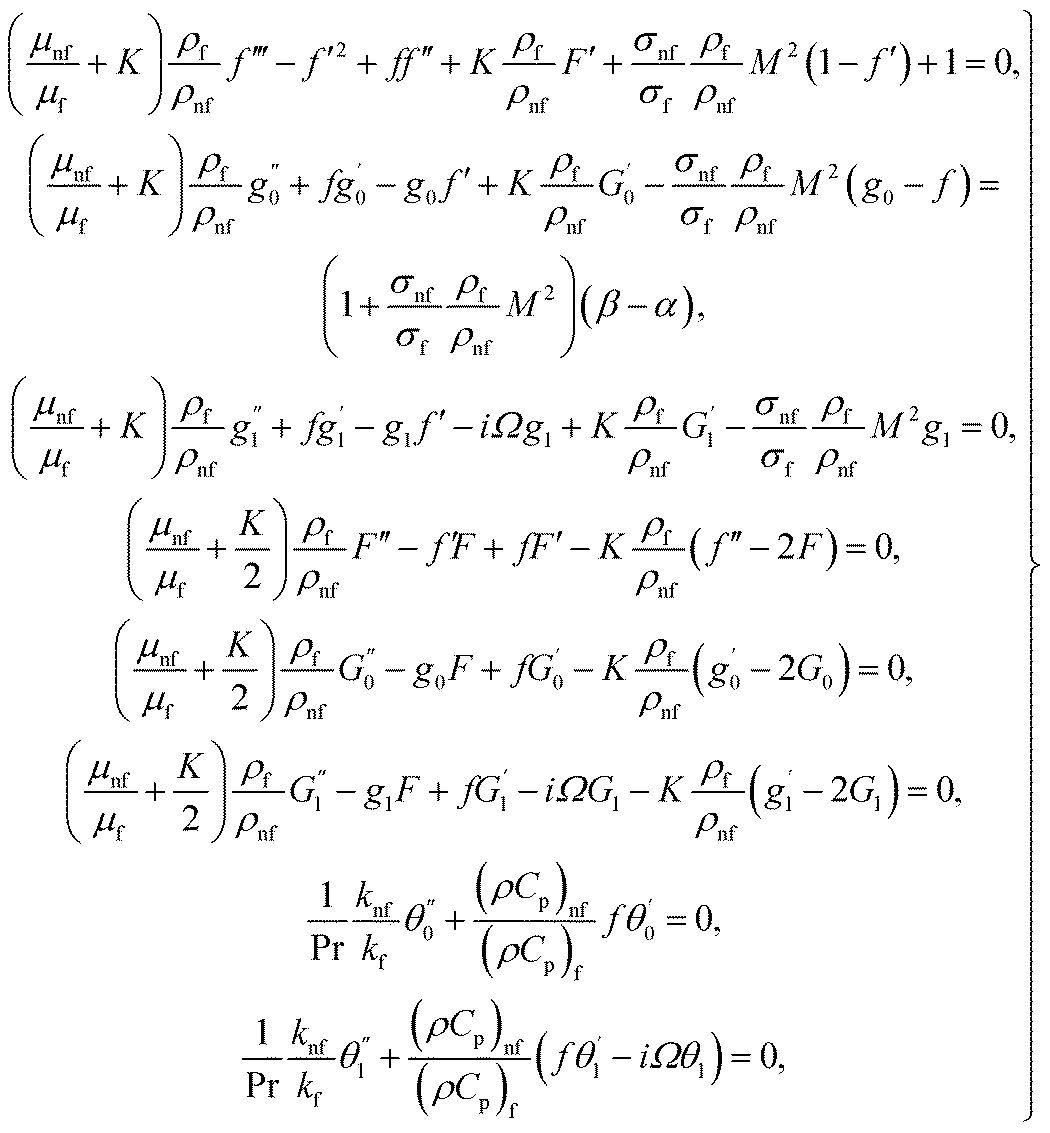
The particular inquiry is made to envision the characteristics of magneto-hydrodynamic oscillatory oblique stagnation point flow of micropolar nanofluid. The applied magnetic field is assumed parallel towards isolating streamline. A relative investigation is executed for copper and alumina nanoparticles while seeing water type base fluid. To be more specific, in the presence of both weak and strong concentration, the physical situation of micropolar fluid is mathematically modeled in terms of differential equations. The transformed mixed system is finally elucidated by midpoint method with the Richardson extrapolation development and shooting mechanism with fifth order R–K Fehlberg technique. The impact of governing parameters are shown and explored graphically. The obtained results are compared with existing published literature. Moreover, it is found that the magnetic susceptibility of nanofluids shows provoking nature towards copper as compared to Alumina. Also it is perceived that Cu–water shows higher wall shear stress and heat transfer rate than Al2O3–water. Additional, the thickness of momentum boundary layer is thin for weak concentration as related to strong concentration.
1. Introduction
The study of nanofluids claims remarkable practical applications in investigational and modern disciplines. The disclosure of nanoparticles has enhanced the proficiency and decreased the budget of cooling and warming structures. As anyone might expect, analysts additionally notice the subsequent information: the nanoparticles enhance both the thermal conductivity and apparent viscosity significantly of the nanofluid. Thus, additional propelling power is needed to retain the nanofluid flow over the device. The reduction in pumping cost for a cooling system because of small size particles was probed by Choi.1 Murshed et al.2 observed that the operative thermal conductivity and viciousness of nanofluids considerably enhanced by particle volume fraction. The variation of thermal conductivity for nanofluids largely depends on the shape, size, and material of which nanoparticles are made. The effectiveness of nanoparticles is not limited towards coolants. Scientists and researchers have noticed a few other successful employments of particles examined in ref. 3. Nanofluids are presently being created for therapeutic applications, including cancer treatment and safe surgery by cooling. The blockage of UV rays can be achieved by using nanoparticles (zinc oxide) into plastic packaging and also offer an anti-bacterial shield. This helps to rectify the strength and stability of the plastic sheets. A recent application of nanofluid flow is nano-drug delivery. Pak and Cho4 deliberated the characteristics of heat flux in the fluid by adding metallic oxide particles (nanometer-sized) to it. This attempt reports that the inciting nature of heat transfer is actually because of the alteration in thermal conductivity of the metallic particles and common fluid. Aftab et al.5 investigated the nanoconfined phase change materials for thermal energy applications. Far along6–12 noticed that the nanoparticles are the source of variations in heat transfer. It is important to note that during these attempts uniform distributions of nanoparticles are assumed throughout the flow regime. Buongiorno13 identified such elements entertained velocity slips towards base fluid molecules are unable to maintain uniform concentration throughout the flow regime. The mechanism of seven-slip was proposed by him who can play an active role in the heat transfer enhancement. Further, he declared that both thermal and Brownian diffusion is most active slip mechanisms. Sheikholeslami and Ganji14 scrutinized the nanofluid flow together with heat transfer by means of corresponding plates squeezing. They established the direct relation of Nusselt number with nanoparticle volume fraction, Eckert number and squeeze number towards separated plates. Recently, Khan et al.15 explore the magneto-hydrodynamic flow under the region of oblique stagnation point with slip effect for water-based nanofluid containing, and (as nanoparticles). They found that –water is the source of enrichment of heat transfer at the sheet followed by –water and –water. Nadeem et al.16 examined the model-based study of SWCNT and MWCNT thermal conductivities effect on the heat transfer due to the oscillating wall conditions. Combined effects of viscous dissipation and Joule heating on MHD Sisko nanofluid over a stretching cylinder was deliberated by Hussain et al.17 Sheikholeslami et al.18 described the flow of CuO nanoparticles with radiation and discharging rate.An analysis of micropolar liquids has captivated the devotion of investigators and experts in the field of fluid science. Such consideration is due to fact that the conventional Newtonian fluids cannot depict the complete description of fluid flow in various biological and industrial applications. For polar fluids, a distinct and special kind of microstructure material claims stress tensor which should be non-symmetric. Basically, in terms of the physical frame, it depicts those materials which consist of situated molecules (arbitrarily) cast out in a viscous liquid. The variations in couple stress, body couples, micro-rotational and disclose micro-inertial are supported by polar fluids. In general, the majority of the physiological liquids treated as polar fluid like suspensions of rigid or deformable particles in the viscous fluid, plasma, and cervical. In short, Eringen19 was the earliest to mention the theory of micropolar fluids. After his study, micropolar fluids have been recognized widely by researchers because of numerous engineering and industrial applications. To mention just a few, cervical flows, contaminated and clean engine lubricants, colloids and polymeric suspensions, thrust bearing technologies and radial diffusion paint rheology.
Micropolar fluids do act together closely with nanofluids as micropolar fluids are fluids with microstructure and nanofluid are colloidal suspension of metallic or non-metallic nanosize particles in the base fluid. Physically micropolar fluids symbolize fluids comprising of rigid, randomly oriented (or spherical) particles suspended in a viscous medium. These particles may be of nano-size, which actually makes the micropolar fluids to behave as nanofluids. Physical examples of micropolar fluids can be seen in ferrofluids, blood flows, bubbly liquids, liquid crystals, and so on, all of them containing intrinsic polarities. It is important to note that some of these micropolar fluids do behave as nanofluid with heat transfer enhancement characteristics due to the presence of nanosize particles apart from their intrinsic polarities. The addition of nanoparticles in a micropolar fluid, make the mixture more complex as compare to conventional nanofluids and offer investigators with a new dimension to explore the fluid flow characteristics.
The fluid (cerebrospinal) motion in the brain was identified by Power20 and he has shown that the Cerebrospinal fluid is adequately modeled through micropolar fluids. Lukaszewicz21 explained in his book about the physical aspects of micropolar fluids regarding practical applications. Das22 examined the flow characteristics of heat-mass transfer in the micropolar fluid over an inclined sheet along with both chemical reaction and thermophoresis effects. Double diffusive unsteady convective micropolar flow past a vertical porous plate moving through binary mixture using modified Boussinesq approximation was discussed by Animansaun.23 Recently, the impact of temperature dependent viscosity on the micropolar fluid flow by way of two nanofluids was taken by Nadeem et al.24 They found that both micro rotation viscosity and micro inertia density are a function of temperature dependent dynamic viscosity. More recently, Gina Nov et al.25 scrutinized the properties of micropolar fluid flow in a wavy differentially heated cavity with natural convection effect. Whereas, the impression of magnetic field on micropolar fluid flow along a vertical channel was explored by Borrelli et al.26 Some important literature which enhances the features of micropolar fluids is given in ref. 27–29. Takhar et al.29 examined MHD flow over a moving plate in a rotating fluid with the magnetic field, Hall currents, and free stream velocity. MHD stagnation point flow with flexible features was investigated by Khan et al.30 Genuinely, in the manufacturing production of polymer fluids, colloidal solutions and the fluid having minor additives; there is frequently a point where the local velocity of the fluid owns symmetric stress tensor and micro-rotation of particles is nil. Some of the important studies about stagnation point flow are given in ref. 31–34.
The review of the above-mentioned literature reflects that as yet, the impact of magnetic field on oblique stagnation point flow of micropolar nanofluid with the manifestation of copper and alumina nanoparticles is not been addressed on an oscillating surface. So, in this article, the influence of nanoparticles is added by activating nanoparticles viscosities and thermal conductivity effective model. The problem is of more importance because, micropolar fluids do interact closely with nanofluids since micropolar fluids are fluids with microstructure and nanofluid are colloidal suspension of metallic or non-metallic nanosize particles in the base fluid. Physically speaking, micropolar fluids represent fluids consisting of rigid, randomly oriented (or spherical) particles suspended in a viscous medium. These particles may be of nano-size, which indeed makes the micropolar fluids to behave as nanofluids. Physical examples of micropolar fluids can be seen in ferrofluids, blood flows, bubbly liquids, liquid crystals, and so on, all of them containing intrinsic polarities. It is important to note that some of these micropolar fluids do behave as nanofluid with heat transfer enhancement characteristics due to the presence of nanosize particles apart from their intrinsic polarities. The physical flow illustration of the problem is mathematically modeled in terms of partial differential equations. A suitable similarity transformation is used to attain ordinary differential equations. The converted differential equations (coupled system) are ultimately unraveled by using BVP solution method and shooting scheme along with fifth order R–K Fehlberg algorithm. A brief parametric analysis is executed to inspect the effect logs of involved physical parameters on dimensionless velocity and temperature by way of graphical attitudes. Further, the tabular structure is also design to analyze the variation of some physical quantities namely, velocity and temperature gradients adjacent to the flat surface. The obtained results are compared with existing published literature. An excellent match has been found which yields the validity of the current analysis. In the last it is mentioned here that the addition of nanoparticles in a micropolar fluid, make the mixture more complex as compare to conventional nanofluids and provide researchers with a new dimension to explore the fluid flow characteristics (Fig. 1).
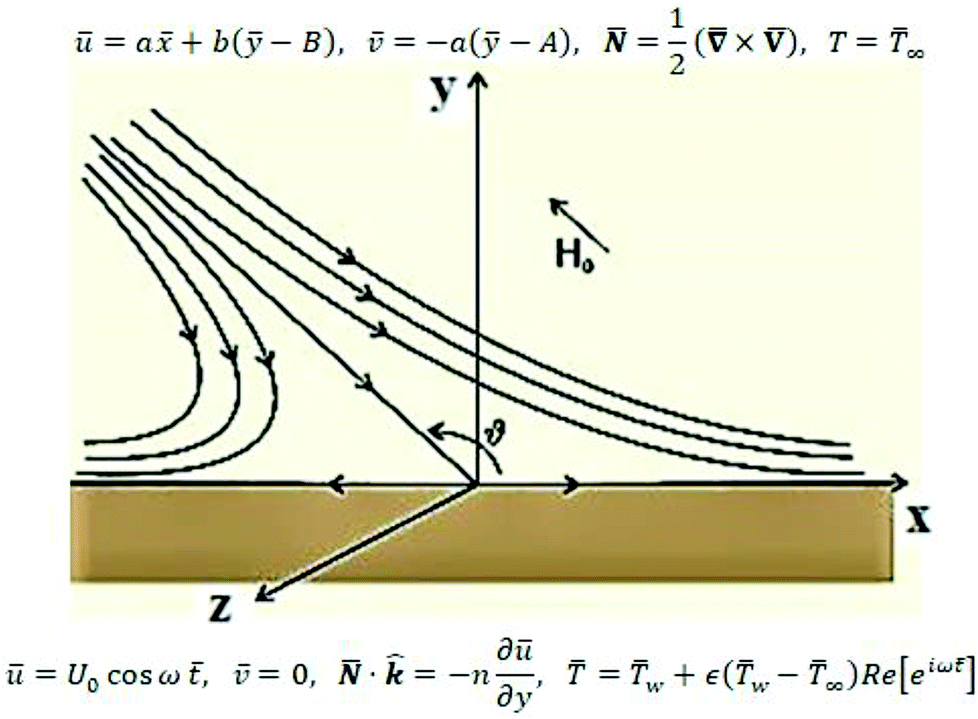 | ||
| Fig. 1 Flow description of the problem. | ||
2. Problem description and governing equations
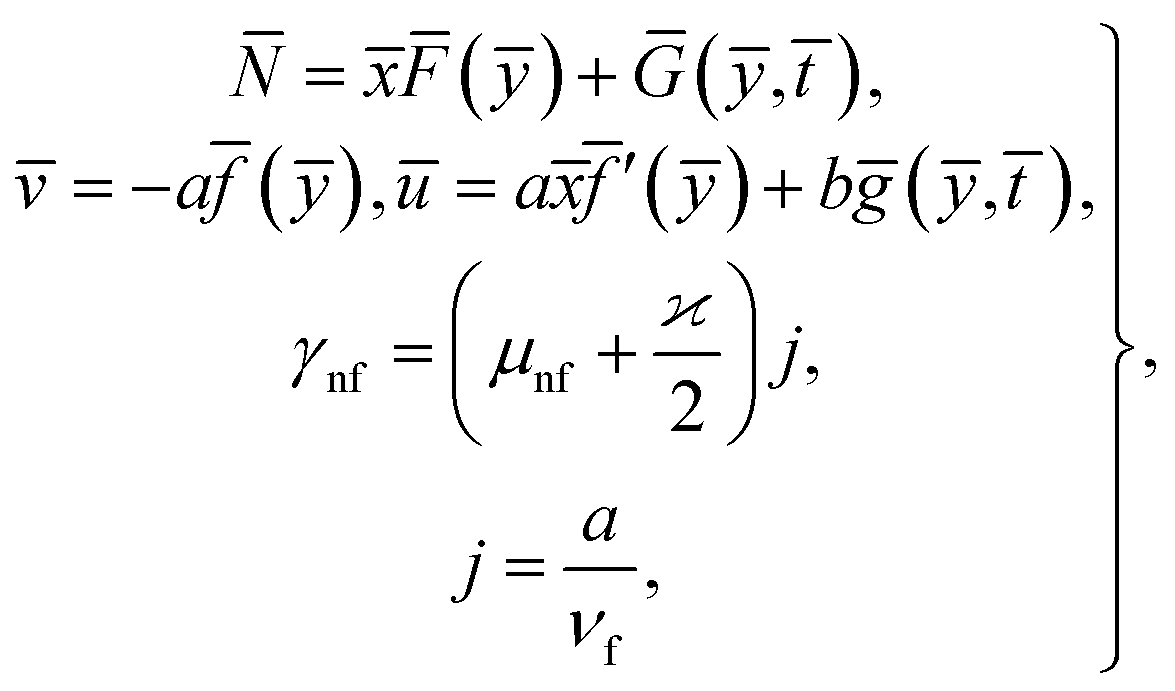
Consider the problem of stagnation point flow of an electrically conducting micropolar nanofluid over an oscillatory surface with velocity U0![[thin space (1/6-em)]](https://www.rsc.org/images/entities/char_2009.gif) cosω
cosω![[t with combining macron]](https://www.rsc.org/images/entities/i_char_0074_0304.gif) . The fluid impinges obliquely to the oscillatory surface ȳ = 0. By neglecting external mechanical body force and body couple the flow rheological equations becomes
. The fluid impinges obliquely to the oscillatory surface ȳ = 0. By neglecting external mechanical body force and body couple the flow rheological equations becomes
 | (1) |
![[H with combining macron]](https://www.rsc.org/images/entities/b_char_0048_0304.gif) , and Ē are the magnetic and electric fields, respectively, in which
, and Ē are the magnetic and electric fields, respectively, in which ![[H with combining macron]](https://www.rsc.org/images/entities/b_i_char_0048_0304.gif) = H(cosϑe1 + sinϑe2) and
= H(cosϑe1 + sinϑe2) and 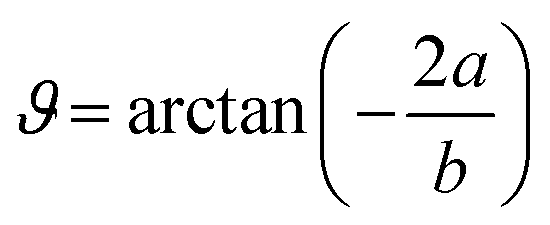 ,
, ![[N with combining macron]](https://www.rsc.org/images/entities/b_char_004e_0304.gif) is the microrotation or angular velocity, ρnf is the density of nanofluid, nanofluids dynamic viscosity is μnf, ϰ is the vortex viscosity, j is the microinertia coefficient, γnf is the spin-gradient viscosity, μe indicates the magnetic permeability, σe represent the electrical conductivity (μe, σe = constants > 0).
is the microrotation or angular velocity, ρnf is the density of nanofluid, nanofluids dynamic viscosity is μnf, ϰ is the vortex viscosity, j is the microinertia coefficient, γnf is the spin-gradient viscosity, μe indicates the magnetic permeability, σe represent the electrical conductivity (μe, σe = constants > 0).
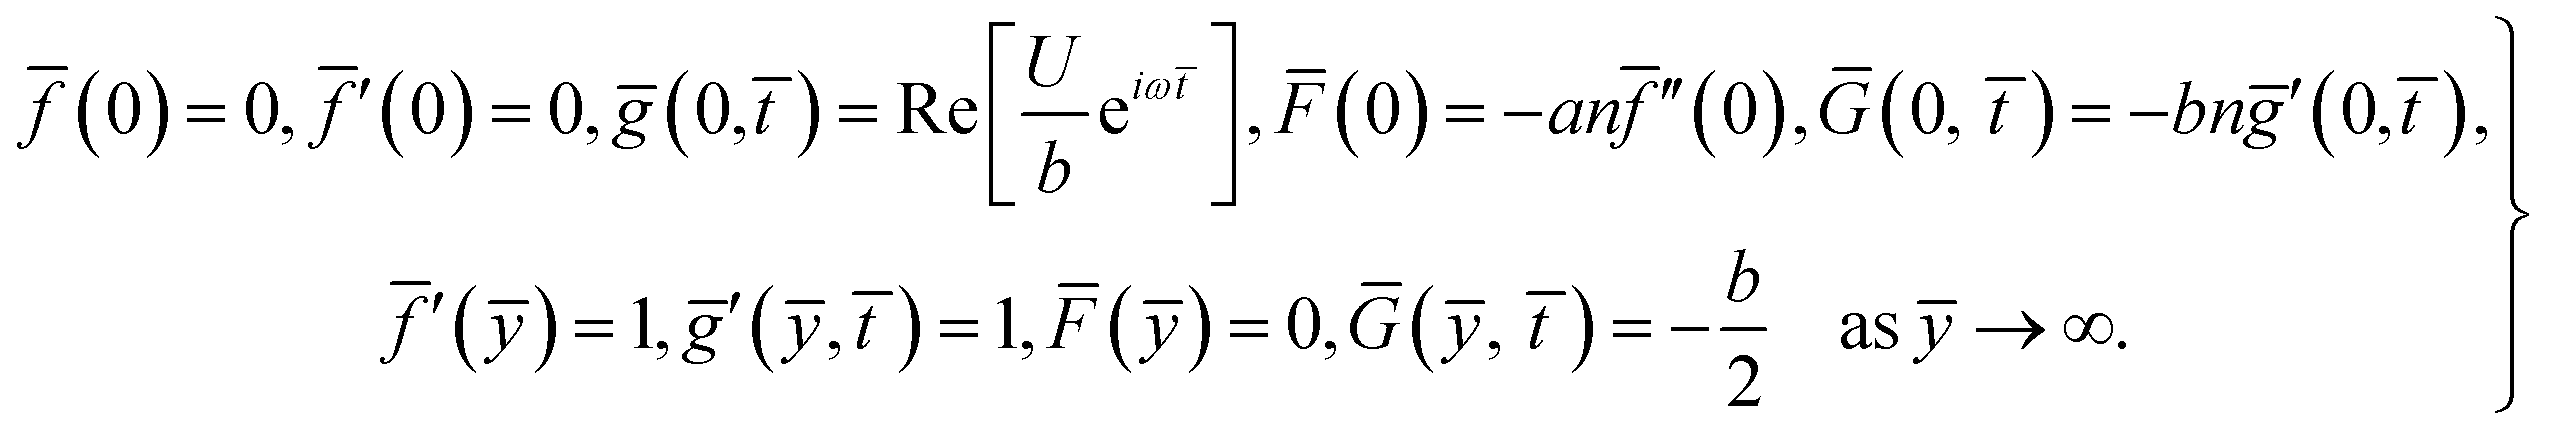
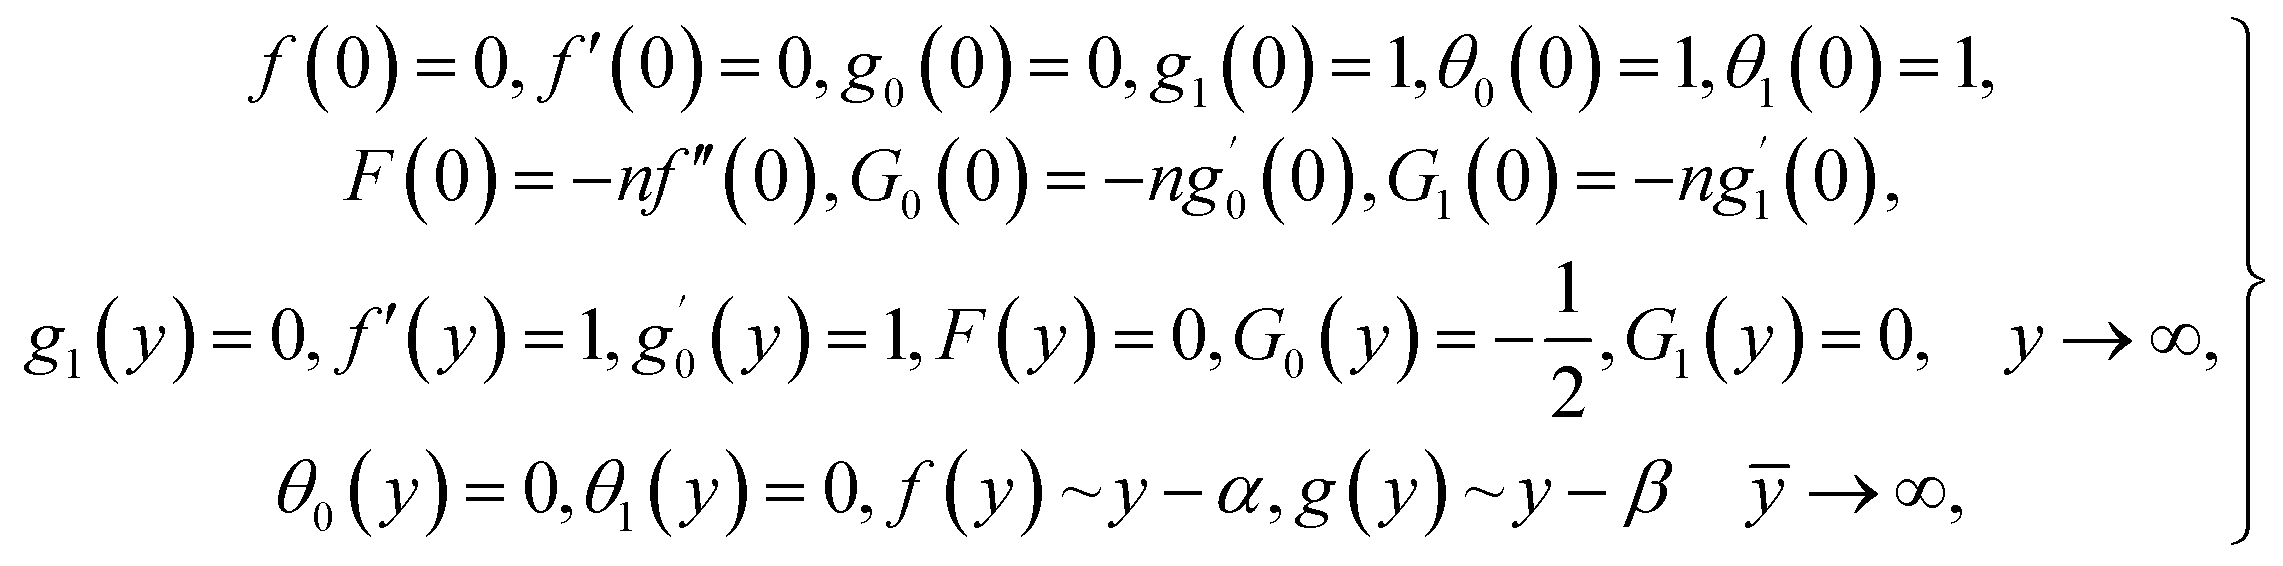
For structure (1) we affix the boundary condition:
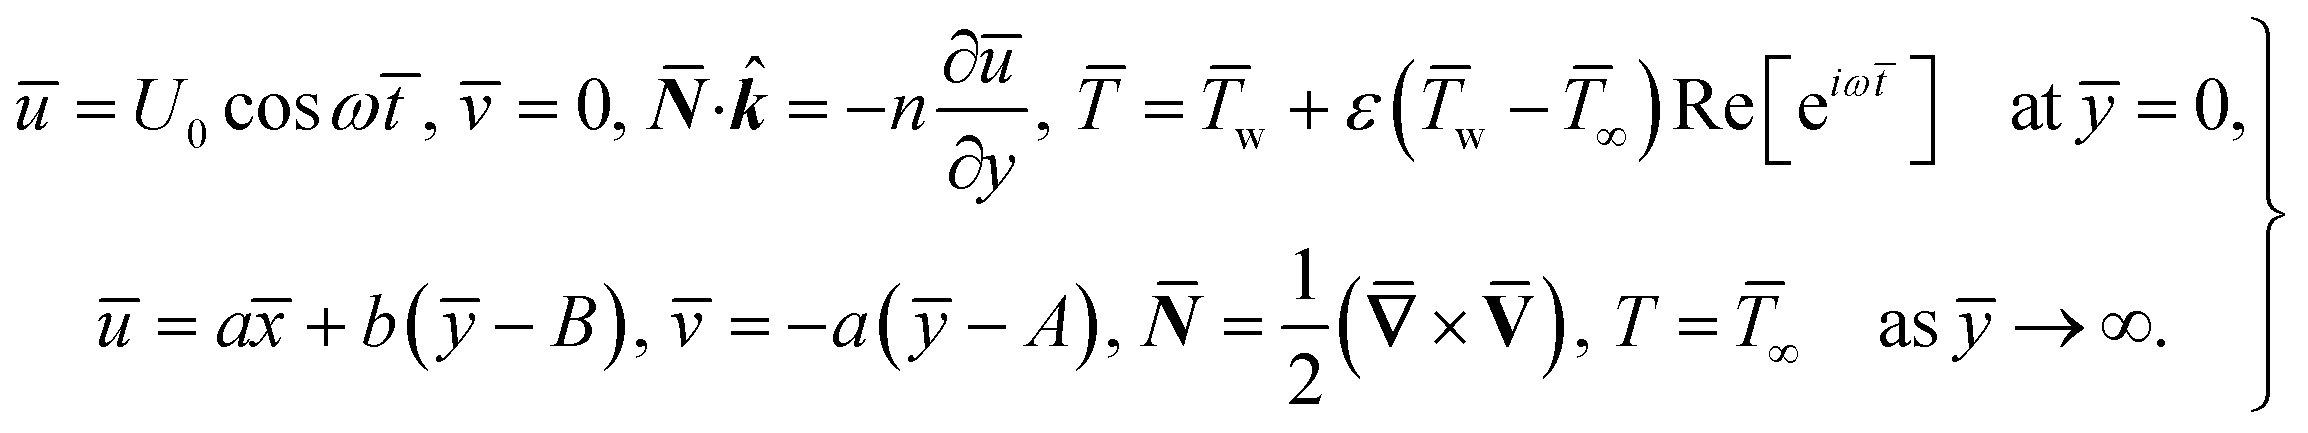 | (2) |
For the case of n = 0, we have ![[N with combining macron]](https://www.rsc.org/images/entities/b_i_char_004e_0304.gif) ·
·![[k with combining circumflex]](https://www.rsc.org/images/entities/b_i_char_006b_0302.gif) = 0 at the wall which shows strong concentration.35 Physically it means that microelements near the surface are unable to rotate.36 Further, for the case n = 1/2, narrates the disappearing of anti- symmetric portion of the stress tensor and indicates weak concentration37 of microelements. On the other side, at n = 1, flows indicate turbulent boundary layers.38
= 0 at the wall which shows strong concentration.35 Physically it means that microelements near the surface are unable to rotate.36 Further, for the case n = 1/2, narrates the disappearing of anti- symmetric portion of the stress tensor and indicates weak concentration37 of microelements. On the other side, at n = 1, flows indicate turbulent boundary layers.38
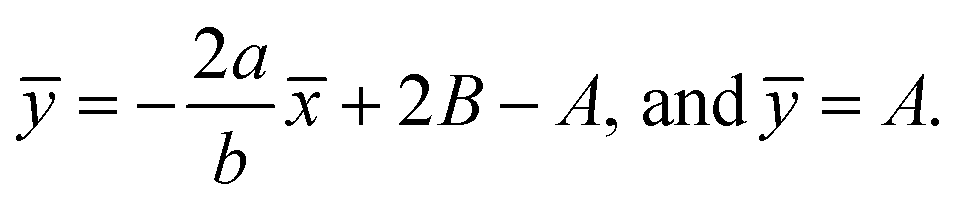
From conditions (2), mean that at infinity,  shows that the micropolar fluid behaves like a classical fluid far away from the surface. Also, from free stream velocity, we can find that the stagnation point is
 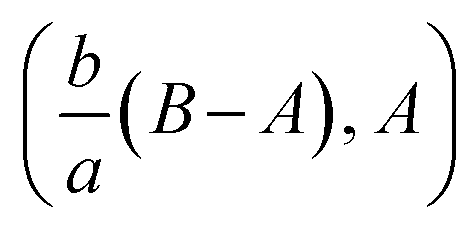 and stream lines are hyperbolas whose asymptotes are:
 | (3) |
Considered the magnetic field as defined in ref. 15 and assumed form of solutions as
 | (4) |
Eqn (1) and (2) takes the form
 | (5) |
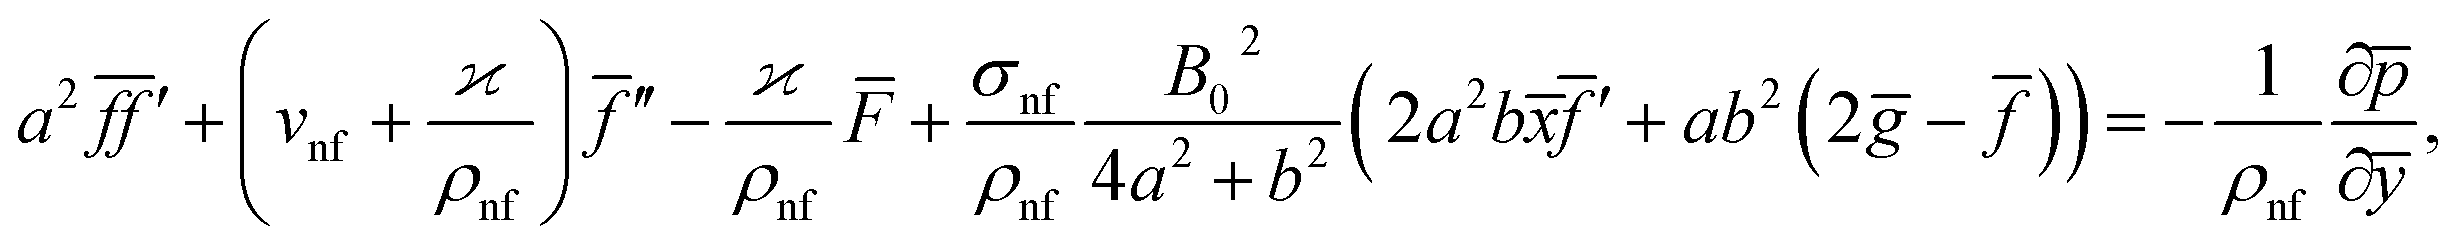 | (6) |
 | (7) |
 | (8) |
From (8), it is understood that the behavior of ![[f with combining macron]](https://www.rsc.org/images/entities/i_char_0066_0304.gif) (ȳ) and ḡ(ȳ, ) at infinity is
(ȳ) and ḡ(ȳ, ) at infinity is
|
(ȳ) ∼ ȳ − A, ḡ(ȳ, ) ∼ ȳ − B.
| (9) |
From eqn (7) and (8), we find the pressure field as15
 | (10) |
![[p with combining macron]](https://www.rsc.org/images/entities/i_char_0070_0304.gif) 0 is the stagnation pressure. From eqn (10), it is clearly seen that maximum pressure occurs at the stagnation point in through-out the flow domain.
0 is the stagnation pressure. From eqn (10), it is clearly seen that maximum pressure occurs at the stagnation point in through-out the flow domain.
Making use of eqn (10) and the following similarity solutions15
 | (11) |
 | (12) |
 | (13) |
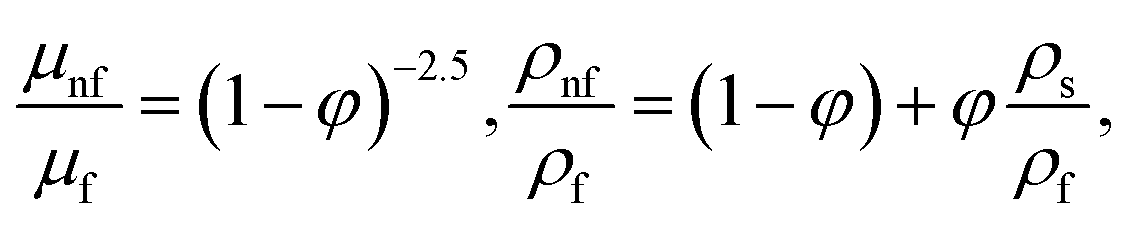
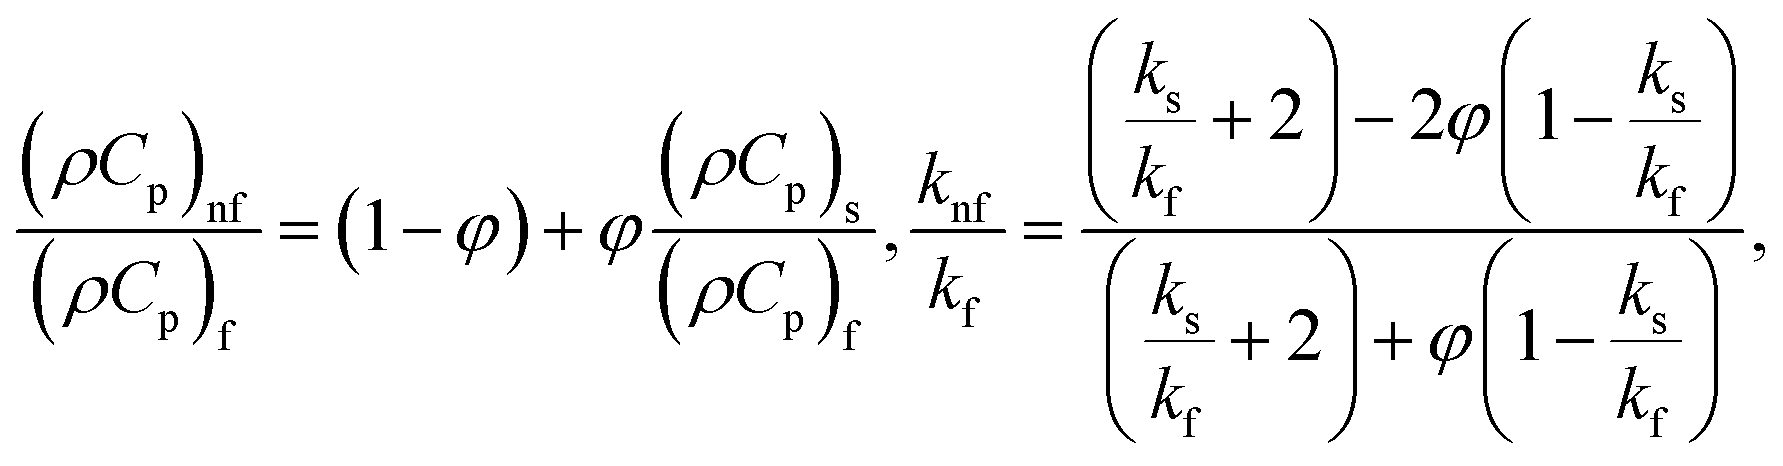
in which φ displays the volume fraction of nanoparticles, ρs and ρf are the density of solid fractions and base fluid, knf is the thermal conductivity of nanofluid, kf and ks are the thermal conductivity of base fluid the and solid fractions, respectively, (ρCp)nf is the heat capacity of nanofluid, K is a material parameter, Pr is the Prandtl number, M is the Hartmann number, ε and Ω are the dimensionless amplitude and frequency of the wave.
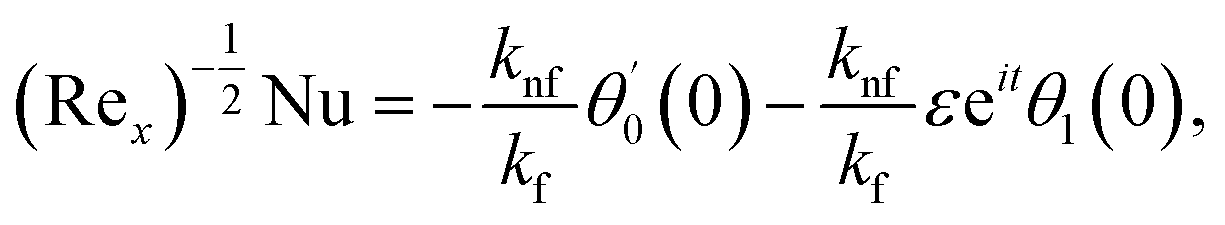
The surface shear stress (Cf) and heat transfer rate (Nu) in dimensionless form can be expressed as
 | (14) |
 | (15) |
By using of (14), (17) and (18), we may write it as
where Rex = ax2/vf is the local Reynolds number.
The equation of dividing streamline is
 | (16) |
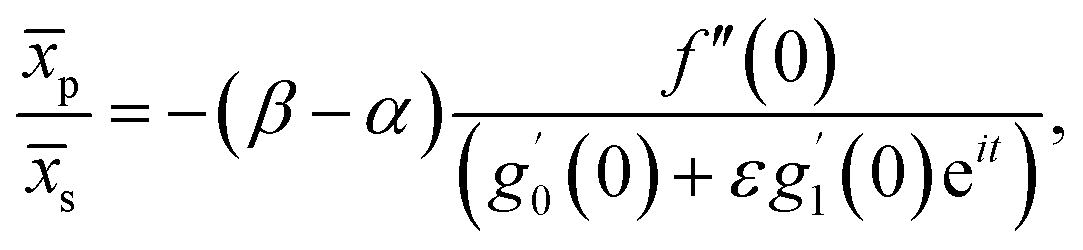
Further, from eqn (12) and (18) we find the point of maximum pressure and point of zero skin friction as
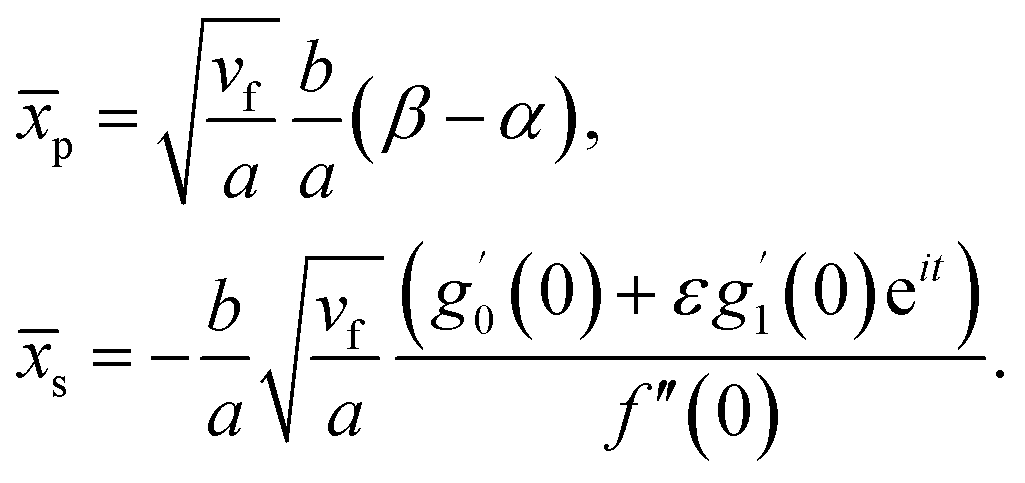 | (17) |
We note that ![[x with combining macron]](https://www.rsc.org/images/entities/i_char_0078_0304.gif) p is independent of M whereas s depends on M. The ratio
p is independent of M whereas s depends on M. The ratio
3. Solution procedure
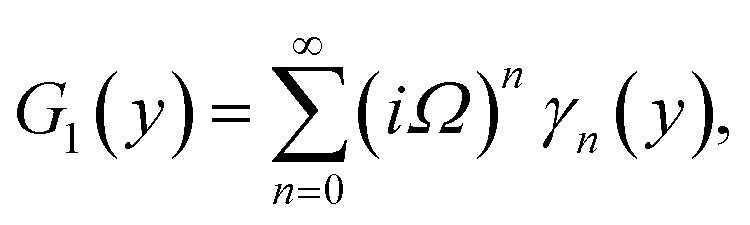
Numerical solution of f, g0, F, and G0-flow have been obtained numerically by means of midpoint method with Richardson extrapolation enhancement.Furthermore, the series solutions of eqn (12)3,6 (g1(y) and G1(y) – flow) for small value of frequency Ω have been obtained as
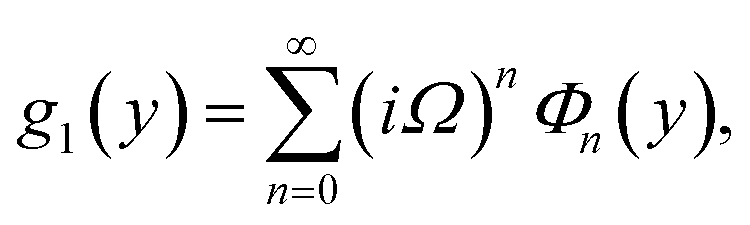
We are concerned only in real part of the solution. Thus
| g1(y) = Φ0(y) − Ω2Φ2(y) + Ω4Φ4(y)… |
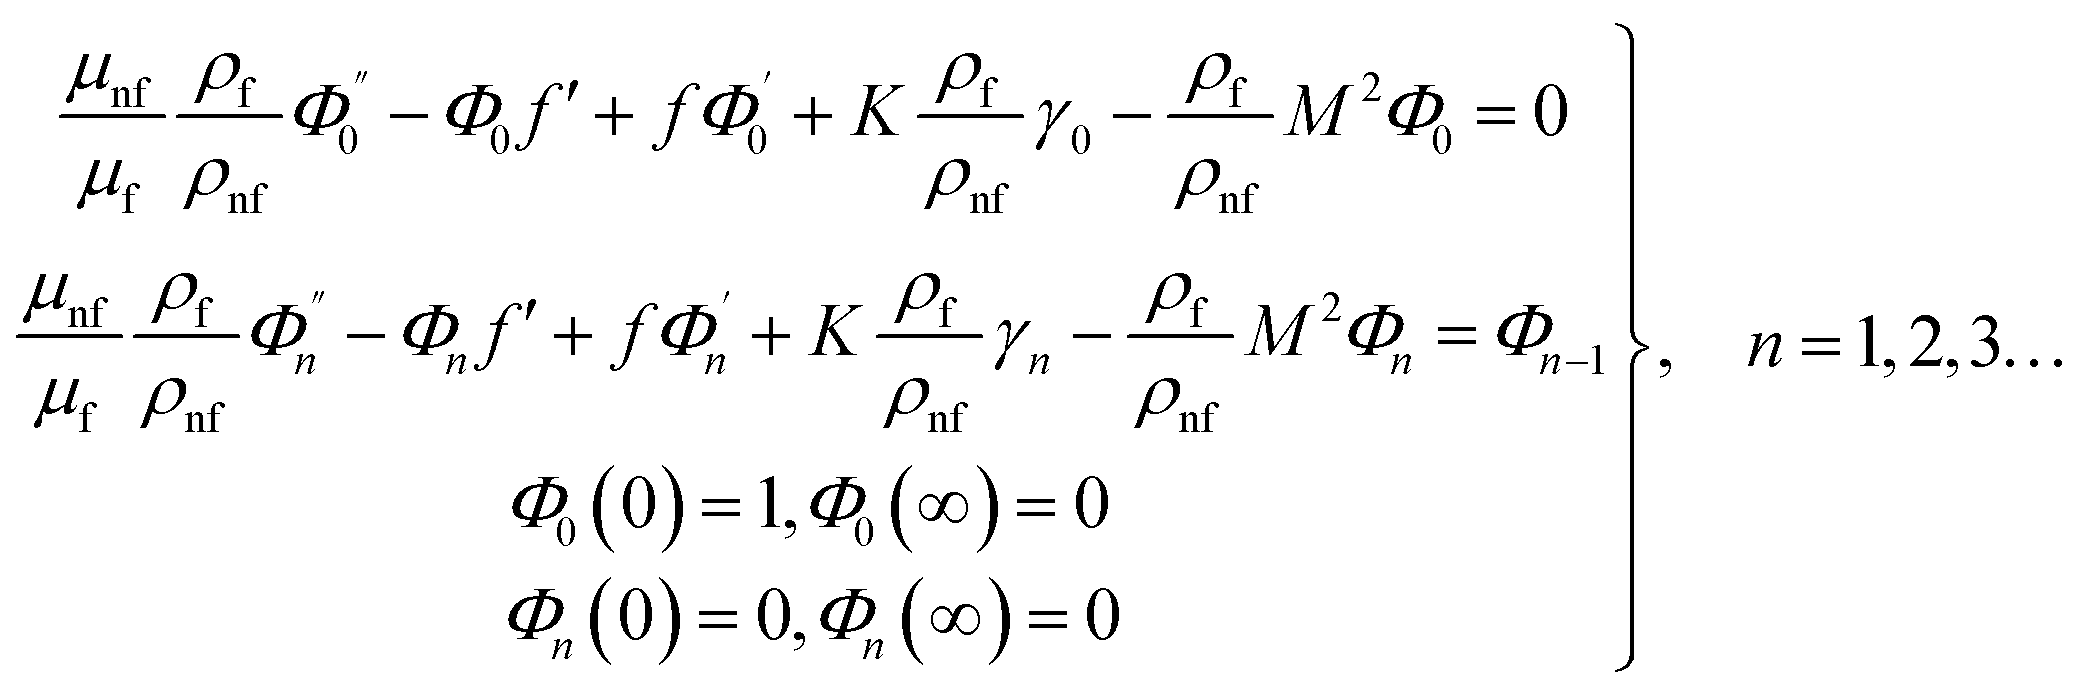
The above system has been tackled numerically using midpoint method with the Richardson extrapolation enhancement.
Similarly, for a small value of Ω, eqn (12)8 becomes
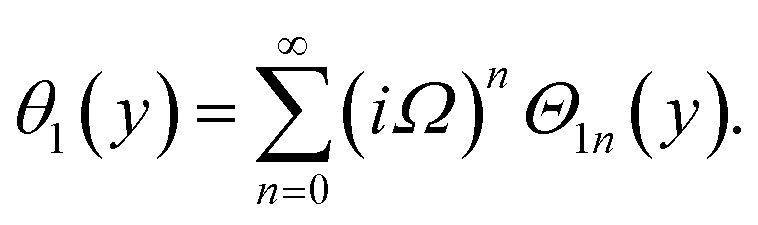
| θ1(y) = Θ10(y) − Ω2Θ12(y) + Ω4Θ14(y)… |
From (12)7 we have
 | (18) |
and

Making use of (12)8 we may write
The numerical integration for the above system can be executed easily with aid of any mathematical software.
4. Results and discussion
Numerical assessment is carried out towards model equations of water-based micropolar nanofluid containing metals and oxide ceramics nanoparticles named as alumina (Al2O3) and copper (Cu). The range of solid volume fraction φ for the nanoparticles is maintained as 0 ≤ φ ≤ 0.2 along with the upper limit of Prandtl number 6.2 for base fluid i.e. water. Table 1 is used to present the thermos-physical properties of copper, alumina, and water. The numerical scheme is validated by constructing a discrete case of Hartmann number by ignoring the effects of nanoparticles shown in Table 2, we have found that our obtained results are agreed perfectly with.40| Thermophysical characteristics | Cp (J kg−1 K−1) | ρ (kg m−3) | k (W mK−1) | σ (S m−1) |
|---|---|---|---|---|
| Fluid phase (water) | 4179 | 997.1 | 0.613 | 5.5 × 10⁻⁶ |
| Copper (Cu) | 385 | 8933 | 400 | 59.6 × 10⁶ |
| Alumina (Al2O3) | 765 | 3970 | 40 | 35 × 106 |
The impact of relevant physical parameters on nanofluid velocity distributions is identified by Fig. 2–6. Fig. 2 shows the behavior of f(y), f′(y), f′′(y) for M = 10−7, φ = 0.0, K = 0.0. Fig. 3 is used to study the behavior of f′(y) towards unlike values of K, φ, n and different nanoparticles when base fluid is water. In Fig. 3(a), it is detected that momentum boundary layer thickness increases by growing the material parameter K. There is an important fact that Al2O3–water nanofluid produces a thicker velocity boundary layer than Cu–water as illustrated in Fig. 3(b). The strength of Fig. 3(c) is to draw out the impact of an imperative parameter n, the micro gyration parameter, which indicates the concentration of the micropolar fluid. From this figure, we tend to recognize that the velocity boundary layer thickness is thin just in case of week concentration as compared to strong concentration. Fig. 4 is designed in order to see the impact of time t on u. It is seen that u shows an oscillation performance with maximum amplitude at the surface and gradually declines away from the surface. Fig. 5 depicts the attitude of the temperature distribution θ(y, t) towards φ and M when Pr = 6.2. The influence of increasing Hartmann number on temperature profile, the decreasing nature of temperature field can be observed near the surface, while it shows a rise in behavior with the enhancement in nanoparticle volume fraction. The impact of time t on θ(x, y, t) is shown with the aid of Fig. 6. It is noticed that θ(x, y, t) exhibit waving nature and the amplitude of wave is found maximum near the surface and reduces far from the surface. Further, it is examined that the temperature is maximum at the surface, that is y = 0, and decrease away from it. The oblique flows are presented by way of streamline patterns in Fig. 7 and 8. The streamline come across the wall y = 0, at s. It is concluded from these figures that their location is governed by β − α and time t. Fig. 9. shows the bar graph comparison of both copper and aluminium oxide nanoparticles. It demonstrates that copper has a higher surface temperature gradient when contrasted with the aluminium oxide nanoparticles. As Cu has the highest value of thermal conductivity as compared to TiO2 and Al2O3. The reduced value of thermal diffusivity leads to higher temperature gradients and, hence, higher improvements in heat transfer. More real applications of nanofluids include different types of microchannels, heat exchangers, thermosyphons, heat pipes, chillers, car radiators, cooling and heating in buildings, solar collectors, air conditioning and refrigeration, cooling of electronics, in diesel electric generator as jacket water coolant, nanofluids in transformer cooling oil, in drag reductions and many others.
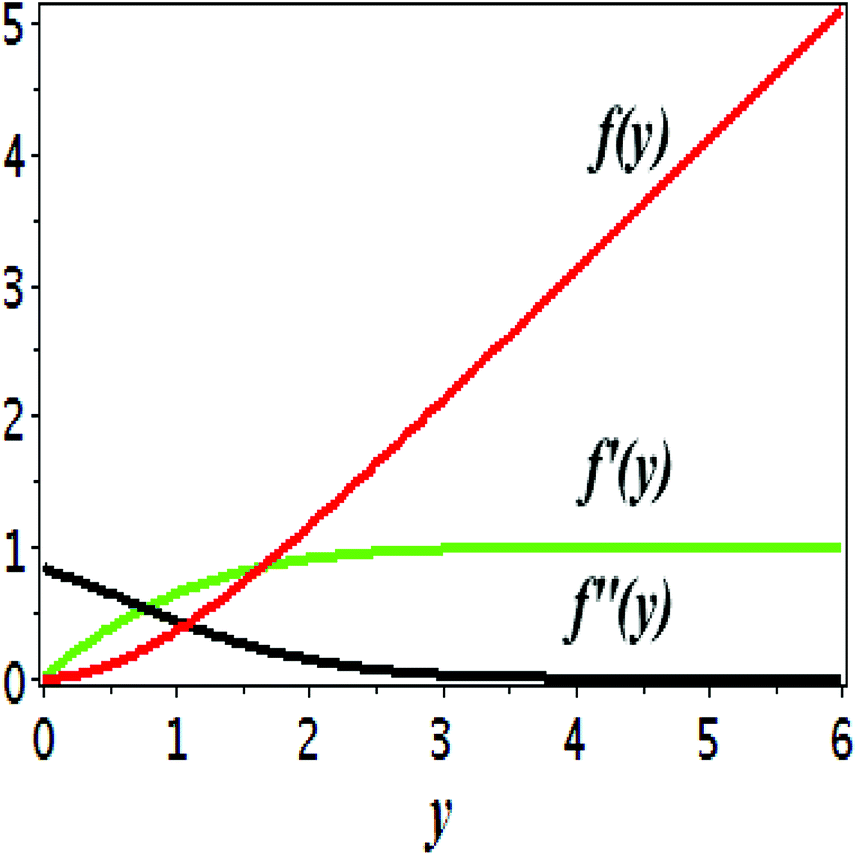 | ||
| Fig. 2 Plots showing f(y), f′(y), f′′(y) for M = 10−7, φ = 0.0, K = 0.0. | ||
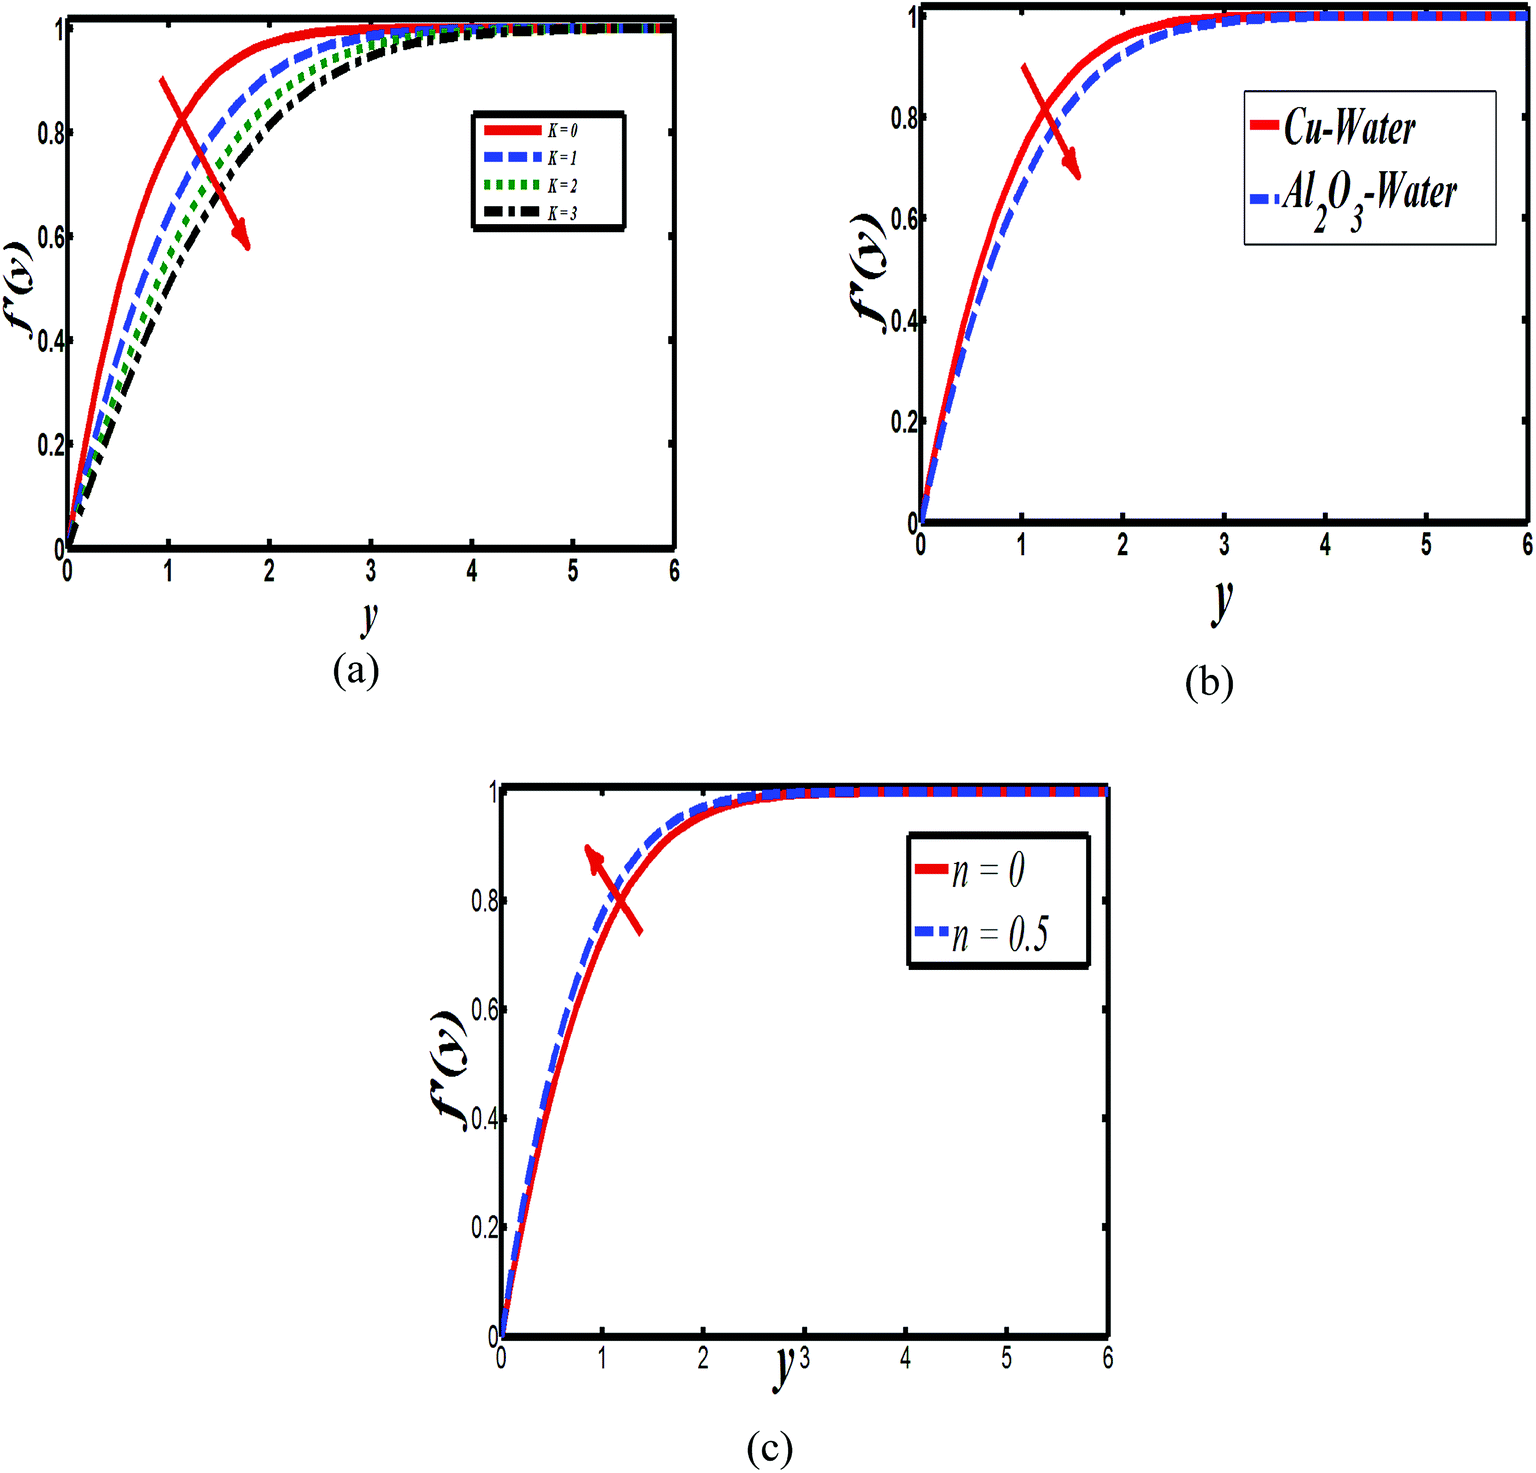 | ||
| Fig. 3 Plots showing f′(y) when M = 10−7 (a) Cu–water, φ = 0.0, M = 10−7, n = 0 (b) Cu–water, n = 0.1, K = 0.0 and (c) Cu–water, K = 0, φ = 0.0, n = 0, K = 0, φ = 0.1. | ||
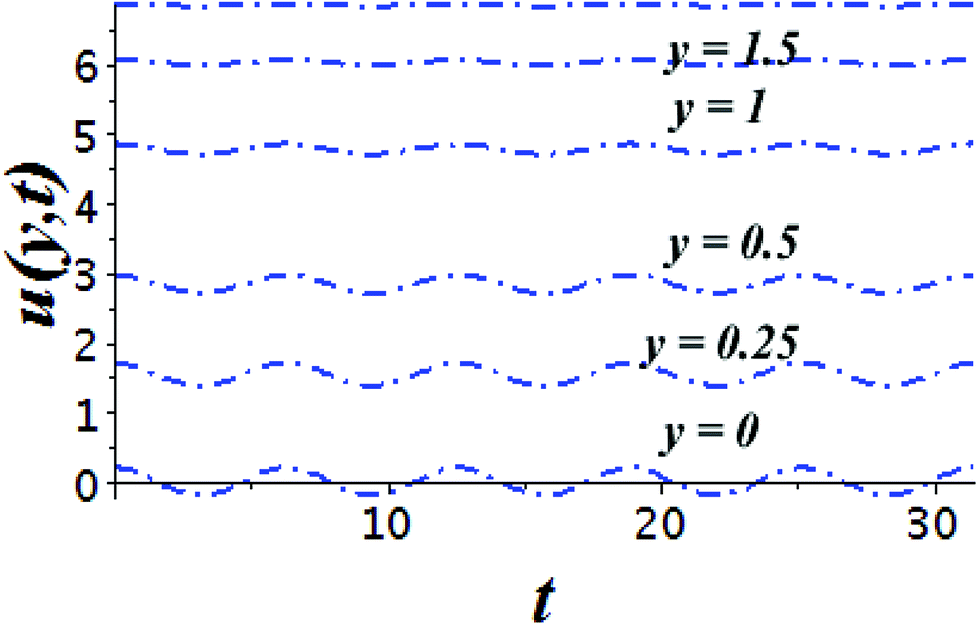 | ||
| Fig. 4 Time series of the flow of the velocity field u(y, t) at six different spaces from the surface for the time period t ∈ [0, 10π] for Cu–water, φ = 0.1, K = 0.0, M = 10−7, ε = 0.2, Ω = 0.2, β − α = −α, x = 1. | ||
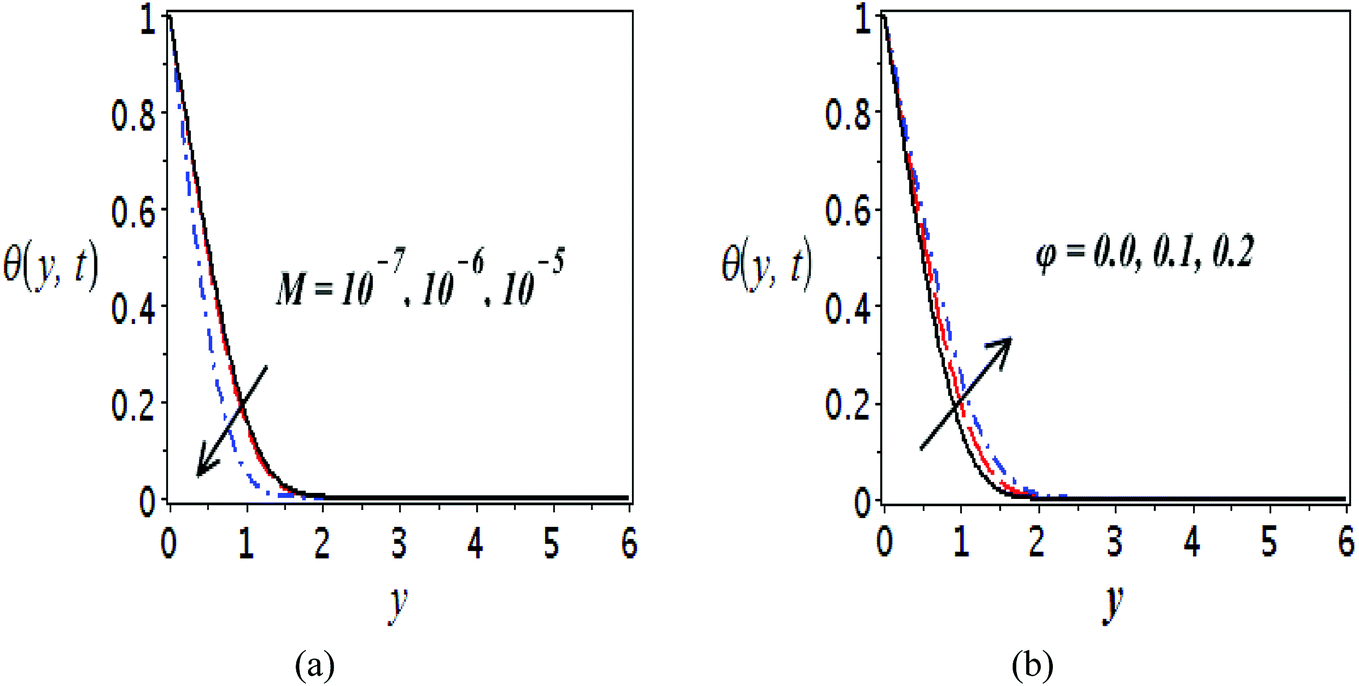 | ||
| Fig. 5 Plots presenting the variation of θ(y, t) for different parameters when Pr = 6.2, (a) Cu–water, φ = 0.0, K = 0.0 and (b) Cu–water, M = 10−7, K = 0.0. | ||
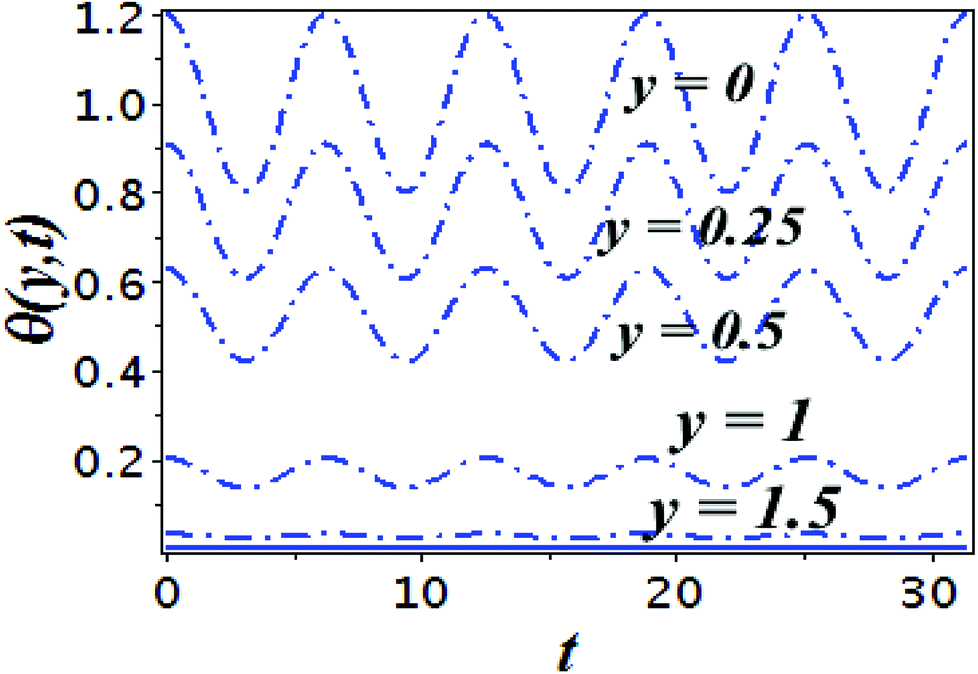 | ||
| Fig. 6 Time series of the flow of the temperature field θ(y, t)at five distinct spaces from the sheet for the time period t ∈ [0, 10π] for Cu–water, φ = 0.1, K = 0.0, M = 10−7, ε = 0.2, Ω = 0.2, x = 1. | ||
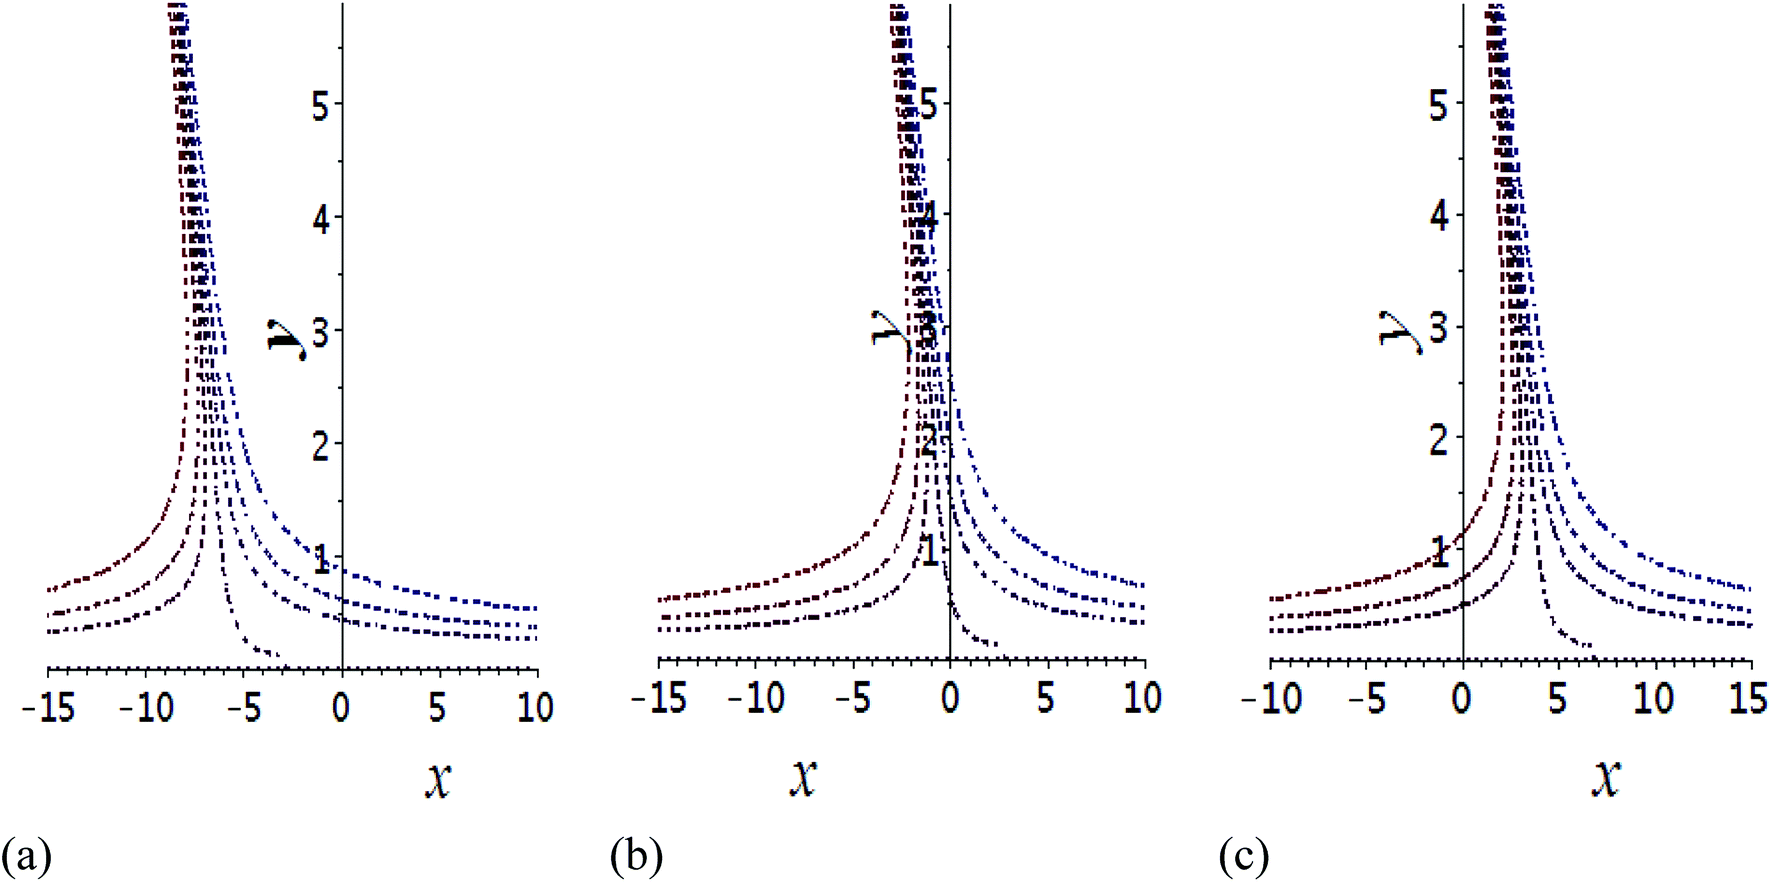 | ||
Fig. 7 Shows the streamlines of Cu–water nanofluid when  . (a) β − α = −5 − α, (b) β − α = 0, (c) β − α = 5 − α. . (a) β − α = −5 − α, (b) β − α = 0, (c) β − α = 5 − α. | ||
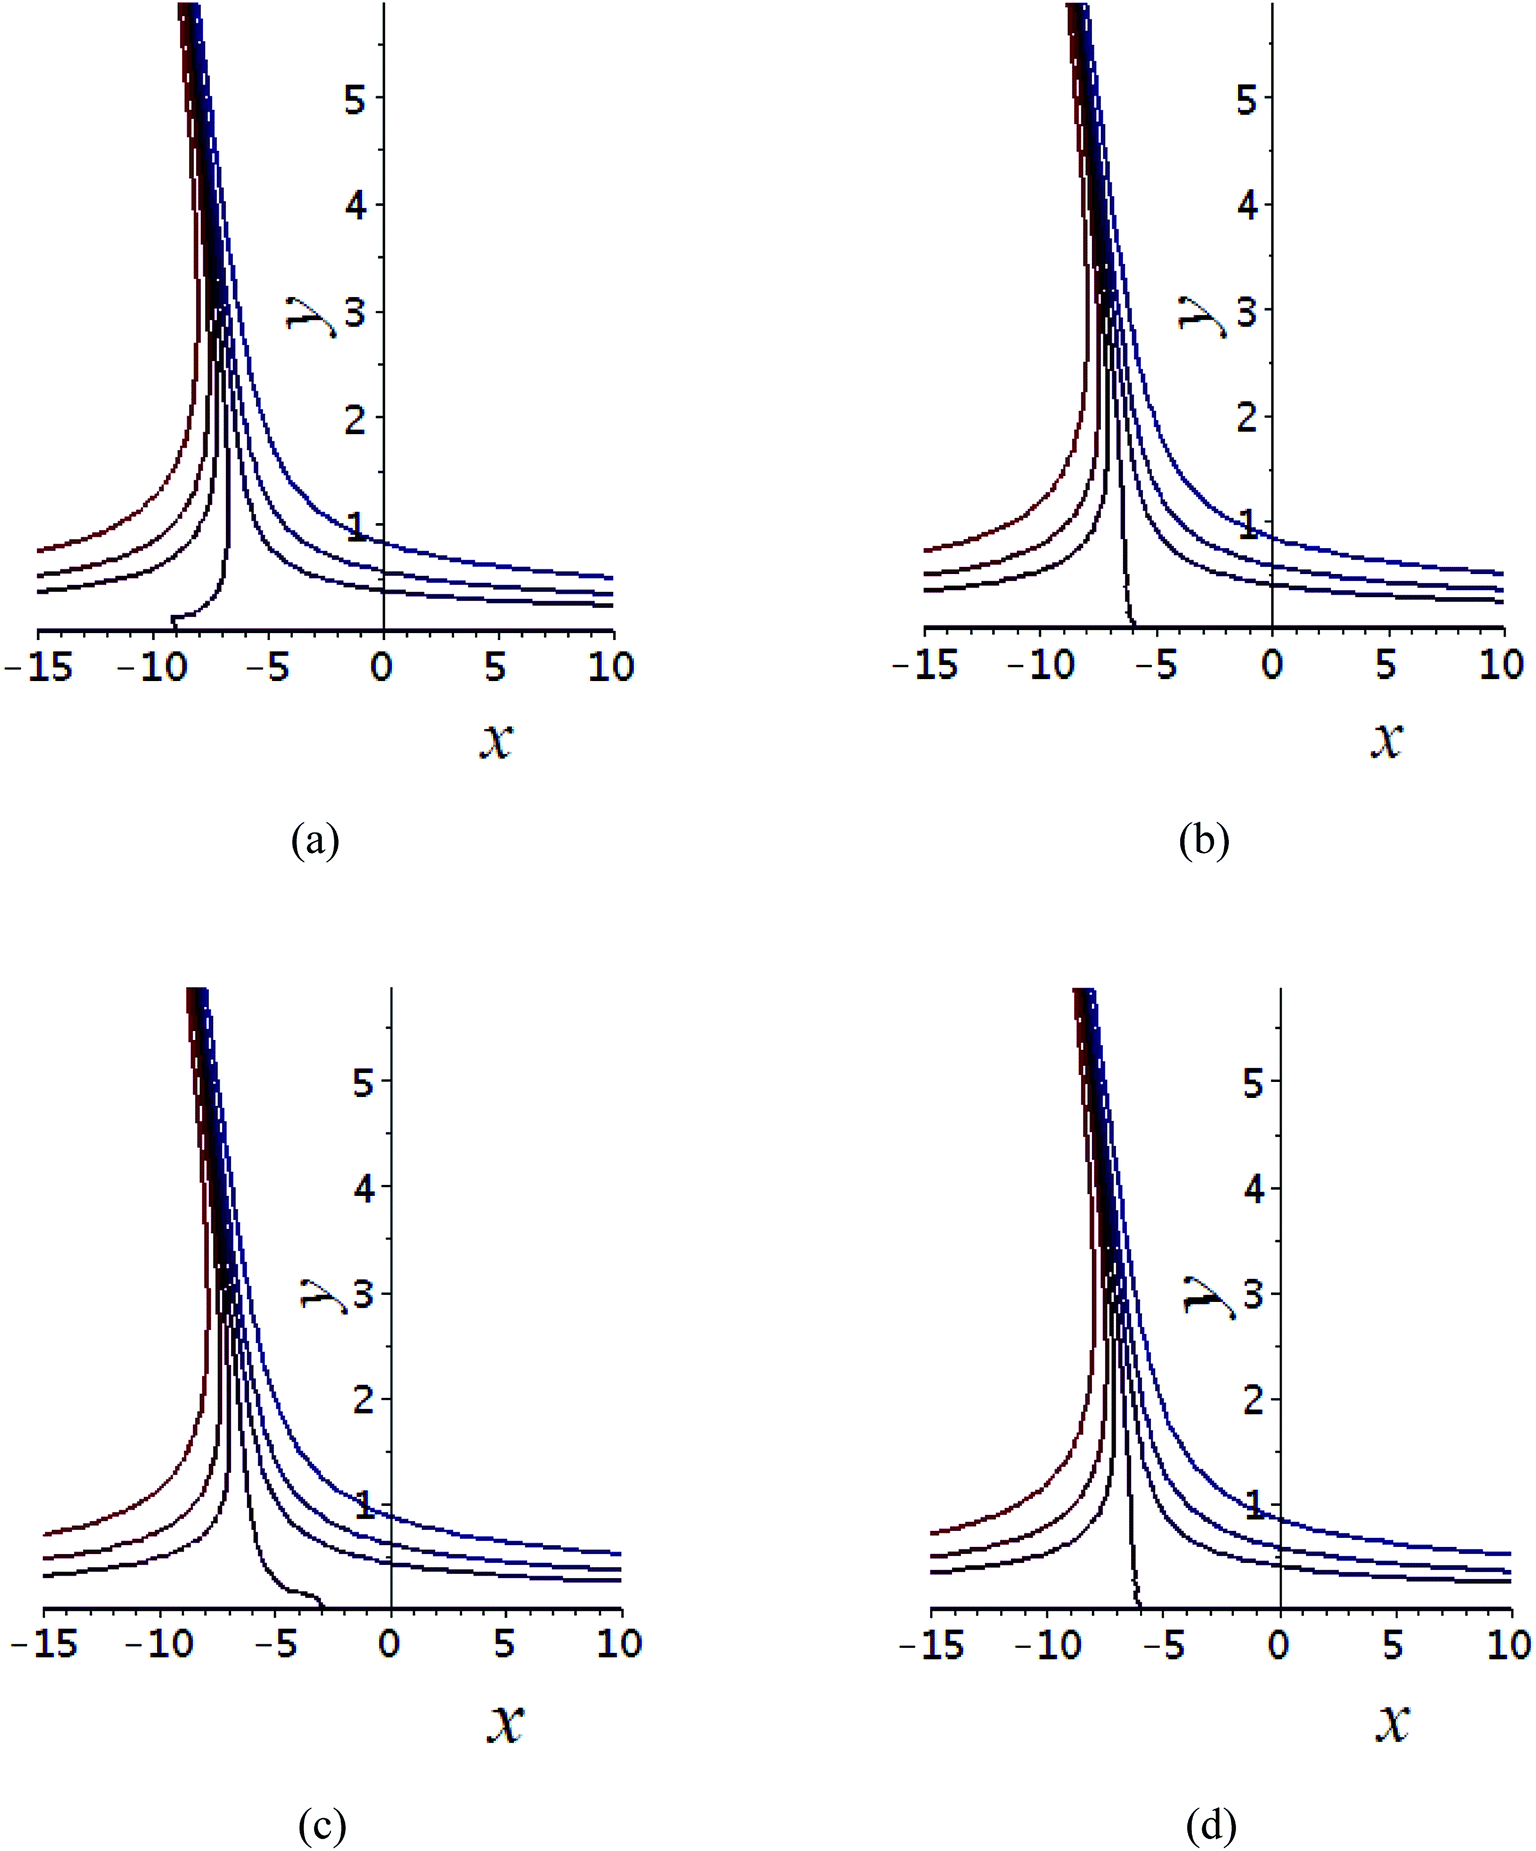 | ||
Fig. 8 Shows the streamlines of Cu–water nanofluid when  (a) t = 0, (b) (a) t = 0, (b)  , (c) t = π, (d) , (c) t = π, (d)  . . | ||
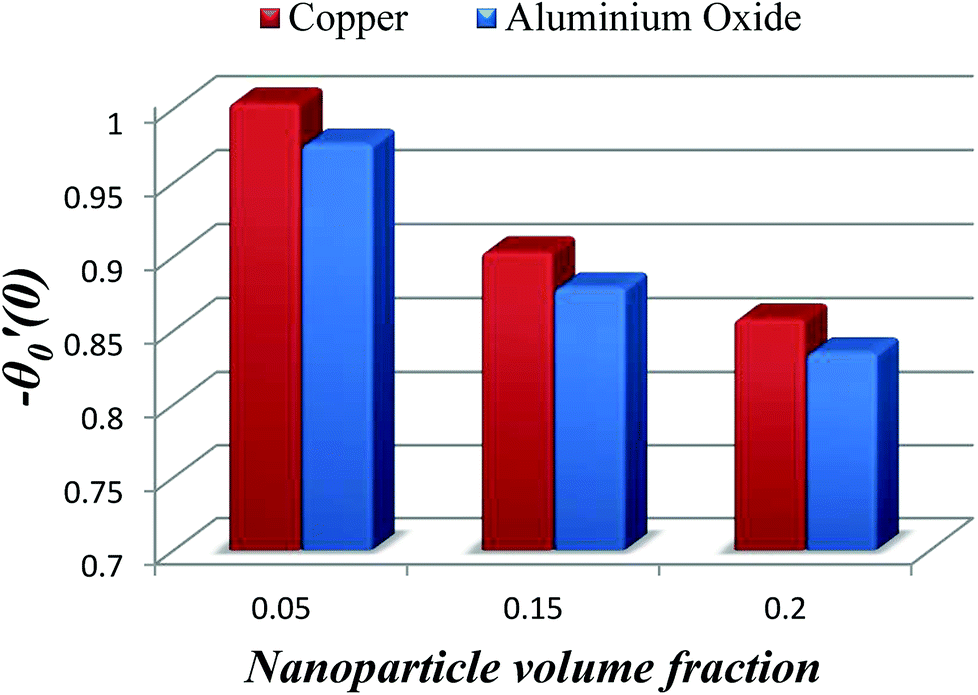 | ||
| Fig. 9 Bar graph evaluation of two nanoparticles concentrations 5%, 15% and 20% respectively. | ||
Tables 3–10 delineate the impacts of the involved parameter on the physical quantities near the wall for both copper and aluminium oxide nanoparticles when water is preserved as a base fluid. We comment that the estimations of α and f′′(0) rely on upon M, φ and, K, as should be obvious from Tables 3 and 4. More precisely, f′′(0) increases and α decreases as φ and M are increases. Moreover, increases in material parameter K cause an increase in α and decrease in f′′(0). Tables 5 and 6 shows the numerical values of velocity gradient at the surface against M, φ, K and β − α = −α, 0, α and it is noticed that the magnitude of g0(y) does not depend on φ. As far as the variation of g0(y) against M and K are concerned, is found its magnitude shows increments when M rises while shows decline nature for all β − α when K increases. The rapid increase is found for Cu–water nanofluid as compared to Al2O3–water. The numerical variation of  against M, φ, and K are revealed in Tables 7 and 8. Generally, magnetohydrodynamic (MHD) flow plays the main role in the manufactured products and several businesses like pumps and oil purification, etc. In Tables 9 and 10, it is found that the gradient of temperature is decreasing function of both material parameter K and nanoparticle volume fraction φ. Thus, the rate of heat transfer increase near the surface. It is important to note that Cu–water remarks higher heat transfer rate as compared to Al2O3–water nanofluid. As Cu has the highest value of thermal conductivity as compared to Al2O3. The reduced value of thermal diffusivity leads to higher temperature gradients and, hence, higher improvements in heat transfer. Furthermore, it is also noticed that the temperature gradient shows inciting attitude when we increase Hartmann number M which brings enhancement in heat transfer rate near the surface. In general, micropolar fluids deal excessive resistance to the fluid motion rather than the Newtonian fluid. This occurrence also demonstrates that the greater micropolar parameter improves the total viscosity in the fluid flow. Thus, the micropolar fluid is a very effective fluid medium in the boundary layer for observing the laminar flow.
| Cu–water | ||||||
|---|---|---|---|---|---|---|
| M | K | φ | n = 0.0 | n = 0.5 | ||
| α | f′′(0) | α | f′′(0) | |||
| 10−7 | 1 | 0.1 | 0.722568 | 1.069269 | 0.647978 | 1.233009 |
| 10−6 | 0.644688 | 1.264293 | 0.573809 | 1.440364 | ||
| 10−5 | 0.142575 | 6.935249 | 0.116581 | 7.227920 | ||
| 10−7 | 2 | 0.848297 | 0.868343 | 0.732395 | 1.09084 | |
| 3 | 0.950844 | 0.742678 | 0.808043 | 0.988713 | ||
| 4 | 1.039219 | 0.655790 | 0.877179 | 0.910772 | ||
| 1 | 0.05 | 0.782726 | 0.972330 | 0.696955 | 1.140483 | |
| 0.15 | 0.680741 | 1.139190 | 0.615133 | 1.293535 | ||
| 0.2 | 0.657732 | 1.185850 | 0.599389 | 1.327287 | ||
| Al2O3–water | ||||||
|---|---|---|---|---|---|---|
| M | K | φ | n = 0.0 | n = 0.5 | ||
| α | f′′(0) | α | f′′(0) | |||
| 10−7 | 1 | 0.1 | 0.846878 | 0.903951 | 0.762347 | 1.047950 |
| 10−6 | 0.770550 | 1.040532 | 0.689359 | 1.194029 | ||
| 10−5 | 0.185034 | 5.324346 | 0.152298 | 5.584560 | ||
| 10−7 | 2 | 0.990380 | 0.730675 | 0.861656 | 0.927134 | |
| 3 | 1.107115 | 0.623266 | 0.950585 | 0.840333 | ||
| 4 | 1.207568 | 0.549524 | 1.031693 | 0.774098 | ||
| 1 | 0.05 | 0.861087 | 0.877879 | 0.769082 | 1.033635 | |
| 0.15 | 0.835022 | 0.919714 | 0.756813 | 1.050349 | ||
| 0.2 | 0.833913 | 0.925333 | 0.753188 | 1.061526 | ||
 for K, M, φ and different n
| Cu–water | ||||||
|---|---|---|---|---|---|---|
| M | K | φ | n = 0.0 | n = 0.5 | ||
| β − α |
|
β − α |
|
|||
| 10−7 | 1 | 0.1 | −0.722568 | 1.271410 | −0.647978 | 1.406550 |
| 0 | 0.498790 | 0 | 0.607587 | |||
| 0.722568 | −0.273830 | 0.647978 | −0.191375 | |||
| 10−6 | −0.644688 | 1.294936 | −0.573809 | 1.408199 | ||
| 0 | 0.479861 | 0 | 0.581705 | |||
| 0.644688 | −0.335214 | 0.573809 | −0.244789 | |||
| 10−5 | −0.142575 | 1.459372 | −0.116581 | 1.366378 | ||
| 0 | 0.470574 | 0 | 0.523735 | |||
| 0.142575 | 0.518223 | 0.116581 | −0.318907 | |||
| 10−7 | 2 | −0.848297 | 1.185937 | −0.732395 | 1.406516 | |
| 0 | 0.449325 | 0 | 0.607585 | |||
| 0.848297 | −0.287287 | 0.732395 | −0.191346 | |||
| 3 | −0.950844 | 1.126700 | −0.808043 | 1.406519 | ||
| 0 | 0.420537 | 0 | 0.607598 | |||
| 0.950844 | −0.285624 | 0.808043 | −0.191322 | |||
| 4 | −1.039219 | 1.083121 | −0.877179 | 1.406571 | ||
| 0 | 0.401646 | 0 | 0.607674 | |||
| 1.039219 | −0.279829 | 0.877179 | −0.191222 | |||
| 1 | 0.05 | −0.782726 | 1.253428 | −0.696955 | 1.406544 | |
| 0 | 0.489102 | 0 | 0.607715 | |||
| 0.782726 | −0.275223 | 0.696955 | −0.191113 | |||
| 0.15 | −0.680741 | 1.253428 | −0.615133 | 1.406544 | ||
| 0 | 0.489102 | 0 | 0.607715 | |||
| 0.680741 | −0.275223 | 0.615133 | −0.191113 | |||
| 0.2 | −0.657732 | 1.253428 | −0.599389 | 1.406544 | ||
| 0 | 0.489102 | 0 | 0.607715 | |||
| 0.657732 | −0.275223 | 0.599389 | −0.191113 | |||

 for K, M, φ and different n
| Al2O3–water | ||||||
|---|---|---|---|---|---|---|
| M | K | φ | n = 0.0 | n = 0.5 | ||
| β − α |
|
β − α |
|
|||
| 10−7 | 1 | 0.1 | −0.838110 | 1.263658 | −0.754251 | 1.406554 |
| 0 | 0.497639 | 0 | 0.607660 | |||
| 0.838110 | −0.268379 | 0.754251 | −0.191234 | |||
| 10−6 | −0.763937 | 1.282825 | −0.683338 | 1.407946 | ||
| 0 | 0.481221 | 0 | 0.585292 | |||
| 0.763937 | −0.320383 | 0.683338 | −0.237360 | |||
| 10−5 | −0.184939 | 1.450722 | −0.152254 | 1.371608 | ||
| 0 | 0.465719 | 0 | 0.520896 | |||
| 0.184939 | −0.519283 | 0.152254 | −0.329814 | |||
| 10−7 | 2 | −0.980384 | 1.171577 | −0.852508 | 1.406571 | |
| 0 | 0.447083 | 0 | 0.607713 | |||
| 0.980384 | −0.277409 | 0.852508 | −0.191145 | |||
| 3 | −1.096144 | 1.109010 | −0.940504 | 1.406727 | ||
| 0 | 0.418007 | 0 | 0.607960 | |||
| 1.096144 | −0.272996 | 0.940504 | −0.190805 | |||
| 4 | −1.195780 | 1.063927 | −1.020783 | 1.407090 | ||
| 0 | 0.399428 | 0 | 0.608598 | |||
| 1.195780 | −0.265071 | 1.020783 | −0.189894 | |||
| 1 | 0.05 | −0.861087 | 1.247827 | −0.769082 | 1.406550 | |
| 0 | 0.488260 | 0 | 0.607789 | |||
| 0.861087 | −0.271306 | 0.769082 | −0.190972 | |||
| 0.15 | −0.835022 | 1.247827 | −0.756813 | 1.406550 | ||
| 0 | 0.488260 | 0 | 0.607789 | |||
| 0.835022 | −0.271306 | 0.756813 | −0.190972 | |||
| 0.2 | −0.833913 | 1.247827 | −0.753188 | 1.406550 | ||
| 0 | 0.488260 | 0 | 0.607789 | |||
| 0.833913 | −0.271306 | 0.753188 | −0.190972 | |||


 for N1, M, φ and distinct n
| Cu–water | ||||||||
|---|---|---|---|---|---|---|---|---|
| M | K | φ | n = 0.0 | n = 0.5 | ||||
|
|
|
|
|
|
|||
| 10−7 | 1 | 0.1 | 0.691779 | 0.085912 | 0.010277 | 0.813191 | 0.093913 | 0.011531 |
| 10−6 | 0.945615 | 0.050471 | 0.003659 | 1.083458 | 0.055256 | 0.003881 | ||
| 10−5 | 6.877988 | 0.000465 | 0.000018 | 7.116813 | 0.010491 | 0.000744 | ||
| 10−7 | 2 | 0.551502 | 0.069872 | 0.007756 | 0.719432 | 0.083075 | 0.010198 | |
| 3 | 0.466232 | 0.058929 | 0.006346 | 0.652080 | 0.075288 | 0.009240 | ||
| 4 | 0.408703 | 0.051265 | 0.005471 | 0.600686 | 0.069334 | 0.008499 | ||
| 1 | 0.05 | 0.625838 | 0.078389 | 0.009190 | 0.751624 | 0.087123 | 0.010723 | |
| 0.15 | 0.625838 | 0.078389 | 0.009190 | 0.751624 | 0.087123 | 0.010723 | ||
| 0.2 | 0.625838 | 0.078389 | 0.009190 | 0.751624 | 0.087123 | 0.010723 | ||


 for N1, M, φ and n
| Al2O3–water | ||||||||
|---|---|---|---|---|---|---|---|---|
| M | K | φ | n = 0.0 | n = 0.5 | ||||
|
|
|
|
|
|
|||
| 10−7 | 1 | 0.1 | 0.589384 | 0.073201 | 0.008584 | 0.698279 | 0.080806 | 0.009934 |
| 10−6 | 0.766655 | 0.047268 | 0.003592 | 0.888616 | 0.051682 | 0.003936 | ||
| 10−5 | 5.270802 | 0.000533 | 0.000015 | 5.491650 | 0.006956 | 0.000369 | ||
| 10−7 | 2 | 0.467838 | 0.058713 | 0.006477 | 0.617781 | 0.071474 | 0.008779 | |
| 3 | 0.394924 | 0.049220 | 0.005321 | 0.559961 | 0.064732 | 0.007922 | ||
| 4 | 0.346119 | 0.042662 | 0.004559 | 0.515870 | 0.059506 | 0.007218 | ||
| 1 | 0.05 | 0.567381 | 0.071016 | 0.008240 | 0.685102 | 0.079566 | 0.009805 | |
| 0.15 | 0.567381 | 0.071016 | 0.008240 | 0.685102 | 0.079566 | 0.009805 | ||
| 0.2 | 0.567381 | 0.071016 | 0.008240 | 0.685102 | 0.079566 | 0.009805 | ||


 for K, M, φ and n with Pr = 6.2
| Cu–water | ||||||||
|---|---|---|---|---|---|---|---|---|
| M | K | φ | n = 0.0 | n = 0.5 | ||||
|
|
|
|
|
|
|||
| 10−7 | 1 | 0.1 | 0.976002 | 0.625531 | 0.894378 | 1.010236 | 0.511496 | 0.817287 |
| 10−6 | 1.014206 | 0.502684 | 0.810538 | 1.047785 | 0.415034 | 0.743960 | ||
| 10−5 | 1.416020 | 0.094820 | 0.374691 | 1.434746 | 0.087727 | 0.361806 | ||
| 10−7 | 2 | 0.926816 | 0.852550 | 1.026503 | 0.976897 | 0.628893 | 0.895597 | |
| 3 | 0.891638 | 1.077594 | 1.138896 | 0.950471 | 0.746466 | 0.965929 | ||
| 4 | 0.864509 | 1.301745 | 1.238182 | 0.928661 | 0.864375 | 1.030293 | ||
| 1 | 0.05 | 1.003951 | 0.899119 | 1.094526 | 1.043860 | 0.713781 | 0.987421 | |
| 0.15 | 0.903354 | 0.596328 | 0.841090 | 0.938019 | 0.479655 | 0.762802 | ||
| 0.2 | 0.857919 | 0.490484 | 0.741267 | 0.890235 | 0.397167 | 0.674087 | ||


 for K, M, φ and n when Pr = 6.2
| Al2O3–water | ||||||||
|---|---|---|---|---|---|---|---|---|
| M | K | φ | n = 0.0 | n = 0.5 | ||||
|
|
|
|
|
|
|||
| 10−7 | 1 | 0.1 | 0.932422 | 0.834821 | 1.016303 | 0.966518 | 0.675214 | 0.924473 |
| 10−6 | 0.964089 | 0.686724 | 0.931296 | 0.997735 | 0.559994 | 0.850331 | ||
| 10−5 | 1.360115 | 0.111887 | 0.405929 | 1.380663 | 0.102134 | 0.389729 | ||
| 10−7 | 2 | 0.884116 | 1.152682 | 1.172595 | 0.933797 | 0.838537 | 1.017006 | |
| 3 | 0.849870 | 1.468078 | 1.304933 | 0.907950 | 1.002624 | 1.100002 | ||
| 4 | 0.823621 | 1.782222 | 1.421429 | 0.886673 | 1.167569 | 1.175876 | ||
| 1 | 0.05 | 0.976038 | 1.077483 | 1.185520 | 1.015805 | 0.849488 | 1.066400 | |
| 0.15 | 0.878960 | 0.709963 | 0.908840 | 0.913561 | 0.567020 | 0.821797 | ||
| 0.2 | 0.835014 | 0.581655 | 0.799721 | 0.867296 | 0.467622 | 0.725061 | ||


5. Concluding remarks
The properties of magneto-hydrodynamic oblique stagnation point flow of micropolar nanofluid over an oscillatory plate were reported by way of parametric study. In this attempt, we have chosen alumina Al2O3 and copper Cu as nanoparticles when water is treated as base a fluid. The key finding of the current analysis is itemized as follows• The momentum boundary layer is thicker for Al2O3–water as associated to Cu–water. In addition, Al2O3–water results show more surface temperature while Cu–water generates the lowest surface temperature.
• Thickness decay is found for momentum boundary layer against increasing value of nanoparticles volume fraction while opposite attitude towards material parameter. Further, the thickness of momentum boundary layer is thin for the case of weak concentration as compared to strong concentration.
• The local wall shear stress is the increasing function of Hartmann number and material parameter while it shows opposite attitude towards nanoparticles volume fraction. It was also noticed that Cu–water with the comparison of Al2O3–water gives maximum local wall shear stress.
• The magnitude of rate of heat transfer is significantly large for Cu–water as compared to Al2O3–water. On the other hand, the heat transfer rate near the plate surface is declining function of Hartmann number while the contrary trend is found for both material parameter and nanoparticles volume fraction.
Conflicts of interest
There are no conflicts of interest to declareAcknowledgements
The authors extend their appreciation to the Deanship of Scientific Research at King Khalid University for funding this work through research groups program under Grant no. R.G.P-1/63/40.References
- S. U. S. Choi, ASME-Publications-Fed, 1995, vol. 231, pp. 99–106 Search PubMed.
- S. M. S. Murshed, K. C. Leong and C. Yang, Int. J. Therm. Sci., 2008, 47(5), 560–568 CrossRef CAS.
- W. Luther, VDI Technologiezentrum, Germany, 2004 Search PubMed.
- B. C. Pak and Y. I. Cho, Exp. Heat Transfer, 1998, 11(2), 151–170 CrossRef CAS.
- W. Aftab, X. Huang, W. Wu, Z. Liang, A. Mahmood and R. Zou, Energy Environ. Sci., 2018, 11, 1392–1424 RSC.
- M. Usman, M. Hamid, R. U. Haq and W. Wang, Int. J. Heat Mass Transfer, 2018, 123, 888–895 CrossRef CAS.
- Z. Li, M. Sheikholeslami, S. Ahmad, S. Saleem and A. J. Chamkha, J. Mol. Liq., 2018, 266, 181–193 CrossRef CAS.
- N. S. Akbar and Z. H. Khan, J. Magn. Magn. Mater., 2016, 410, 72–80 CrossRef CAS.
- R. Mehmood, S. Nadeem, S. Saleem and N. S. Akbar, J. Taiwan Inst. Chem. Eng., 2017, 74, 49–58 CrossRef CAS.
- M. Hamid, M. Usman, Z. H. Khan, R. U. Haq and W. Wang, Eur. Phys. J. Plus, 2018, 133, 527 CrossRef.
- M. I. Afridi, M. Qasim and S. Saleem, J. Nanofluids, 2018, 7(6), 1272–1280 CrossRef.
- M. Sheikholeslami, M. Jafaryar, S. Saleem, Z. Li, S. Ahmad and Y. Jiang, Int. J. Heat Mass Transfer, 2018, 126(B), 156–163 CrossRef CAS.
- J. Buongiorno, J. Heat Transfer, 2006, 128(3), 240–250 CrossRef.
- M. Sheikholeslami and D. D. Ganji, Powder Technol., 2013, 235, 873–879 CrossRef CAS.
- A. U. Khan, S. Nadeem and S. T. Hussain, J. Mol. Liq., 2016, 224, 1210–1219 CrossRef CAS.
- S. Nadeem, A. U. Khan and S. T. Hussain, Introd. Hydrogen Energy, 2017, 42(48), 28945–28957 CrossRef CAS.
- A. Hussain, M. Y. Malik, T. Salahuddin, S. Bilal and M. Awais, J. Mol. Liq., 2017, 231, 341–352 CrossRef CAS.
- M. Sheikholeslami, A. Ghasemi, Z. Li, S. Ahmad and S. Saleem, Int. J. Heat Mass Transfer, 2018, 126(A), 1252–1264 CrossRef CAS.
- A. C. Eringen, Theory of micropolar fluids, Purdue Univ Lafayette In School Of Aeronautics And Astronautics, 1965 Search PubMed.
- H. Power, Int. Conf. on Bio fluid Mechanics, UK, 1998 Search PubMed.
- G. Lukaszewicz, Micropolar fluids: theory and applications, Springer Science & Business Media, 1999 Search PubMed.
- K. Das, Int. J. Heat Mass Transfer, 2012, 55(23), 7166–7174 CrossRef CAS.
- I. L. Animasaun, Ain Shams Eng. J., 2016, 7(2), 755–765 CrossRef.
- S. Nadeem, Z. Ahmed and S. Saleem, Z. Naturforsch., 2016, 71(12), 1121–1129 CAS.
- N. S. Gibanov, M. A. Sheremet and I. Pop, J. Mol. Liq., 2016, 221, 518–525 CrossRef CAS.
- A. Borrelli, G. Giantesio and M. C. Patria, Int. J. Heat Mass Transfer, 2015, 80, 614–625 CrossRef.
- M. Sheikholeslami, M. Hatami and D. D. Ganji, J. Mol. Liq., 2014, 194, 30–36 CrossRef CAS.
- N. Abbas, S. Saleem, S. Nadeem, A. A. Alderremy and A. U. Khan, Results Phys., 2018, 9, 1224–1232 CrossRef.
- S. Nadeem, N. S. Akbar and M. Y. Malik, Numer Methods Partial Differ. Equ., 2010, 26(6), 1660–1674 Search PubMed.
- H. S. Takhar, A. J. Chamkha and G. Nath, Int. J. Eng. Sci., 2002, 40, 1511–1527 CrossRef.
- M. I. Khan, M. Z. Kiyani, M. Y. Malik, T. Yasmeen, M. W. A. Khan and T. Abbas, Alexandria Eng. J., 2016, 55, 2367–2373 CrossRef.
- S. Nadeem, A. U. Arif and S. Saleem, Eur. Phys. J. Plus, 2016, 131, 261 CrossRef.
- M. I. Afridi, M. Qasim, I. Khan and I. Tilil, Case Studies in Thermal Engineering, 2018, 12, 292–300 CrossRef.
- T. R. M. S. Dholey and A. S. Gupta, Heat Mass Transfer, 2007, 43, 767–773 CrossRef.
- N. F. Dzulkifli, N. Bachok, N. A. Yacob, N. M. Arifin and H. Rosali, Appl. Sci., 2018, 8, 2172 CrossRef.
- S. L. Jena and M. N. Mathur, Int. J. Eng. Sci., 1981, 19(11), 1431–1439 CrossRef CAS.
- G. S. Guram and A. C. Smith, Comput. Math. Appl., 1980, 6(2), 213–233 CrossRef.
- K. Rup and A. Dróżdż, Arch. Thermodyn., 2013, 34(3), 45–59 Search PubMed.
- A. A. Mohammadein and R. Subba Reddy Gorla, Int. J. Numer. Methods Heat Fluid Flow, 2009, 11(1), 50–58 CrossRef.
- A. Borrelli, G. Giantesio and M. C. Patria, Z. Angew. Math. Phys., 2012, 63(2), 271–294 CrossRef CAS.
| This journal is © The Royal Society of Chemistry 2019 |