 Open Access Article
Enhancement of the polymerase chain reaction by tungsten disulfide†
Dong Zhangac,
Yingcun Lia,
Xuange Zhanga,
Yongqiang Cheng *a and
Zhengping Li
 *ab
*ab
aKey Laboratory of Medicinal Chemistry and Molecular Diagnosis, Ministry of Education, Key Laboratory of Analytical Science and Technology of Hebei Province, College of Chemistry and Environmental Science, Hebei University, Baoding 071002, Hebei, P. R. China. E-mail: yqcheng@hbu.edu.cn; Fax: +86 312 5079403; Tel: +86 312 5079403
bSchool of Chemistry and Biological Engineering, University of Science and Technology Beijing, Beijing, 100083, P. R. China. E-mail: lzpbd@ustb.edu.cn
cSports Science Institute of Hebei Province, Shijiazhuang 050011, Hebei, P. R. China
First published on 26th March 2019
Abstract
In this paper, we demonstrated that the polymerase chain reaction (PCR) could be dramatically enhanced by tungsten disulfide (WS2). The results showed that the PCR efficiency could be increased with the addition of WS2 and at a lower annealing temperature, which simplified the design and operation of PCR. Moreover, PCR with WS2 showed better specificity and efficiency as compared with graphene oxide (GO) for a human genome DNA sample. The mechanism of enhancement of PCR by WS2 was discussed according to the typical structure and the characteristics of selective adsorption of single-stranded DNA by WS2. The results suggested that WS2 as a PCR enhancer can promote the PCR performance and extend the PCR application in biomedical research, clinical diagnostic, and bioanalysis.
Introduction
Polymerase chain reaction (PCR), as a basic technology in biological and clinical research, is the most practical method of nucleic acid amplification and has been successfully applied in genetic analysis, DNA sequencing, pathogen detection, disease diagnosis, etc.1–6 However, the traditional PCR has also shown some fundamental limitations, such as the rigorous primer design, high-precision temperature cycling, and the non-specific amplification and false-positive results, which restrict the PCR in its wide application.7,8It was found that the optimization of the key parameters in the PCR, including the design of primers, the annealing temperature, the number of cycles, the quality and type of the template, and the concentration of DNA polymerase, can improve the amplification efficiency and specificity.9,10 Moreover, it was reported that the efficiency, specificity and sensitivity of the PCR could be improved by adding some chemical and biological additives, such as dimethyl sulfoxide (DMSO), formamide, and the single strand DNA binding protein (SSB).11–13 Due to the high thermal conductivity and specific surface area, nanomaterials had attracted the attention of researchers for improving PCR. Many researchers tried to use nanomaterials as additives to optimize the PCR efficiency.14–18 Up to now, gold nanoparticles (AuNPs), graphene oxide (GO), quantum dots (QDs), carbon nanotubes (CNTs), and some other metal nanoparticles and nanocomposites have been used to improve the specificity and efficiency of the PCR.19–23 Although AuNPs can improve the specificity and efficiency of PCR, its own colour limited its application in some colorimetric reactions.24–27 GO and QDs can enhance the specificity of the PCR, the high dosage will, however, interfere with the detection of signals.28–32 Therefore, it is desired to further develop new materials for enhancing PCR.
Recently, the layered nanomaterials of transition metal sulfides, such as tungsten disulfide (WS2) and molybdenum disulfide (MoS2), had aroused great concern in many fields of science because of their unique optical and catalytic properties.33,34 It was discovered that WS2 could be synthesized in large scale and directly dispersed in aqueous solution as compared with GO that involved oxidation treatment, which might change the semiconductor properties of nanostructures.30 Therefore, WS2 showed great potential in biomedical applications. Yuan et al. established a simple ultrasonic assisted method to prepare water-soluble WS2 nanoscale and found that WS2 could adsorb ssDNA and quench the fluorescence of dye.35 The adsorbed ssDNA could leave WS2 nanoscale by interacting with other biomolecules, resulting in the recovery of fluorescence. More recently, Wang et al. reported that MoS2 and WS2 could enhance PCR signals owing to the adsorption of both the ssDNA PCR primers and DNA-staining dyes, SYBR Green I, with an appropriate strength.36 These discoveries enable WS2 to have more applications in the fields of biosensing and bioanalysis.
In this paper, we systematically studied the effects of WS2 concentration and annealing temperatures on PCR and demonstrated that the addition of WS2 within a certain concentration range in the PCR system could significantly improve the efficiency and specificity of PCR at a lower annealing temperature. In addition, WS2 showed the better specificity and efficiency in PCR as compared with graphene oxide (GO), indicating that WS2 had the excellent performance in enhancing PCR, and the great potential for PCR-based bioassays and applications.
Results and discussion
Characterization of the WS2
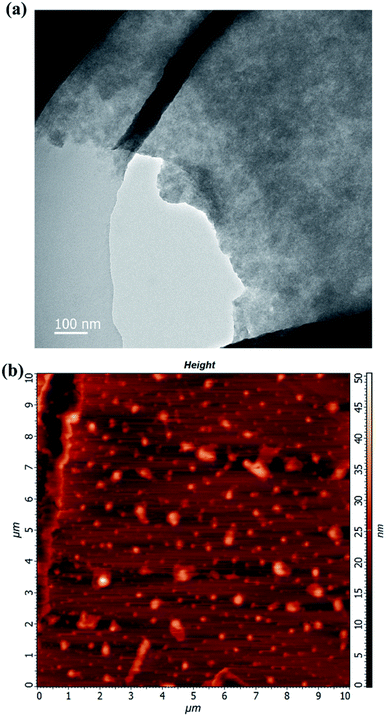
The morphology of the used WS2 was characterized by transmission electron microscopy (TEM) and atomic force microscopy (AFM) as shown in Fig. 1. In the TEM image of the WS2 (Fig. 1a), the stacked, fragmented WS2 feature was observed. In the AFM images (Fig. 1b), the entire area of the individual fragmented WS2 exhibited a uniform thickness. In particular, the size range of these WS2 sheets was nearly 50–500 nm.Enhancement of PCR by WS2 with different concentration
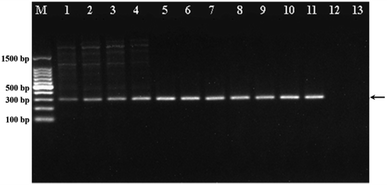
To demonstrate the ability of WS2 to enhance the PCR efficiency, we first analysed the PCR products by agarose gel electrophoresis by using the PCR to amplify the ACTN3 gene from the human genomic DNA with different concentrations of WS2. As shown in Fig. 2, the band intensities of the PCR products gradually increased with increasing WS2 concentration in the range from 0 to 5 μg mL−1, indicating that the amplification efficiency of PCR could be greatly improved by WS2. However, when the WS2 concentration was greater than 20 μg mL−1, no PCR products could be detected (lane 12 and 13), suggesting that the PCR could be inhibited in the presence of a large amount of WS2. More importantly, the tailing bands could be obviously observed in PCR products in the absence of WS2, which indicated the non-specific PCR amplification. The non-specific “tailing” bands could be gradually diminished with addition of WS2 in PCR and completely eliminated when the WS2 concentration was greater than 1 μg mL−1. These results could demonstrate that the WS2 could effectively improve the PCR amplification efficiency and specificity. The concentration of WS2 was critical for obtaining optimal PCR results. The wide WS2 concentration range from 1 μg mL−1 to 15 μg mL−1 could be employed in this PCR system.Enhancement of PCR by WS2 at different annealing temperature
In traditional PCR, the annealing temperature has a great influence on the specificity of PCR and the amplification efficiency. When the annealing temperature is too high, the primers and the template DNA cannot hybridize well, resulting in low amplification efficiency. Conversely, annealing temperature is too low, the primer would be non-specifically annealing with the template DNA, resulting in the non-specific amplification productions of DNA fragments. Therefore, we investigated the effect of WS2 on the PCR performance at different annealing temperature. Fig. 3 was the agarose electrophoretic image of the PCR products without the addition of WS2 (lanes 1–4) and with the addition of WS2 (lanes 1′–4′), when the annealing temperature was 40, 45, 50, and 55 °C, respectively. As shown in Fig. 3, it could be seen there were many diffuse DNA bands for PCR products and the specific 291 bp band of PCR products could not be observed in the lane 1 and lane 2, indicating that in the absence of WS2, no specific PCR products could be detected at lower annealing temperature (40 °C and 45 °C). On the other hand, the bands of specific PCR products (291 bp) could be obviously observed with addition of WS2 at the lower annealing temperature (lane 1′ and lane 2′). Moreover, at the same annealing temperature, the band of specific PCR products by addition of WS2 (lane 3′) were much brighter than that in the absence of WS2 (lane 3). These results indicate that the addition of WS2 in PCR can greatly enhance the PCR amplification specificity and efficiency even at a lower annealing temperature, which suggests that WS2 makes the PCR very suitable for wide annealing temperature and facilitates the application of PCR.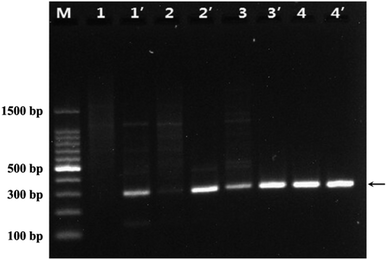 | ||
| Fig. 3 Agarose gel images of WS2 effect on PCR under the different annealing temperature. Lane M was DNA marker. Lane 1 to lane 4 without the WS2, lane 1′ to lane 4′ was added 5 μg mL−1 WS2. The annealing temperature of PCR for lane 1/1′ to lane 4/4′ was 40, 45, 50, 55 °C, respectively. The arrows indicated the positions of the target DNA fragment. The experiment conditions were the same as Fig. 2. | ||
Moreover, to further prove the enhancement effects of WS2 on PCR, we investigated the PCR with the varied lengths of the PCR products and the other DNA polymerase (Fig. S1†). The same enhancement effects of WS2 on PCR as Taq DNA polymerase were observed with the different lengths of PCR products and Phusion DNA polymerase, where annealing temperature optimization was not successful without WS2.
To investigate the effect of WS2 on the fidelity of DNA polymerase, the PCR products of 291 bp without and with WS2 were sequenced by Sanger sequencing. The sequencing result showed that the sequences of the PCR products with WS2 were identical to those without WS2, indicating that the addition of WS2 would not affect the fidelity of DNA polymerase (Fig. S2 and Table S1†).
Effect on the PCR efficiency with WS2 by real-time PCR assays
The effect of WS2 on the PCR efficiency was also investigated by real-time quantitative PCR by using SYBR Green I as the fluorescence dye (Fig. 4). In this case, relative fluorescence intensity was directly associated with the yield of the PCR products in response to the WS2. Compared to the control assay without the addition of WS2 in PCR, the PCR efficiency for genomic DNA was obviously enhanced in the presence of the WS2. In particular, the efficiency produced by the WS2 was about 1.8 times higher than that of the control. Therefore, the WS2 shows great enhancement for PCR efficiency in both the conventional PCR and real-time fluorescence PCR, suggesting the great potential of WS2 enhancement for real-time quantitative PCR.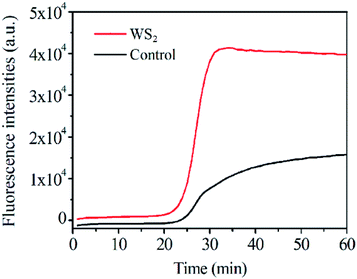 | ||
| Fig. 4 Different amount WS2 effect on fluorescence intensity of real-time PCR assays, the final concentration of WS2 was 0 and 5 μg mL−1. | ||
Comparison of the effects of WS2 and GO on PCR
It has been reported that GO can be used as an excellent additive to enhance the PCR amplification efficiency and specificity.37 WS2 is similar to GO as the layered two-dimension nanomaterials. Therefore, we compared the enhancement efficiency for PCR between WS2 and GO. As shown in Fig. 5a, in the absence of WS2 and GO, the band of PCR producers were weaker and many non-specific amplification products could be detected. When the WS2 or GO were respectively added into PCR in the concentration ranging from 0.3 to 1 μg mL−1, the band densities of the PCR products were significantly increased with increasing the concentration of WS2 or GO and the non-specific bands were gradually reduced. At the same time, it could be seen from Fig. 5b, the band densities of WS2-enhanced PCR products was higher than those of GO-enhanced PCR. More importantly, when the WS2 concentration was greater than 3 μg mL−1, the band densities of the WS2-enhanced PCR products reached their maximum and the non-specific bands could be completely eliminated. In contrast, when the GO concentration was greater than 3 μg mL−1, the PCR could be inhibited so that no PCR products could be detected. These results demonstrated that WS2 showed significantly higher enhancement than GO for PCR amplification efficiency and WS2 could be employed at high concentration in PCR to achieve the optimized amplification efficiency and specificity.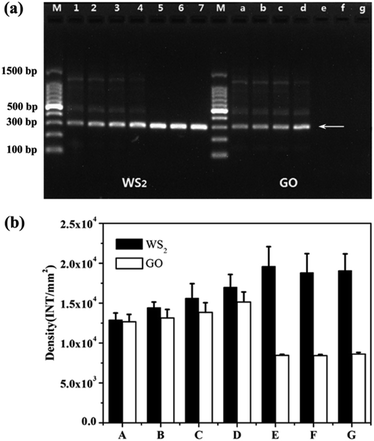 | ||
| Fig. 5 Comparison of the enhancement effects of WS2 and GO on PCR. (a) Lane M was marker. The final concentration of WS2 for lane 1 to lane 7 was 0, 0.3, 0.5, 1, 3, 5, 7 μg mL−1, the final concentration of GO for lane a to lane g was 0, 0.3, 0.5, 1, 3, 5, 7 μg mL−1. The arrows indicated the positions of the target DNA fragment. (b) A–G is the optical density of WS2/GO at concentrations of 0, 0.3, 0.5, 1, 3, 5 and 7 μg mL−1, respectively. The experiment conditions were the same as Fig. 2. | ||
The mechanism of enhancement of PCR by WS2
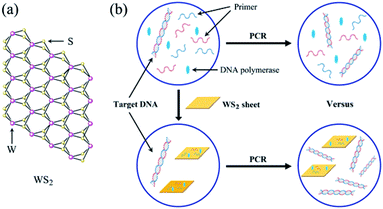
Owing to their unique structure and physicochemical properties, nanoparticles have been shown to be effective in suppressing nonspecific amplification and improving the sensitivity of PCR.38 Moreover, the relevant mechanisms of PCR enhanced by various nanoparticles, such as AuNPs and GO et al. have been studied.39 Similarly, the mechanism of enhancement of PCR by WS2 is closely related to its structure and photophysical property. As shown in Fig. 6a, WS2 has a two-dimensional (2D) graphene-like layered structure and the layers are bound by a weak van der Waals force. Each tungsten atom is surrounded by six sulfur atoms and the tungsten atoms and sulfur atoms are covalently bonded to form a two-dimensional crystal material with a sandwich structure.36 Accordingly, the typical layered structure of WS2 endows it some unique properties for enhancement of PCR as follows.It was reported that WS2 had the ability to selectively adsorb ssDNA because the similar structure and properties of GO.40 Thus, in the denaturation stage of PCR, forward and reverse primers (ssDNA) can be adsorbed on the surface of WS2 by non-covalent binding. In the annealing stage of PCR, forward and reverse primers can hybridize with template DNA to form double strands so as to escape from the surface of WS2. In this way, a dynamic equilibrium process of adsorption and desorption may be formed between ssDNA primers and WS2, which reduces the mismatch probability between the primers and the DNA template at the annealing stage, thus reducing the primers dimer formation and improving the specificity of PCR. In addition, WS2 may absorb DNA polymerase for the enhancement of the PCR on the basis of the adsorption and desorption kinetic mechanism. Similar to the interaction between ssDNA–WS2, the polarity group on the amino acid structure of the polymerase is positively charged, so there is a tendency to be adsorbed by WS2. On the other hand, the side chain of protein does not contain polar groups, indicating that it is not completely adsorbed by WS2. These results can affect the activity of DNA polymerase in the PCR system so as to reduce the generation of nonspecific amplification and enhance the amplification efficiency of the PCR.
Because the metal centre of WS2 is sandwich and there is no direct interaction with DNA, the interaction between WS2 and ssDNA may be van der Waals force.41 GO absorbing DNA mainly depends on hydrogen bonding and van der Waals force, which is stronger than that of WS2. Therefore, in the thermal cycle of PCR, ssDNA primer is easier to desorption from WS2 than GO. Thus, the high desorption efficiency of primers from WS2 results in better enhancement of PCR by WS2 than GO in Fig. 5.
Conclusions
In this work, we have demonstrated that WS2 with the layered structure can significantly improve the amplification efficiency with the more PCR products and specificity of PCR by reducing the nonspecific bands. Furthermore, the WS2 nanomaterials have the better enhancement effect for PCR amplification than GO. More importantly, the WS2 can be employed in PCR in the wide concentration and temperature ranges, which make the PCR very facile performance under mild conditions and may avoid the strict optimization of experiment condition of PCR. Even in the conventional PCR, when optimization of annealing temperature is not successful to improve the specificity of PCR, the significant enhancement effect can be achieved by adding WS2 nanosheets to the PCR. Therefore, the WS2-based enhancement PCR can effectively extend the PCR applications and has great potential in molecular biology, genetic analysis, biomedical research, and clinical diagnosis, etc. At the same time, this work provides a new idea for studying the application of two-dimensional nanomaterials in the other nucleic acid amplification technologies.Experimental
Materials and reagents
Taq™ Hot Start DNA Polymerase, DNA marker, loading buffer were purchased from Takara Biotechnology Co., Ltd (Dalian, China). Tungsten disulfide (WS2) nanosheet dispersion with LiOH (single layer ratio ≥ 90%) and Graphene oxide (GO) were purchased from Nanjing XF Nano Material Tech Co., Ltd. (Nanjing, China). Agarose was obtained from Sangon Biotech Co., Ltd. (Shanghai, China). GelGreen was obtained from Biotium Co., Ltd. (California, USA). Genomic DNA was extracted from human blood by using TIANamp Genomic DNA Kit (TIANGEN Biotechnology, China). All chemical reagents were of analytical reagent grade and all solutions were prepared with ultrapure water. The sequences of oligonucleotides used in this work were listed below, which were synthesized and purified by TaKaRa Biotechnology Co. Ltd. (Dalian, China).PCR Primer F: CTGTTGCCTGTGGTAAGTGGG
PCR Primer R: TGGTCACAGTATGCAGGAGGG
Characterization of WS2 nanosheet
A small amount of WS2 nanosheet solution was dispersed evenly with ultrasonic for 10 min. Then it was diluted to light yellow with deionized water. Subsequently, about 2 μL solution was dropped onto a micro grid for transmission electron microscopy (TEM) analysis with Tecnai G2 F20 (FEI, Hillsboro, USA).A small amount of WS2 nanosheet solution was diluted to a light yellow color, and then dispersed it with ultrasonic for 10 min. After that, about 2 μL of WS2 nanosheet solution was dropped onto a new mica sheet and dried naturally for atomic force microscope (AFM) characterization with non-contact mode on Dimension Icon (BRUKER, Massachusetts, USA).
Extraction of genomic DNA
The human genome DNA was obtained from peripheral blood samples of athlete volunteers and extracted by using TIANamp Genomic DNA Kit (TIANGEN Biotechnology). The concentration of the extracted genomic DNA was measured by NanoDrop™ One spectrophotometer (Thermo Fisher Scientific Co. Ltd) at 260 nm.Polymerase chain reaction
In the model PCR system, the forward primer and reverse primer were used to amplify a 291 bp fragment from the human genomic DNA of ACTN3 gene (rs1815739 SNP site.) as target sequence. The reaction was performed in a 10 μL mixture containing 13.7 ng μL−1 of genomic DNA, 0.25 mM of dNTPs, 200 nM of forward and reverse primers, 1 μL of Taq™ Hot Start DNA Polymerase buffer (10 mM Tris–HCl pH 8.3, 50 mM KCl, 1.5 mM MgCl2), 0.15 U of Taq™ Hot Start DNA Polymerase, and different concentrations of WS2 nanomaterials with ultrasonic for 10 min. The PCRs were carried out in the 2720 thermal cycler (Applied Biosystems, USA), with the program of hot start at the 98 °C for 10 s, and 50 °C for 30 s, 72 °C for 1 min for 35 reaction cycles.Agarose gel electrophoresis
After the amplification, the PCR products were further analyzed by 2.2% agarose gel electrophoresis. Electrophoresis was performed in 1× TAE buffer solution, under 110 V voltage for 40 min, and then used to perform imaging with the VersaDoc Model 4000 gel imager (Bio-Rad, USA). The performance of nanomaterials for amplification and analysis of product was confirmed via the band intensities using gel documentation system and quantified by Image J.Real-time PCR amplification
Real-time PCR was performed in 10 μL aqueous solution containing 0.2 μL of Takara Ex Taq HS, 10× PCR buffer (100 mM Tris–HCl, pH = 8.9, 500 mM KCl, 15 mM MgCl2), 1 μL of 2.5 mM each of the dNTPs, 0.2 μL of 20× SYBR Green I, 1 μL of 10 pM each of forward and reverse primers, 1 μL DNA genome DNA and 3.8 μL of H2O. The mixture solution was initial denaturation at 94 °C for 4 min, and was followed by 50 cycles of 98 °C for 10 s, 50 °C for 30 s, 72 °C for 1 min in StepOne™ Real-Time PCR System.Conflicts of interest
There are no conflicts of interest to declare.Acknowledgements
The authors are grateful for the financial support of the National Natural Science Foundation of China (No. 21075028 and 21475031).Notes and references
- K. Mullis, F. Faloona, S. Scharf, R. Saiki, G. Horn and H. Erlich, Cold Spring Harbor Symp. Quant. Biol., 1986, 51, 263 CrossRef CAS PubMed.
- C. Ding and C. R. Cantor, Proc. Natl. Acad. Sci. U. S. A., 2003, 100, 7449 CrossRef CAS PubMed.
- M. Filteau, L. Lagace, G. LaPointe and D. Roy, Syst. Appl. Microbiol., 2010, 33, 165 CrossRef CAS PubMed.
- M. R. Tiba, C. de Moura, M. F. Carazzolle and D. D. S. Leite, Braz. J. Infect. Dis., 2011, 15, 144 CrossRef CAS PubMed.
- K. Satoh, M. Maeda, Y. Umeda, Y. Miyajima and K. Makimura, Microbiol. Immunol., 2011, 55, 454 CrossRef CAS PubMed.
- J. H. Lu, H. K. Li, H. J. An, G. H. Wang, Y. Wang, M. Q. Li, Y. Zhang and J. Hu, J. Am. Chem. Soc., 2004, 126, 11136 CrossRef PubMed.
- S. Kwok and R. Higuchi, Nature, 1989, 339, 237 CrossRef CAS PubMed.
- S. Yang and R. E. Rothman, Lancet Infect. Dis., 2004, 4, 337 CrossRef CAS PubMed.
- Z. Strezoska, A. Licon, J. Haimes, K. J. Spayd, K. M. Patel, K. Sullivan, K. Jastrzebski, K. J. Simpson, D. Leake, A. van B. Smith and A. Vermeulen, PLoS One, 2012, 7, e42341 CrossRef CAS PubMed.
- M. Niens, G. T. Spijke, A. Diepstra and G. J. te Meerman, Biotechnol. Appl. Biochem., 2005, 42, 157 CrossRef CAS PubMed.
- M. A. Jensen, M. Fukushima and R. W. Davis, PLoS One, 2010, 5, e11024 CrossRef PubMed.
- G. Sarkar, S. Kapelner and S. S. Sommer, Nucleic Acids Res., 1990, 18, 7465 CrossRef CAS PubMed.
- Q. Chou, Nucleic Acids Res., 1992, 20, 4371 CrossRef CAS PubMed.
- A. E. Nel, L. Mädler, D. Velegol, T. Xia, E. M. V. Hoek, P. Somasundaran, F. Klaessig, V. Castranova and M. Thompson, Nat. Mater., 2009, 8, 543 CrossRef CAS PubMed.
- A. Li, B. Zhou, C. S. Alves, B. Xu, R. Guo, X. Y. Shi and X. Y. Cao, ACS Appl. Mater. Interfaces, 2016, 8, 25808 CrossRef CAS.
- J. Y. Park, S. H. Back, S. J. Chang, S. J. Lee, K. G. Lee and T. J. Park, ACS Appl. Mater. Interfaces, 2015, 7, 15633 CrossRef CAS PubMed.
- Y. Bai, Y. Cui, G. C. Paoli, C. Shi, D. Wang and X. Shi, ACS Appl. Mater. Interfaces, 2015, 7, 13142 CrossRef CAS PubMed.
- E. Vanzha, T. Pylaev, V. Khanadeev, S. Konnova, V. Fedorova and N. Khlebtsov, RSC Adv., 2016, 6, 110146 RSC.
- X. Lou and Y. Zhang, ACS Appl. Mater. Interfaces, 2013, 5, 6276 CrossRef CAS PubMed.
- S. H. Hwang, S. G. Im, S. S. Hah, V. T. Cong, E. J. Lee, Y. S. Lee, G. K. Lee, D. H. Lee and S. J. Son, PLoS One, 2013, 8, e73408 CrossRef CAS PubMed.
- R. M. Williams, S. Nayeem, B. D. Dolash and L. J. Sooter, PLoS One, 2014, 9, e94117 CrossRef PubMed.
- R. Abdul Khaliq, P. J. Sonawane, B. K. Sasi, B. S. Sahu, T. Pradeep, S. K. Das and N. R. Mahapatra, Nanotechnology, 2010, 21, 255704 CrossRef CAS PubMed.
- W. Tong, X. Cao, S. Wen, R. Guo, M. Shen, J. Wang and X. Shi, Int. J. Nanomed., 2012, 7, 1069 CAS.
- X. Liu, Q. Dai, L. Austin, J. Coutts, G. Knowles, J. Zou, H. Chen and Q. Huo, J. Am. Chem. Soc., 2008, 130, 2780 CrossRef CAS PubMed.
- U. H. F. Bunz and V. M. Rotello, Angew. Chem., Int. Ed., 2010, 49, 3268 CrossRef CAS PubMed.
- P. Chen, D. Pan, C. Fan, J. Chen, K. Huang, D. Wang, H. Zhang, Y. Li, G. Feng, P. Liang, L. He and Y. Shi, Nat. Nanotechnol., 2011, 6, 639 CrossRef CAS PubMed.
- S. Pathak, S. K. Choi, N. Arnheim and M. E. Thompson, J. Am. Chem. Soc., 2001, 123, 4103 CrossRef CAS.
- G. Liang, C. Ma, Y. Zhu, S. Li, Y. Shao, Y. Wang and Z. Xiao, Nanoscale Res. Lett., 2011, 6, 51 Search PubMed.
- H. Shen, M. Hu and Z. Yang, Chin. Sci. Bull., 2013, 50, 2016 CrossRef.
- L. Liu, J. Zhang, J. Zhao and F. Liu, Nanoscale, 2012, 4, 5910 RSC.
- S. Li, A. N. Aphale, I. G. Macwan, P. K. Patra, W. G. Gonzalez, J. Miksovska and R. M. Leblanc, ACS Appl. Mater. Interfaces, 2012, 4, 7069 CrossRef CAS PubMed.
- A. Splendiani, L. Sun, Y. Zhang, T. Li, J. Kim, C. Y. Chim, G. Galli and F. Wang, Nano Lett., 2010, 10, 1271 CrossRef CAS PubMed.
- D. Voiry, H. Yamaguchi, J. Li, R. Silva, D. C. Alves, T. Fujita, M. Chen, T. Asefa, V. B. Shenoy, G. Eda and M. Chhowalla, Nat. Mater., 2013, 12, 850 CrossRef CAS PubMed.
- C. Zhu, Z. Zeng, H. Li, F. Li, C. Fan and H. Zhang, J. Am. Chem. Soc., 2013, 135, 5998 CrossRef CAS PubMed.
- Y. X. Yuan, R. Q. Li and Z. H. Liu, Anal. Chem., 2014, 86, 3610 CrossRef CAS PubMed.
- L. Wang, Z. Huang, R. Wang, Y. Liu, C. Qian, J. Wu and J. Liu, ACS Appl. Mater. Interfaces, 2018, 10, 4409 CrossRef CAS PubMed.
- J. Jia, L. Sun, N. Hu, G. Huang and J. Weng, Small, 2012, 8, 2011 CrossRef CAS PubMed.
- M. Yuce, H. Kurt, V. R. S. S. Mokkapati and H. Budak, RSC Adv., 2014, 4, 36800 RSC.
- W. C. Yang, X. H. Li, J. L. Sun and Z. F. Shao, ACS Appl. Mater. Interfaces, 2013, 5, 11520 CrossRef CAS PubMed.
- Q. Xi, D. M. Zhou, Y. Y. Kan, J. Ge, Z. K. Wu, R. Q. Yu and J. H. Jiang, Anal. Chem., 2014, 86, 1361 CrossRef CAS PubMed.
- R. Guo, Y. D. Jho and A. J. Minnich, Nanoscale, 2018, 10, 14432 RSC.
Footnote |
| † Electronic supplementary information (ESI) available. See DOI: 10.1039/c8ra09689a |
| This journal is © The Royal Society of Chemistry 2019 |

