
 Open Access Article
 This Open Access Article is licensed under a Creative Commons Attribution-Non Commercial 3.0 Unported Licence
Cisplatin, glutathione and the third wheel: a copper-(1,10-phenanthroline) complex modulates cisplatin–GSH interactions from antagonism to synergism in cancer cells resistant to cisplatin†
Sarah Vascellari‡
a,
Elisa Valletta‡b,
Daniela Perra‡a,
Elisabetta Pinnaa,
Alessandra Serraa,
Francesco Isaia b,
Alessandra Pani*a and
Tiziana Pivetta*b
b,
Alessandra Pani*a and
Tiziana Pivetta*b
aDipartimento di Scienze Biomediche, Università degli Studi di Cagliari, 09042 Monserrato, CA, Italy. E-mail: pania@unica.it
bDipartimento di Scienze Chimiche e Geologiche, Università degli Studi di Cagliari, 09042 Monserrato, CA, ITALY. E-mail: tpivetta@unica.it
First published on 12th February 2019
Abstract
The antagonistic effect of glutathione (GSH) against the cytotoxicity of cisplatin was observed in both wild type and cisplatin-resistant human leukaemia and ovarian carcinoma cell lines. The simultaneous presence of the cytotoxic copper complex [Cu(phen)2(OH2)](ClO4)2 (C0) restored the sensitivity of the cells to cisplatin, and, at selected concentrations, led to strong synergistic effects. The C0–cisplatin–glutathione system showed a synergistic toxic effect even in the presence of 1000 μM GSH. The three-drug cocktail exerted a higher potency against leukemic cells than against freshly isolated lymphocytes from healthy donors. Compared to actively proliferating normal lymphocytes, leukaemia cells were much more susceptible to the cytocide effect of the three-drug combination and underwent the dying process(es) much faster. When the ovarian carcinoma cells were treated with cisplatin, alone or in combination with C0, late apoptotic effects were mainly observed, suggesting that DNA interactions with the C0–cisplatin complex trigger a process of programmed cell death. In contrast, the ternary combination induced apoptotic effects similar to that shown by C0 in single treatment, that is, early apoptosis. One possible explanation is that C0 and cisplatin compete for GSH-binding in the culture medium. GSH in combination with C0 and cisplatin caused a significant induction of the apoptotic process(es), through a pathway which does not compromise the integrity of the plasma membrane of cells.
Introduction
Cisplatin, [Pt(NH3)2Cl2] (CDDP), is a potent chemotherapeutic agent used for several types of cancer, e.g. carcinoma of the ovary, testicle, head and neck, bones, brain, lymph node, and skin.1,2 CDDP still represents the elective cytotoxic agent for the treatment of the carcinoma of the ovary, which is the leading cause of death among gynaecological cancers worldwide, with 125![[thin space (1/6-em)]](https://www.rsc.org/images/entities/char_2009.gif) 000 deaths annually. The high mortality rate of this type of cancer is due either to the lack of early diagnosis or to the limited number of effective chemotherapeutic agents, for which CDDP, alone or in combination with Taxol,3 often represents the only choice for clinicians. Although CDDP can also be used to treat haematological malignancies, its use is limited to relapses by tumour cells resistant to first line drugs. CDDP is a multi-target drug4–6 but one of the main mechanisms of action is linked to the formation of adducts with DNA. Once in the bloodstream, CDDP binds different plasmatic thiol-containing proteins;7,8 however, only free CDDP molecules can enter the cells and, as the [Pt(NH3)2(H2O)Cl]+ species, react with a DNA base,9,10 thus leading to DNA distortions that activate DNA repair pathways or trigger the apoptotic cascade.11–14 The effectiveness of CDDP, as a single drug as well as in multidrug protocols, is limited by its high toxicity and by the selection, during cycles of chemotherapy, of drug-resistant cancer cell populations. The mechanisms proposed for CDDP-resistance include: (i) over-expression of drug-efflux pumps;15 (ii) increased ability to repair and/or to tolerate damaged DNA;16 (iii) overexpression of enzymes, e.g. hexokinase (HK),17 and of the STAT3/AKT pathway which promotes the Warburg effect and blocks the energetic metabolism of cancer cells via glycolysis;5 and (iv) increased intracellular levels of thiol-containing molecules like glutathione (GSH).11,13 With respect to the latter mechanism, CDDP–GSH adducts are thought to be responsible for the CDDP-resistance,18 even if the interaction of CDDP with GSH is not considered the most important molecular reaction of the drug within the cell.19 GSH content in disease-free tissues and in cancer cells varies from micromolar to millimolar20,21 concentrations, with marked differences for the organ in question.22 GSH was reported to be upregulated during the development of drug resistance,1,23 however, given that higher GSH levels were not found to correlate with lower Pt(II)-DNA adducts, it has been proposed that GSH might play a role in apoptotic regulatory pathways.12,13,24
000 deaths annually. The high mortality rate of this type of cancer is due either to the lack of early diagnosis or to the limited number of effective chemotherapeutic agents, for which CDDP, alone or in combination with Taxol,3 often represents the only choice for clinicians. Although CDDP can also be used to treat haematological malignancies, its use is limited to relapses by tumour cells resistant to first line drugs. CDDP is a multi-target drug4–6 but one of the main mechanisms of action is linked to the formation of adducts with DNA. Once in the bloodstream, CDDP binds different plasmatic thiol-containing proteins;7,8 however, only free CDDP molecules can enter the cells and, as the [Pt(NH3)2(H2O)Cl]+ species, react with a DNA base,9,10 thus leading to DNA distortions that activate DNA repair pathways or trigger the apoptotic cascade.11–14 The effectiveness of CDDP, as a single drug as well as in multidrug protocols, is limited by its high toxicity and by the selection, during cycles of chemotherapy, of drug-resistant cancer cell populations. The mechanisms proposed for CDDP-resistance include: (i) over-expression of drug-efflux pumps;15 (ii) increased ability to repair and/or to tolerate damaged DNA;16 (iii) overexpression of enzymes, e.g. hexokinase (HK),17 and of the STAT3/AKT pathway which promotes the Warburg effect and blocks the energetic metabolism of cancer cells via glycolysis;5 and (iv) increased intracellular levels of thiol-containing molecules like glutathione (GSH).11,13 With respect to the latter mechanism, CDDP–GSH adducts are thought to be responsible for the CDDP-resistance,18 even if the interaction of CDDP with GSH is not considered the most important molecular reaction of the drug within the cell.19 GSH content in disease-free tissues and in cancer cells varies from micromolar to millimolar20,21 concentrations, with marked differences for the organ in question.22 GSH was reported to be upregulated during the development of drug resistance,1,23 however, given that higher GSH levels were not found to correlate with lower Pt(II)-DNA adducts, it has been proposed that GSH might play a role in apoptotic regulatory pathways.12,13,24
In previous works,25–28 in a wide panel of human-derived haematologic and solid tumour cell lines, we described a novel class of copper(II) complexes with 1,10-phenanthroline (phen) endowed with cytotoxic effects comparable to, and in some cases higher than, CDDP. We also reported a strong synergistic cytotoxic effect of the complex [Cu(phen)2(H2O)](ClO4)2 (C0) in dual–drug combinations with CDDP against human T-lymphoblastic leukaemia (CCRF-CEM) cells.25–27 These findings, coupled with data in the literature that reported an increased cellular GSH level as one of the mechanisms of CDDP-resistance, prompted us to widen our studies by investigating the effect of GSH on the cytotoxicity of C0 in dual drug combinations, as well as the effect of ternary mixtures of GSH, C0, and CDDP in order to establish whether the presence of C0 could influence the antagonism of GSH on CDDP. Given the potential relevance of these studies for cisplatin-based anticancer therapies, especially in CDDP-resistant cancers, the drug cocktails were tested not only against cisplatin-responsive CCRF-CEM and ovarian carcinoma (A2780) cell lines, but also against CDDP-resistant subpopulations of both CCRF-CEM (CCRF-CEM-res) and A2780 (A2780-res) cells. The main aims of the work were: (i) to strengthen the role of GSH in cisplatin-resistance; and (ii) to identify combinations of CDDP, C0, and GSH with synergistic effects. Positive results would, in fact, enable the reduction of active doses of CDDP, as well as the emergence of drug-resistant cell mutants thus possibly offering an effective option to treat CDDP-resistant cancer. The concentrations of the three compounds were chosen on the basis of an experimental design (ED), whereas to study the effects of drug cocktails, and to correlate the drug concentrations with their cytotoxic activity, a model-free approach27 for data exploration and analysis, based on artificial neural networks (ANN), was used with the intent of predicting, and then experimentally confirming, the optimal drug combination(s). Finally, to determine the potential selectivity of the drug combinations toward cancer cells, the cytotoxic effects of the ternary mixtures were also tested in ex vivo cultures of human peripheral blood lymphocytes (PBLs) freshly isolated from healthy donors and compared to those in leukaemia CCRF-CEM cells.
Results and discussion
Selection of cisplatin-resistant T-leukaemia CCRF-CEM cells
A CCRF-CEM subline with a stable phenotype of CDDP-resistance (CCRF-CEM-res) was obtained in about 7 months of sub-cultivation of CCRF-CEM cells in the presence of increasing concentrations of CDDP. To avoid total cell death, cells that had grown at an increased dose had to be maintained at that same concentration for 3 to 5 passages before the CDDP dose was next raised. Moreover, given that cell resistance to CDDP appears to be multifactorial (reduced drug accumulation, increased drug inactivation, enhanced DNA-repair and increased DNA-damage tolerance),16 we deemed appropriate to obtain various mechanistically homogenous CDDP-resistant cell clones in order to study them separately. However, despite several efforts to grow cell clones by the single-cell dilution method, an otherwise successful procedure to obtain cloned cell populations resistant to cytotoxic drugs,29 single-cell cultures were not able to survive and multiply, even at CDDP doses close to its CC50. Throughout the selection time, the sensitivity of cells to CDDP was checked by the MTT method and compared to that of parental CCRF-CEM (CCRF-CEMwt) cells (ESI, Table S1†). After 52 passages in the presence of CDDP it was possible to obtain a stable cell population resistant to 5 μM CDDP (CCRF-CEM-res) with a Resistance Index (RI) of about 6. It is worth mentioning that cell populations growing in the presence of CDDP, as well as the final CDDP-res subline, never showed cross-resistance with the Cu(II) complex C0, thus suggesting different mechanism(s) of cytotoxicity and resistance by the two drugs. On the other hand, no modifications of the cell susceptibility to the reference compound Doxorubicin was ever observed.Glutathione cell content
Given that our goal was to investigate the effect of exogenously added GSH on the cytotoxic activity of CDDP and C0, alone and in combination with one another, it was of vital importance to determine the basal level of GSH in all different cell lines used. Basal endogenous GSH levels were significantly lower in the CCRF-CEM cells (approximately one third) than in the A2780 cells (Fig. 1A and B). The CDDP-resistant counterpart of both cell lines showed higher contents of GSH with respect to parental cells (Fig. 1A and B). It is worth mentioning that in all our model cell lines the GSH was present almost totally in the reduced form (between 97% and 99%, not shown). It should also be mentioned that the GSH content values found by us are in good agreement with those reported by other authors for the same cell lines (CCRF-CEM23 and A278030,31).
 | ||
| Fig. 1 GSH content in CDDP-sensitive and CDDP-resistant T-leukemia CCRF-CEM (A) and A2780 (B) cells. GSH level was determined by a fluorimetric kit and data represent the mean ± SD of three independent experiments. Values were expressed in μm of GSH/2 × 106 cells. Statistical analysis was performed using t test on grah pad prism 2016; **p < 0.001; ***p < 0,0001. | ||
Artificial neural network and experimental design
An artificial neural network (ANN) is a mathematical tool that emulates the structure of the brain and its learning ability27 (Fig. S1†). ANNs can be exploited for classification or prediction studies (i.e., this study). The results of an ANN are strictly related to the quality of the experimental data and, in this context, the experimental design32 determines the choice of the minimum set of data with the highest content of information. The concentrations of the drugs were chosen to be in the range of 0 to twice the CC50, preliminarily determined, following the experimental design reported in the ESI (Fig. S2).† C0, GSH and CDDP were respectively evaluated on wild type cells in the ranges 0–2, 0–1000, and 0–2 μM, and on the CDDP-res cells in the ranges 0–2, 0–1000, and 0–15 μM. Drug concentrations and cytotoxicity values were used to form the data matrix; drug concentrations were used as input data and cytotoxic activity values as output data. The generalization ability of the network was used to predict the cytotoxicity on the whole working space according to a bi-dimensional grid with 40 points per side for the binary systems, and according to a cube with 20 points per side for the ternary system. In this way, the cytotoxicity of 1600 (grid of 40 × 40) and 8000 (cube of 20 × 20 × 20) virtual drug combinations were predicted. At first, the data of binary systems were processed individually, and subsequently, all the data of binary and ternary systems were processed together. The results for the binary systems obtained in the two processes were strictly comparable, proving the robustness and the reliability of the method. A three layers structure with 4 (for binary systems) or 5 (for ternary systems) neurons in the hidden layer was sufficient to model the experimental data. The training of the network was checked by comparing calculated and experimental values of the output data. The good agreement between calculated and experimental values for the tested cells is shown in Fig. S3.† The trained network was used to predict the cytotoxicity values of single drugs and mixtures for the whole working space. From these predicted values, the dose–response curves for each compound and the cytotoxicity surfaces for binary and ternary systems were built; finally, the synergistic/antagonistic effect was calculated according to Pivetta et al.27 In brief, since the additive effect of two or more drugs is not the algebraic summation of their cytotoxic activities, the Non-Algebraic Additive Effect (NAEE) was considered, that is an index that represents an operational definition of the additive effect, calculated according to a sequential action of the drugs. Synergy or antagonism was then determined by calculating the Net Multi-Drug Effect Index (NMDEI); i.e. the difference between the predicted cytotoxic activity and the NAEE, calculated for all the points of the grids, for binary and ternary systems. The NMDEI values allow a surface that shows the possible interactions occurring among drugs to be defined; i.e. synergistic (positive values), additive (zero values), or antagonistic (negative values) effects.Cytotoxic effects of CDDP, C0 and GSH
In Fig. 2, the calculated dose/response curves for CDDP, GSH and C0 are shown. As can be seen, there is good agreement between calculated (line) and experimental points (●). The different shapes of the curves suggest different modes of action exerted by the drugs. The calculated drug concentrations required to inhibit the cell proliferation by 50% (CC50) are reported in Table 1.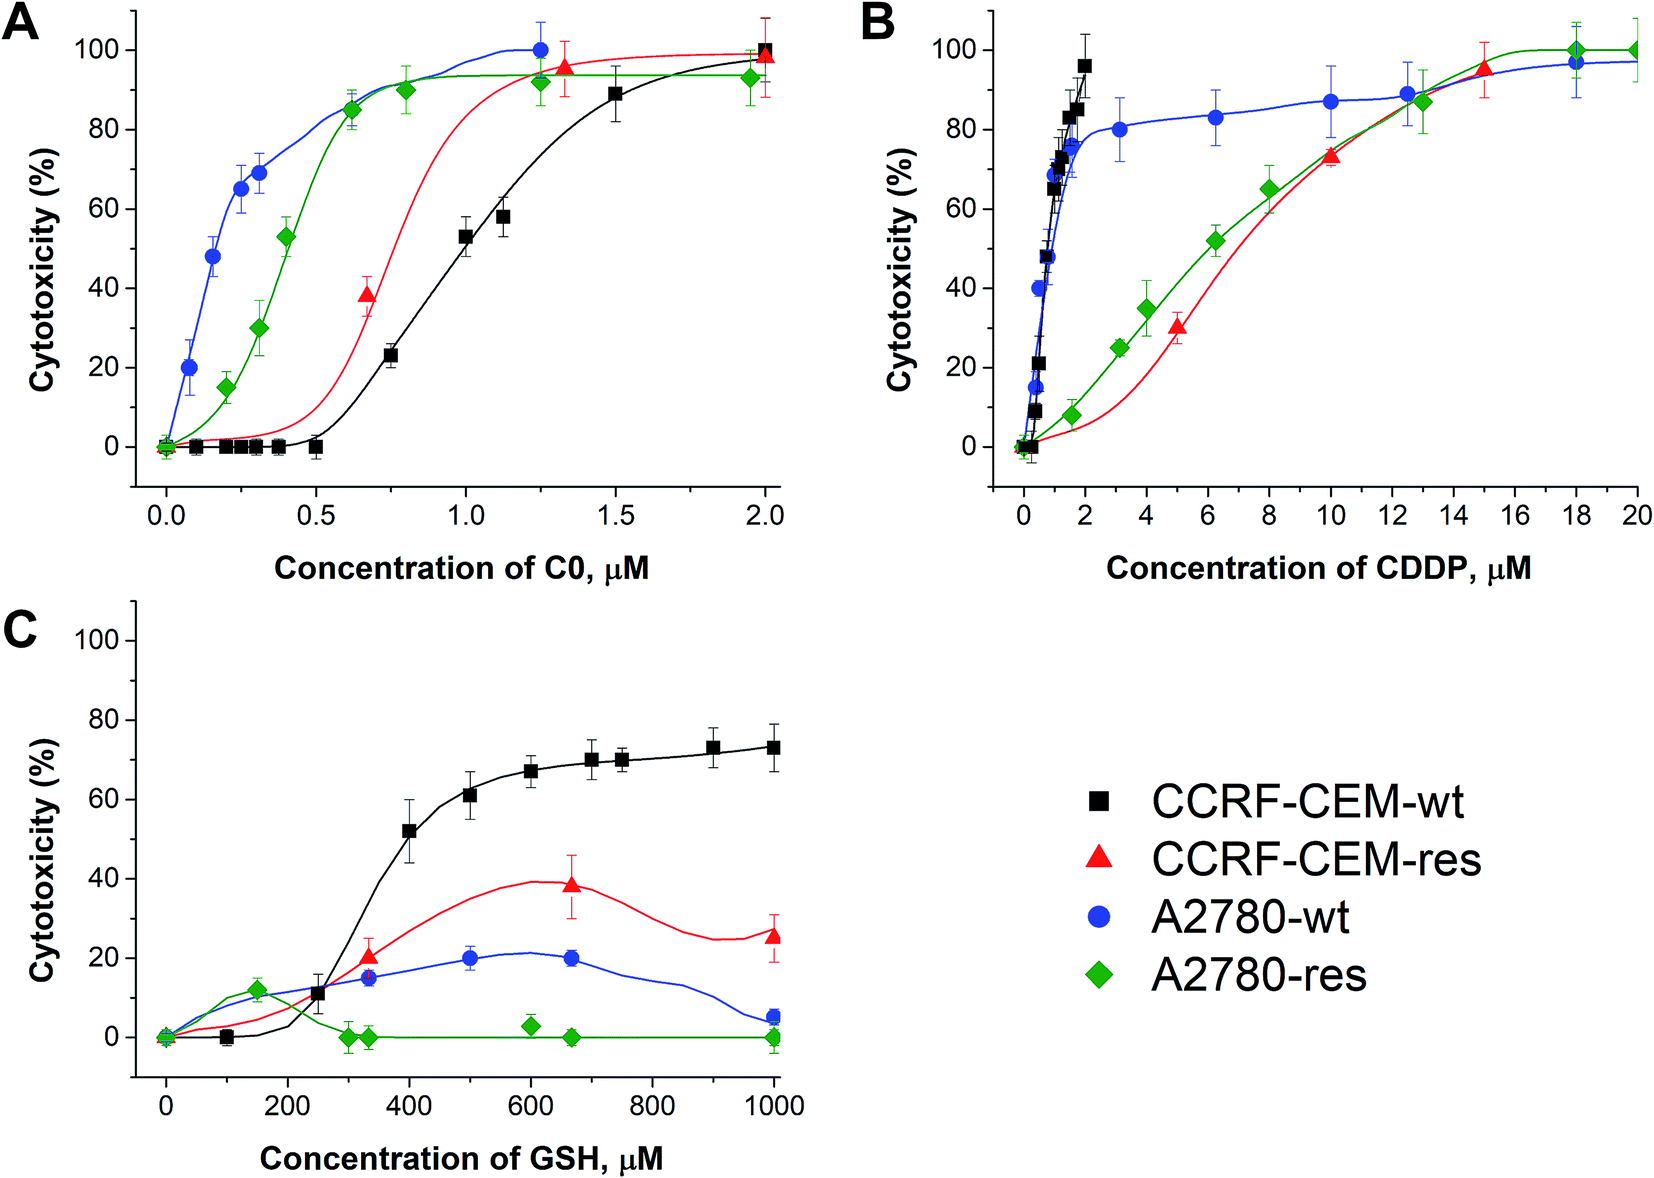 | ||
| Fig. 2 Dose–response curves of C0 (A), CDDP (B), and GSH (C) calculated by the network (line) and experimental points against wild type and cisplatin-resistant CCRF-CEM and A2780 cell lines. | ||
| CC50, μM | ||||
|---|---|---|---|---|
| Compound | CCRF-CEM-wt | CCRF-CEM-res | A2780-wt | A2780-res |
| C0 | 0.97 ± 0.02 | 0.76 ± 0.01 | 0.15 ± 0.01 | 0.37 ± 0.03 |
| CDDP | 0.71 ± 0.02 | 6.51 ± 0.05 | 0.90 ± 0.02 | 5.90 ± 0.05 |
| GSH | ≥400 | ≥400 | n.d. | n.d. |
As can be seen in Fig. 2 and Table 1, CDDP was active against both wild type leukaemia CCRF-CEM and ovarian carcinoma A2780 cell lines with a comparable potency, while it was less active against their CDDP-resistant cell counterparts. C0 was active against all cell lines tested, but showed the highest activity against A2780 cells; GSH displayed a moderate activity against CCRF-CEM cells. It should not be surprising that GSH showed some cytotoxicity; in fact, although most studies showed that GSH is an anti-apoptotic agent, it was also reported to exert cytotoxic activities towards cancer cell lines by inducing DNA fragmentation33 or by interfering with the cellular progression stage.34 As observed by Balendiran,35 with respect to cancer, GSH metabolism is able to play both protective and pathogenic roles and, as a matter of fact, different chemotherapy responses in normal versus tumour cells were obtained, providing a possible GSH-based strategy for the protection of normal cells.36 In summary, the role of GSH in cancer is complex and its behaviour depends on several factors, including the polymorphisms of the type of cancer and the individual GSH homeostatic regulation and needs of each patient.
Binary mixtures
The plot of cytotoxicity (% values) as a function of the drug concentrations for the 1600 virtual combinations defines the response surface. For the wild type and CDDP-resistant CCRF-CEM cells, the response surfaces are shown in Fig. 3 and the results relative to the A2780 cell lines are reported in the ESI (Fig. S4).† The experimental data (grey cubes) are superimposed on the calculated surfaces to show whether there is agreement between estimated and measured values.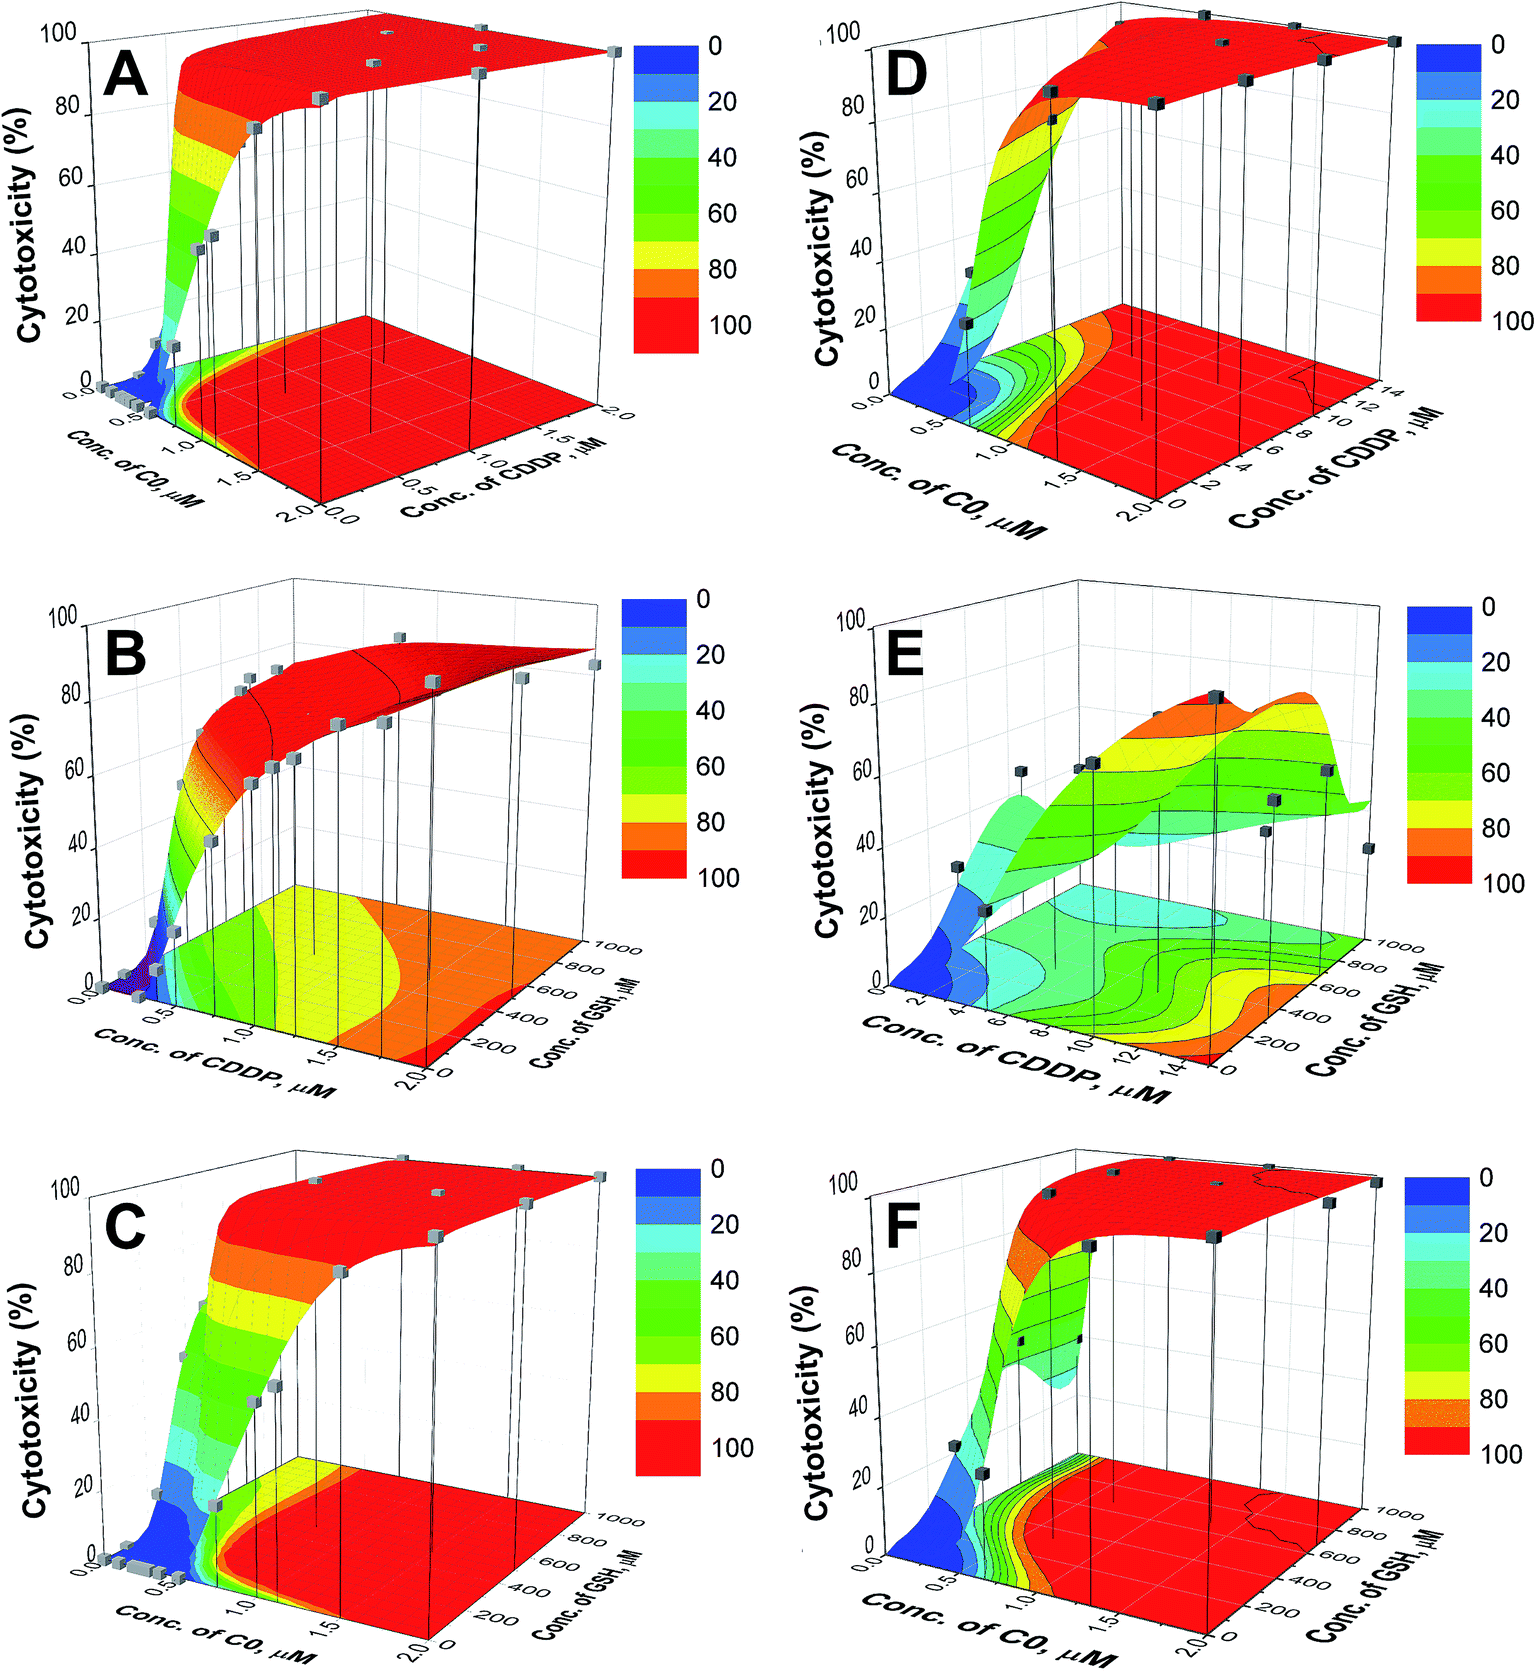 | ||
| Fig. 3 Response surfaces for C0–CDDP (A and D), CDDP–GSH (B and E) and C0–GSH (C and F) for CCRF-CEM-wt (left) and CCRF-CEM-res (right) cell lines. The experimental points (■) are superimposed to the surfaces. The contour plots of cytotoxicity iso-values are shown in the bottom planes. | ||
As can be seen in Fig. 3 and S4,† the cytotoxic effect increases with the concentrations of the two drugs, with a trend resembling that of a dose–response curve. The analysis of the surfaces indicates that: (i) the mixture C0–CDDP acts in a similar way on wild type and cisplatin resistant cells (Fig. 3A, D, S4A and S4D†); (ii) when CDDP is in the presence of GSH, its cytotoxicity decreases, and higher doses are required to reach the same extent of mortality; this is particularly evident in the CDDP-resistant cells in which to obtain ≈ 50% toxicity doses of CDDP ≥ 10 μM are required, compared to a CC50 of CDDP alone of 6.51 μM (Fig. 3B, E, S4B and S4E); and, by contrast (iii) the presence of GSH increases the cytotoxicity of C0. In the contour plots, reported on the bottom planes of the surfaces, the areas of cytotoxic iso-values can be explored to choose the combinations with the desired level of cytotoxicity to identify the corresponding dose of each drug. Selected examples of binary combinations that exert a 50% cytotoxicity are reported in Table 2.
| CC50, μM | ||||
|---|---|---|---|---|
| Compound | CCRF-CEM-wt | CCRF-CEM-res | A2780-wt | A2780-res |
| C0 + CDDP | 0.26 + 0.40 | 0.50 + 5; 0.75 + 2 | 0.075 + 2.5 | 0.26 + 6.41 |
| CDDP + GSH | 0.32 + 200 | 10 + 300 | 7.0 + 400 | 5.3 + 50; 12 + 350; 21 + 900 |
| C0 + GSH | 0.42 + 200 | 0.35 + 300 | 0.10 + 300 | 0.26 + 200 |
To better understand if the drugs act synergistically, the surfaces calculated by the NMDEI for the binary combinations of C0–CDDP, C0–GSH and CDDP–GSH in the CCRF-CEM cells, are reported in Fig. 4. The results for the A2780 cells are reported in the ESI (Fig. S5).†
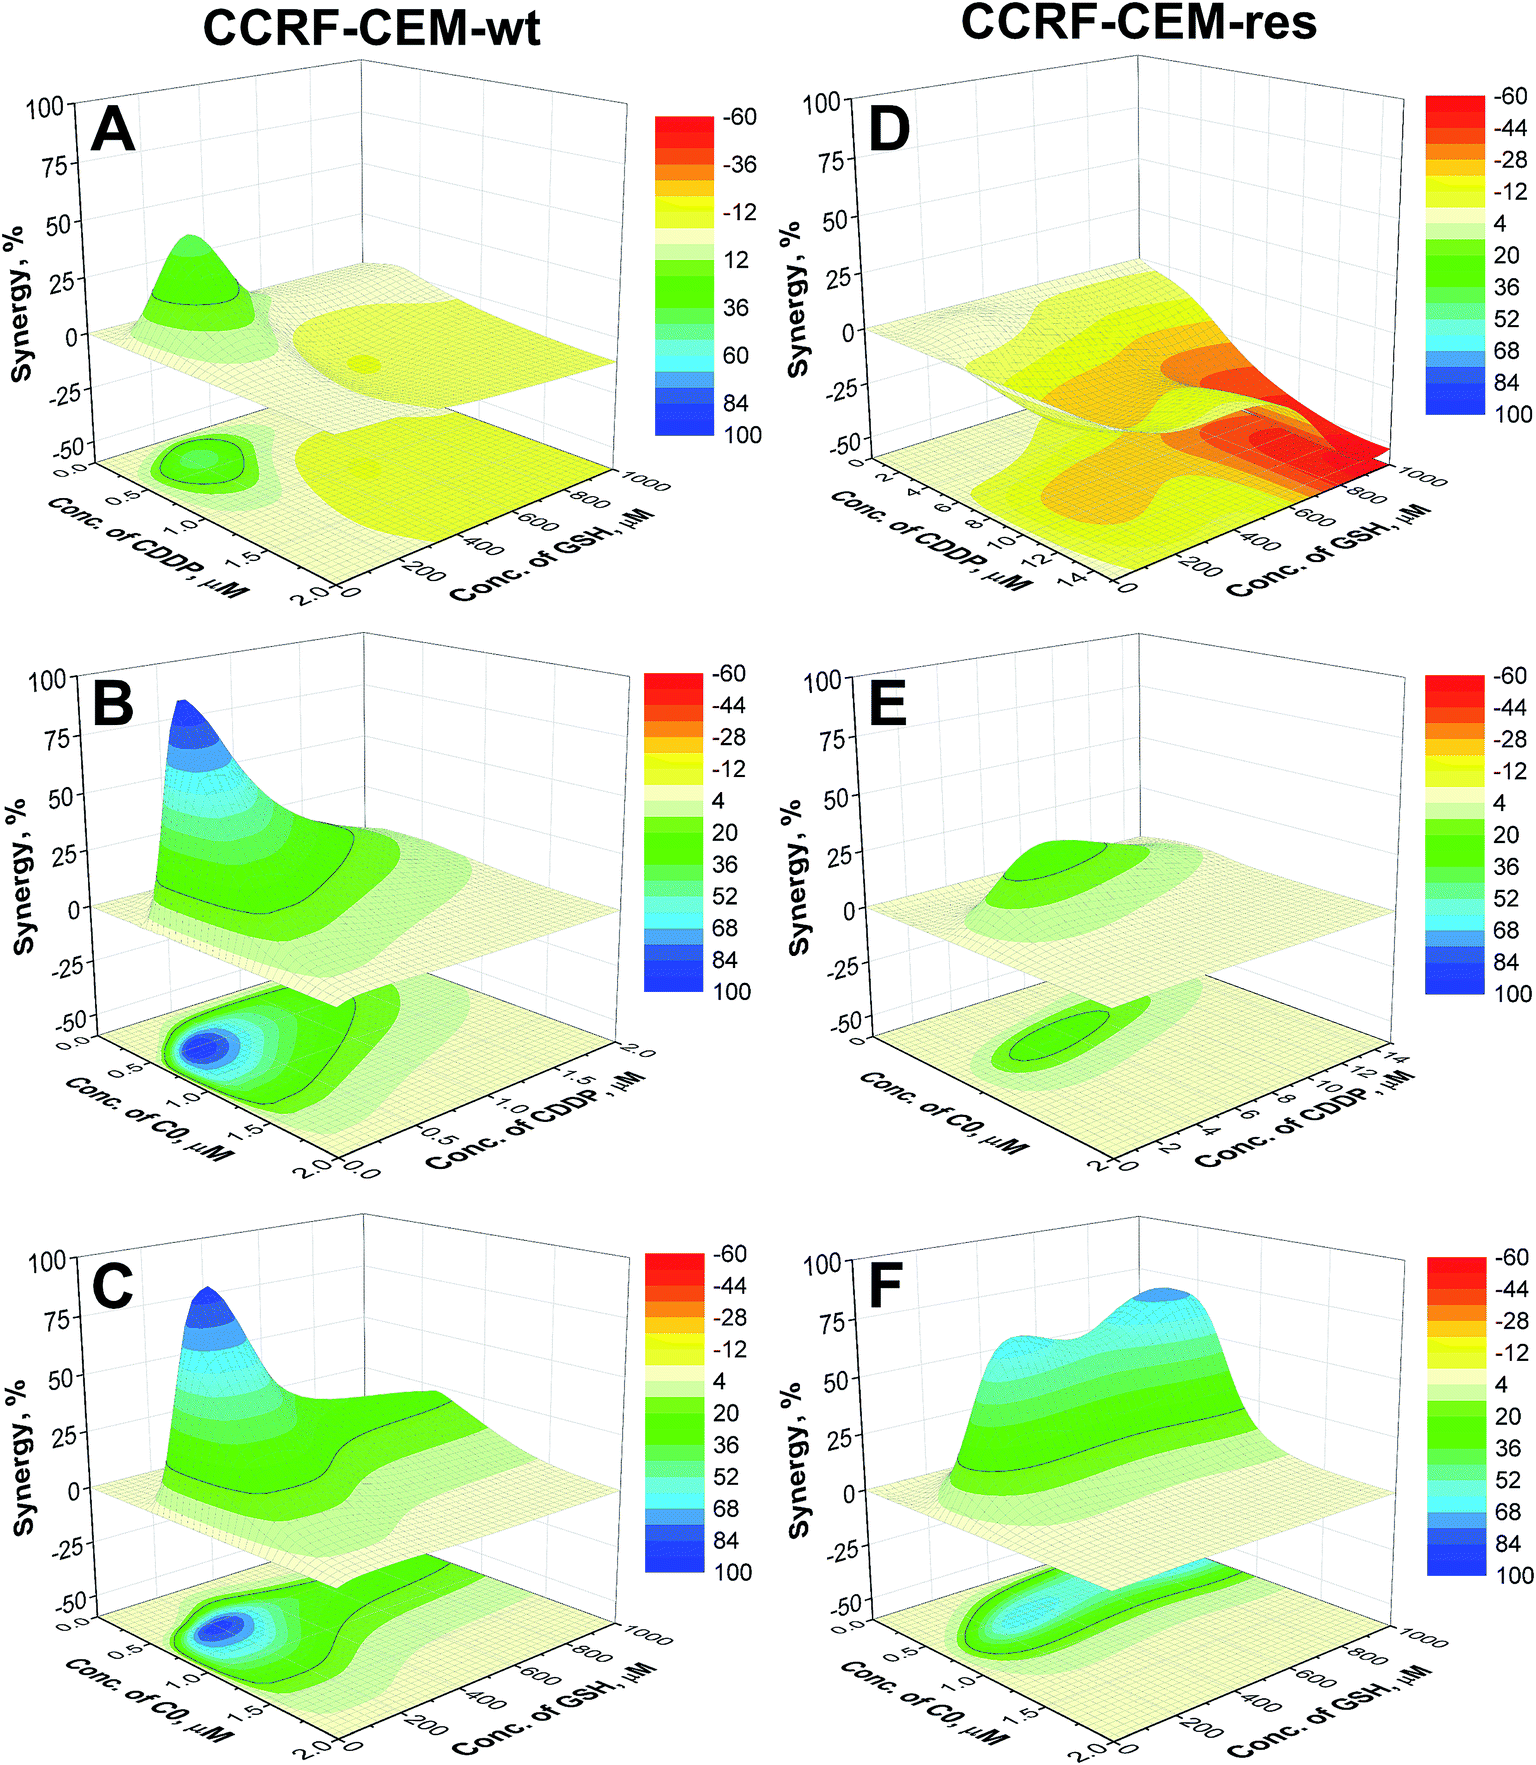 | ||
| Fig. 4 Synergistic surfaces for the binary systems CDDP–GSH (A and D), C0–CDDP (B and E) and C0–GSH (C and F) in CCRF-CEM-wt (left) and CCRF-CEM-res (right) cell lines (red, white and blue colors indicate antagonistic, additive and synergistic drug interactions, respectively). | ||
Analysing the surfaces reported in Fig. 4, and recalling that NMDEI assumes positive values for synergistic effects, zero values for additive effects and negative values for antagonistic effects, it is possible to observe that:
CDDP–GSH. The plot of NMDEI as a function of CDDP and GSH concentrations (Fig. 4A) reveals a wide area of negative values in the range CDDP ≥ 0.76 μM and GSH ≥ 384 μM, indicating antagonistic CDDP–GSH interactions. This is more relevant in the CDDP-resistant cells (Fig. 4D), and particularly at high GSH concentrations. In fact, a combination of 15 μM CDDP and 950 μM GSH shows a 42% mortality (NMDEI is −53.34), whereas at the same concentrations in single drug treatments, the two drugs induce cell death by up to 94.4% and 24.9%, respectively (Fig. 3E).
CDDP–C0. The synergistic effect of C0 in combination with CDDP (Fig. 4B) in the wild type cell population is evidenced by a wide positive area, with a maximum NMDEI of 91.9% at 0.34 μM CDDP and 0.54 μM C0. This combination shows a cytotoxicity of 96.7%, while the two compounds used alone at the same concentrations of the combination, showed mortality values of only 3% and 6%, respectively. No negative values were observed. The synergism between the two drugs is revealed also in the CDDP-resistant counterpart (Fig. 4E) by a wide positive area with a peak at 0.74 μM C0 and 4.74 μM CDDP (NMDEI is +28%). This combination shows mortality of 87.8%, while the two drugs used alone show cytotoxicity values of 45.5% and 25.7%, respectively (Fig. 3D).
C0–GSH. C0 revealed synergistic activity (Fig. 4C) also in combination with GSH towards wild type cells, with a maximum (NMDEI +82%; mortality 98%) at 0.60 μM C0 and 220 μM GSH. At these concentrations, the two drugs, used alone, showed mortality values of 8% and 6% respectively. The synergistic effect is exerted also on resistant cells (Fig. 4F) with two maxima of activity: the first at 0.42 μM C0 and 900 μM GSH (NMDEI +70.9%) and the second at 0.53 μM C0 and 350 μM GSH (NMDEI +64.9%). This latter drug combination exhibits a cytotoxicity value of 95.6%, while the two drugs used alone at the same concentrations showed a cytotoxicity of only 10.8% and 21.8%, respectively (Fig. 3F).
Ternary mixtures
For the evaluation of the three-drug system, a cubic surface was built up. The X, Y and Z axes indicate the concentrations of the three different drugs, while NMDEIs were represented by red, white, and blue coloured points indicating antagonistic, additive, and synergistic effects, respectively. In the reported surfaces (Fig. 5), the concentration of C0 varies along the Z axis giving visual evidence of its influence on the cytotoxicity of CDDP–GSH mixtures both against wild type and CDDP-resistant CCRF-CEM and A2780 cell lines. To facilitate the readability of the results, only 6 planes, representing six different concentrations of C0, are presented.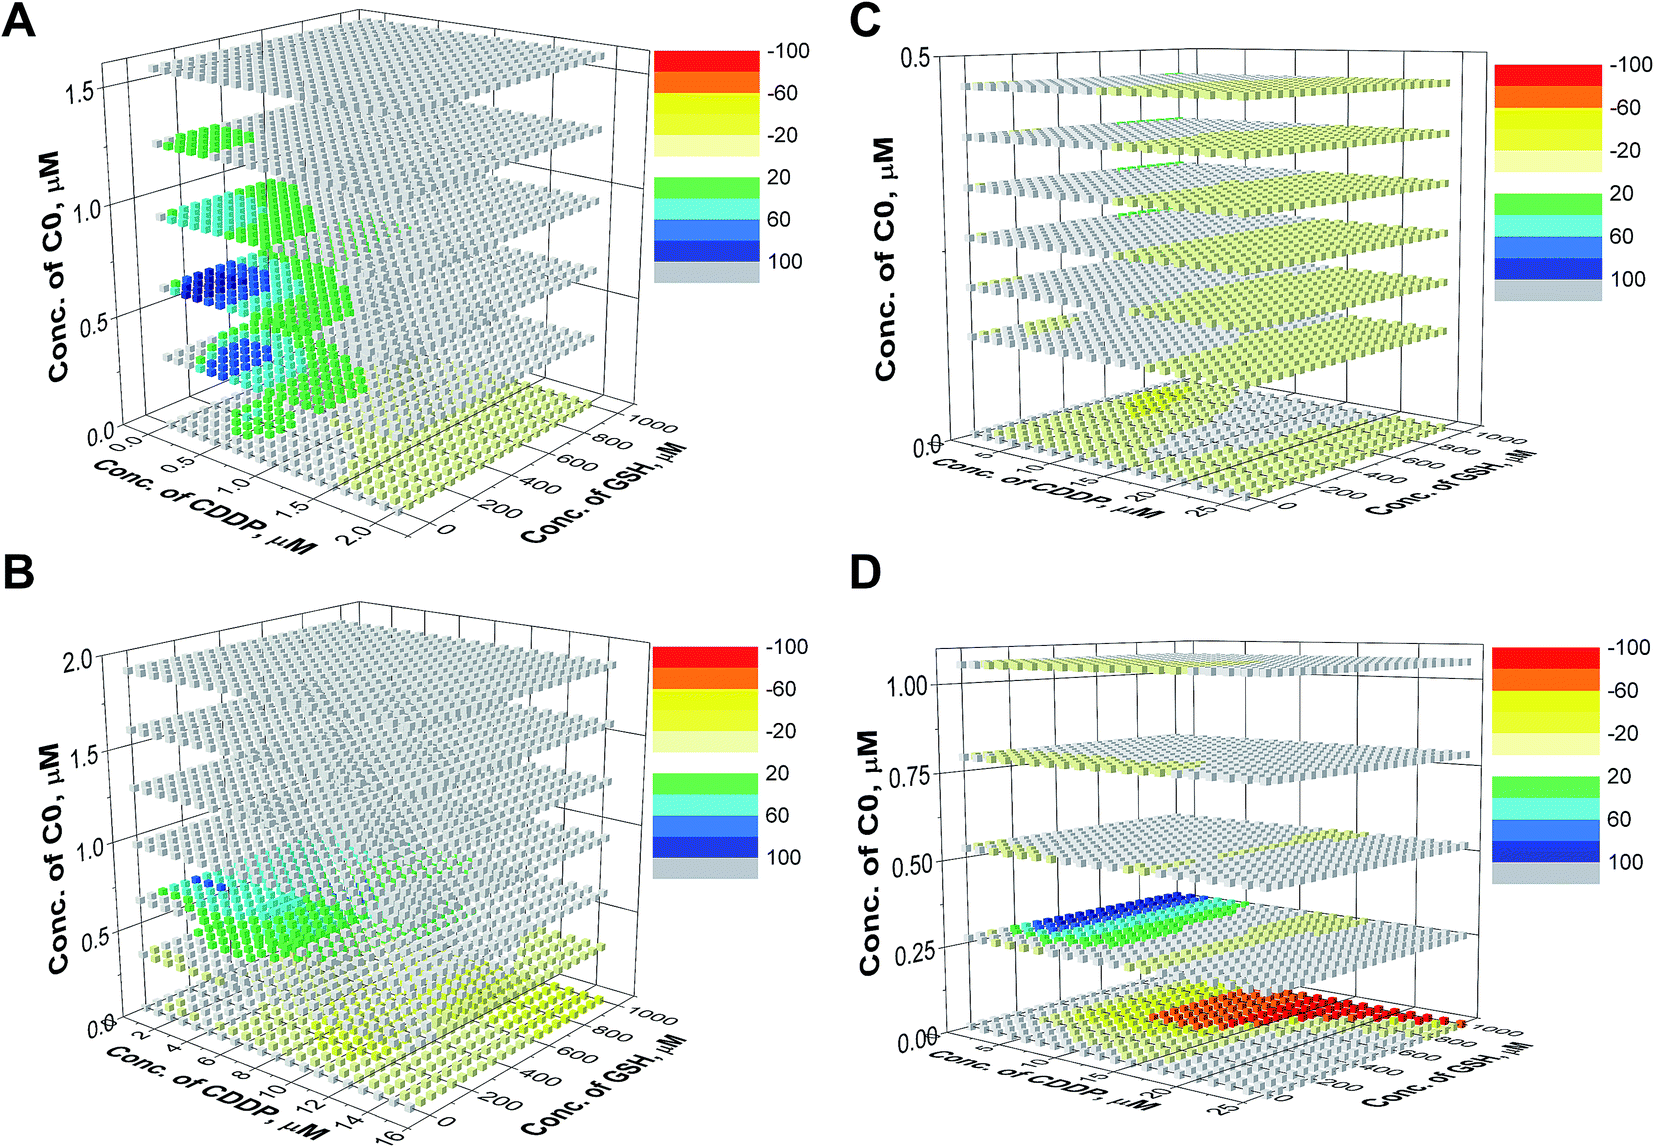 | ||
| Fig. 5 Synergistic surfaces for the ternary system CDDP–GSH–C0 in (A) CCRF-CEM-wt, (B) CCRF-CEM-res, (C) A2780-wt and (D) A2780-res cell line. Red, white, and blue colors indicate antagonistic, additive, and synergistic effects, respectively. | ||
As can be seen in Fig. 5, in the absence of C0 (bottom plane), the antagonistic effect of GSH on CDDP was the rule, especially at high GSH doses (yellow and red cubes). However, when cells were exposed to CDDP and GSH in the presence of concentrations of C0 higher than ≈0.25 μM, the antagonism exerted by GSH on the CDDP activity disappeared (white cubes) and, at a number of specific dose-combinations, synergistic effects were revealed (green and blue cubes).
To better evidence the reverting effect of C0 against the antagonism of GSH on CDDP, the cytotoxic activity of (i) CDDP alone, (ii) CDDP in binary combination with 300 μM GSH, and (iii) CDDP in ternary combination with 300 μM GSH and 0.30 or 0.25 μM of C0, is reported in Fig. 6 for both resistant cell lines. As can be seen, in the presence of GSH alone, the potency of CDDP decreased (compare the black and red lines), but if C0 was present, the full cytotoxic CDDP potential was restored, or increased (blue lines), particularly at low CDDP concentrations. Nevertheless, it has to be noted that it is not appropriate to consider the most synergistic combination as the optimal one, since the choice may depend on several factors, such as the individual tolerated concentration of CDDP and/or the individual concentration of endogenous GSH.
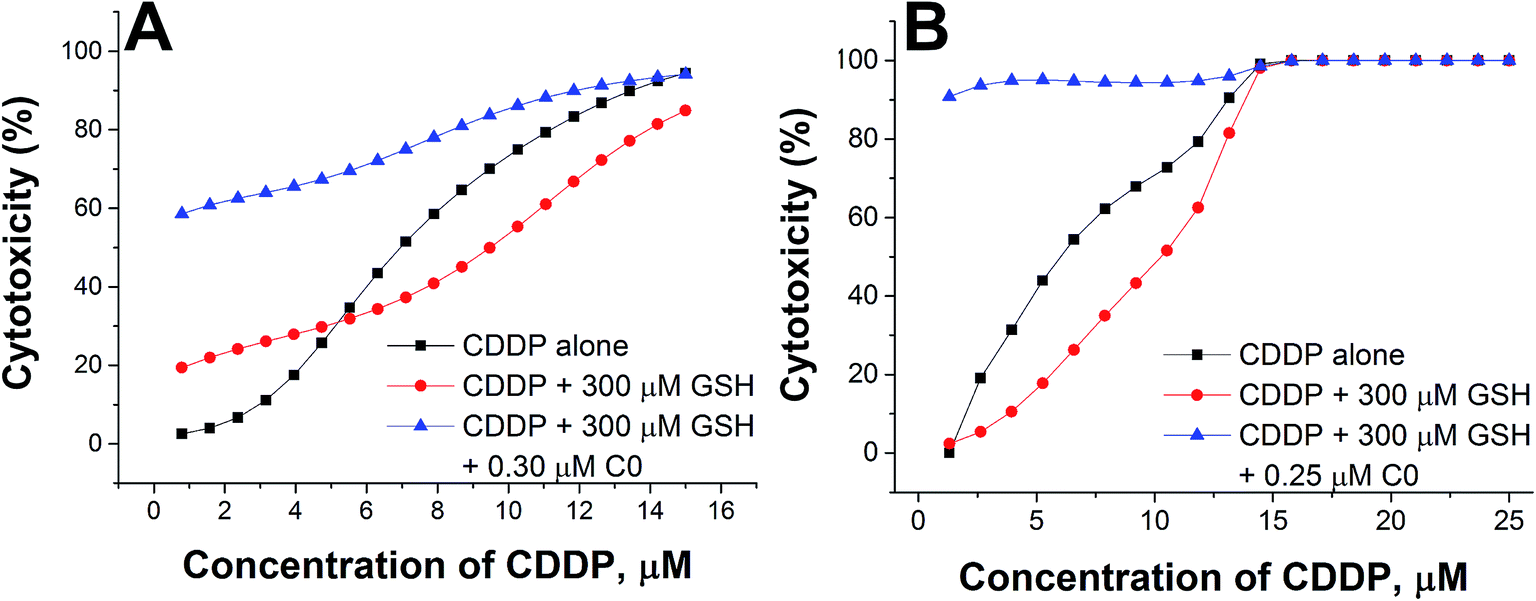 | ||
| Fig. 6 Cytotoxic activity of CDDP alone, in binary combination with GSH, or in ternary combination with GSH and C0 in CCRF-CEM-res (A) and A2780-res (B) cells. | ||
Check of the ED–ANN results
To check the reliability of the proposed approach (ED and ANN), the predicted drug-combinations giving the most relevant effects were prepared and experimentally evaluated. The biological activity predicted by the network was confirmed, and the most powerful combinations were used for the successive experiments.Cytotoxicity of drug cocktails in ex vivo normal human PBLs
The strong synergism shown by CDDP–C0–GSH combinations against the T-leukaemia CCRF-CEM cells, which also holds in the CDDP-resistant subline (CCRF-CEM-res), prompted us to determine the effect of the ternary drug combination against ex vivo normal peripheral lymphocytes, the natural control cells for leukaemia cells, so as to have a faithful estimate of the selectivity of action of these drug-cocktails. To this end, human peripheral blood lymphocytes (PBLs) freshly isolated from blood samples of healthy donors were seeded as such (i.e. resting PBLs), in the presence of the mitogen PHA (i.e. PHA-activated PBLs), or in the presence of both PHA and Interleukin-2 (i.e. PHA/IL2-stimulated PBLs). Each culture was then incubated in the presence of the most synergistic three-drug combination against CCRF-CEM-wt cells; i.e. 0.5 μM CDDP, 0.5 μM C0, and 300 μM GSH. Duplicate PBL cultures were incubated in the presence of each drug alone at the same concentration used in the combination. For comparative purposes, cultures of CCRF-CEM were run under the same experimental conditions. The number of viable cells was determined after 24, 48 and 72 h of incubation by the trypan blue exclusion method. Data were reported as percentages of untreated controls (Fig. 7). The PBL values in Fig. 7 are the mean data of independent experiments performed with PBLs isolated from three different donors. In Fig. 8, growth curves and viable cell counts of untreated vs. drug treated PBLs isolated from one single donor are shown.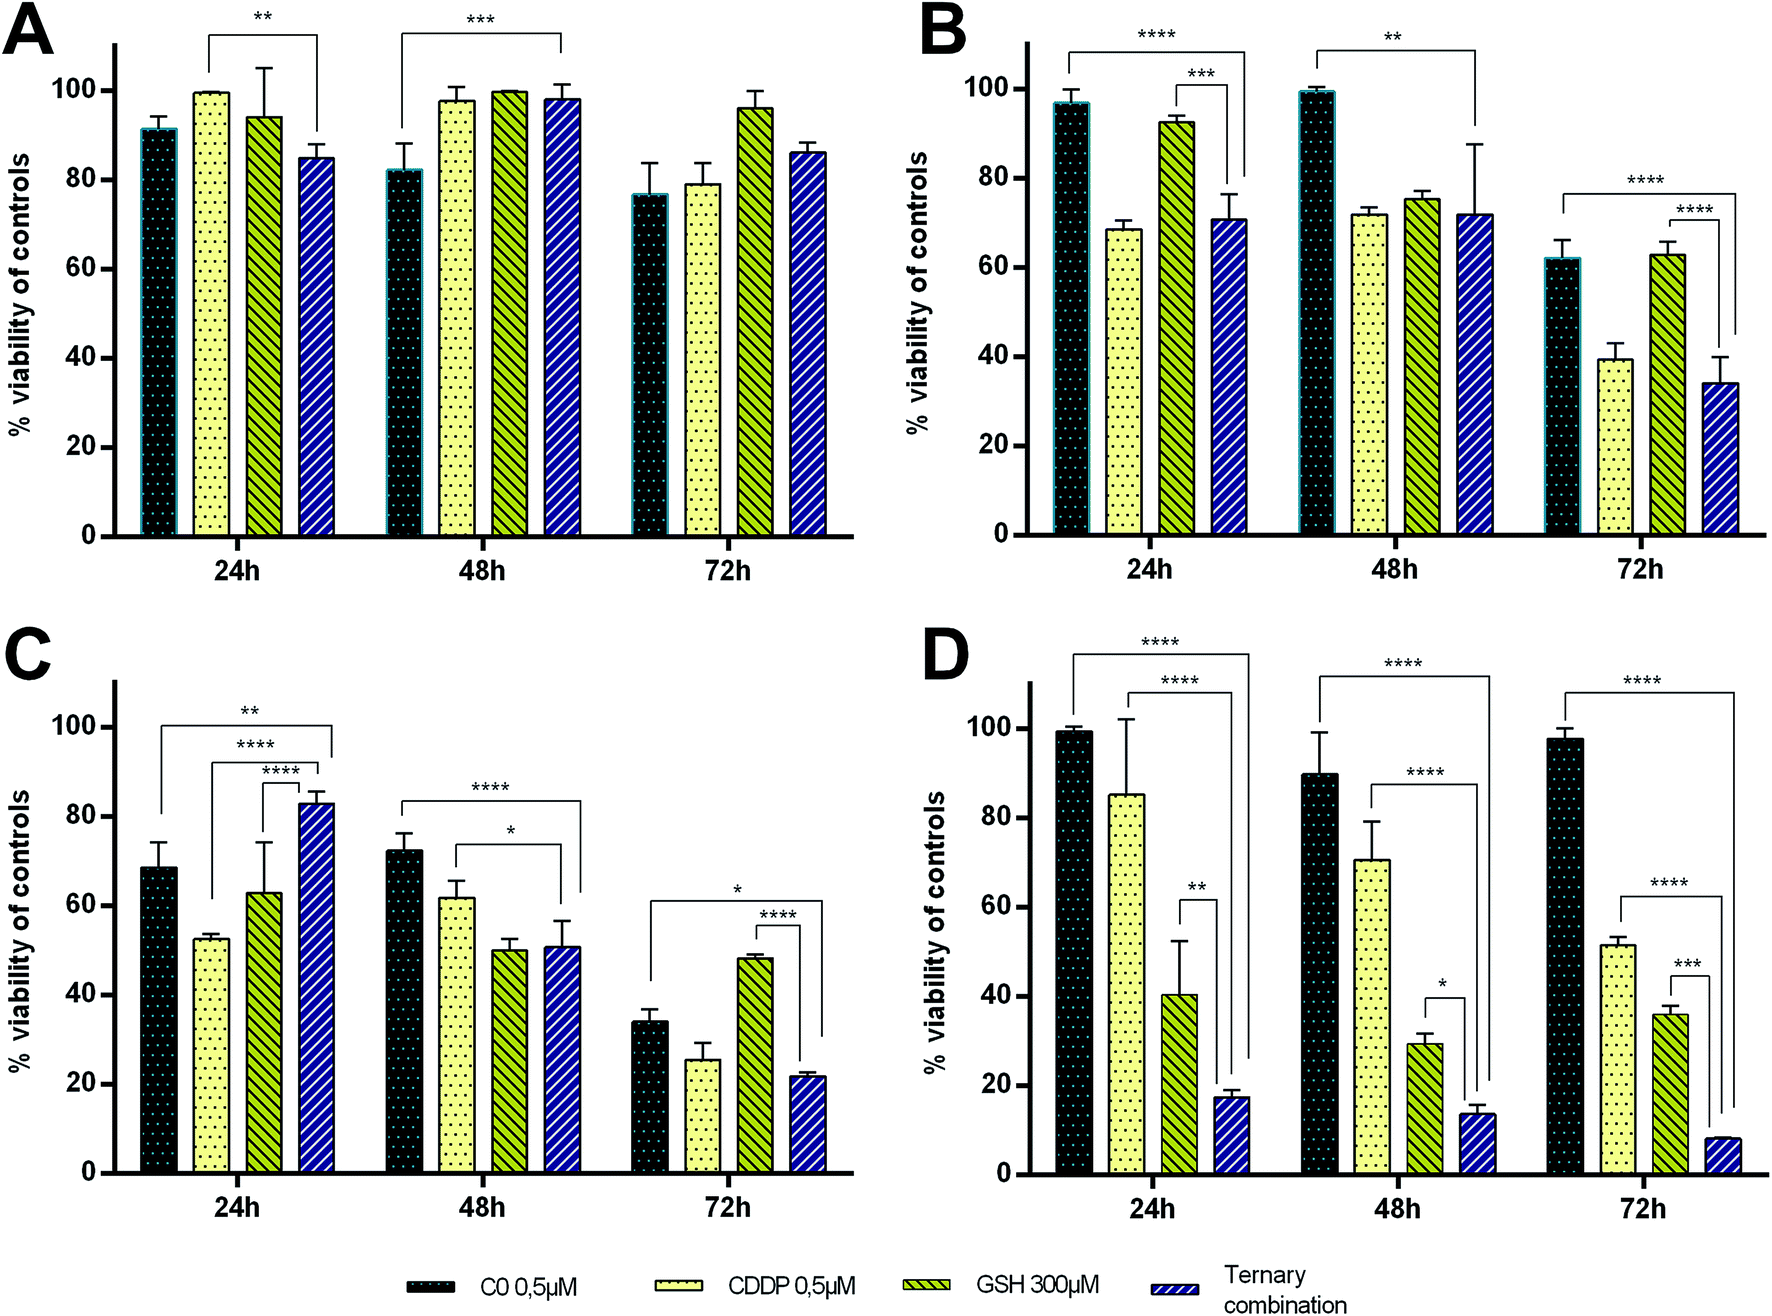 | ||
| Fig. 7 Cytotoxic activity of C0, CDDP and GSH, alone and in ternary combination against PBLS and CCRF-CEM cultures after 24, 48 and 72 h of drug treatment. (A) Resting PBLs, (B) PHA-stimulated PBLs, (C) PHA + IL2-stimulated PBLs, (D) CCRF-CEM-wt. Values obtained in drug-treated samples were expressed as percentages of their respective controls. | ||
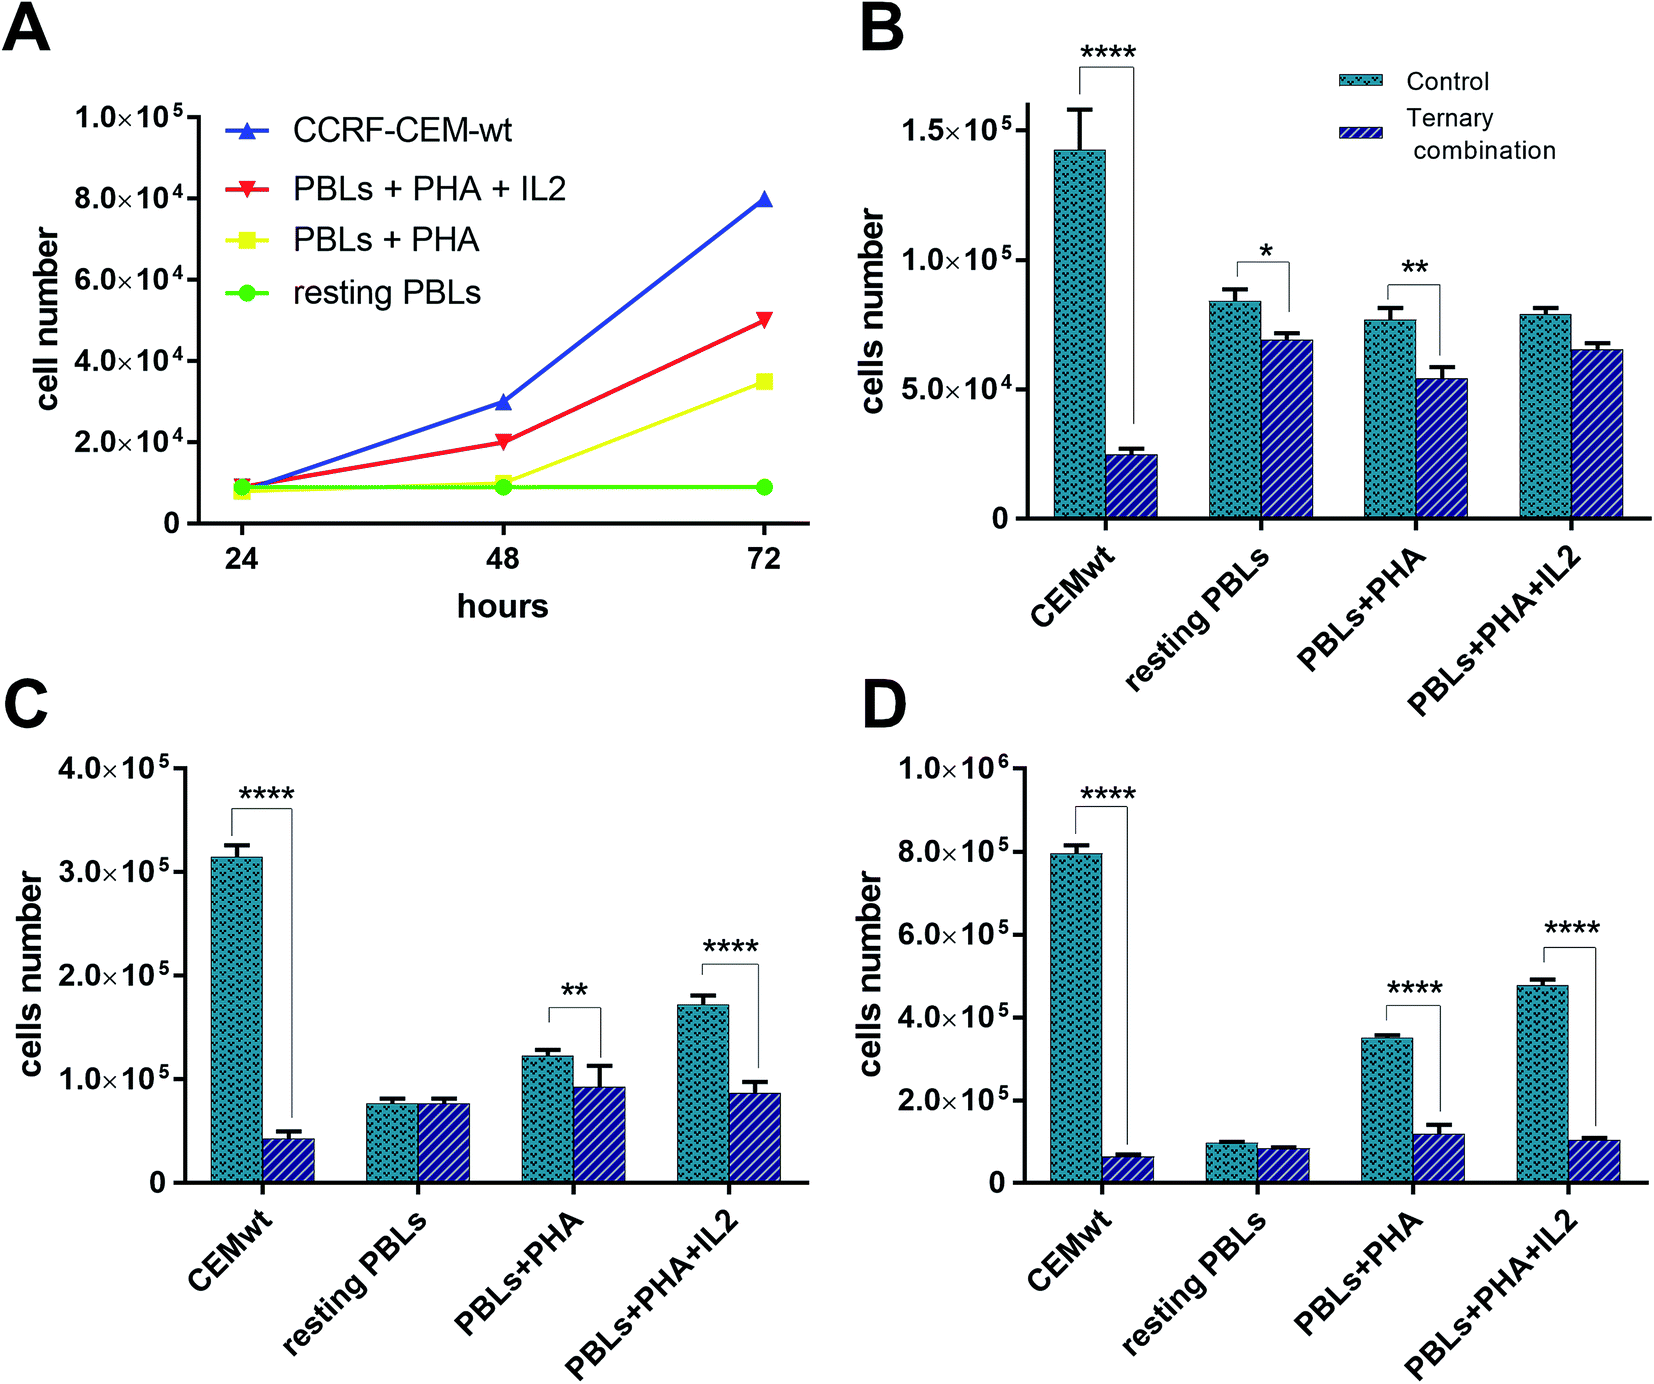 | ||
| Fig. 8 Growth curves and viable cell number counts of untreated vs. combination-treated CCRF-CEM and PBL cell cultures. (A) Growth curves of CCRF-CEM-wt cells and PBLs. Numbers of viable cell in untreated vs. ternary combination-treated CCRF-CEM-wt cells and PBLs after 24 h (B), 48 h (C), and 72 h (D). | ||
Single-drug treatments with 0.5 μM CDDP showed a cytotoxic effect increasing over time only against CCRF-CEM cells and active/proliferating cell cultures (i.e. PHA-activated and PHA/IL2-stimulated PBLs), while, as expected, it had only negligible effects against non-activated/non-proliferating cells (i.e. resting-PBLs). After 72 h of incubation, the degree of cytotoxicity of CDDP was comparable in PBLs and CCRF-CEM cells, with an average of 60–70% cell viability, with respect to untreated controls. In the PBL cultures, however, CDDP led to cell death earlier (i.e. at 24 h in PHA/IL2-stimulated; at 48 h in PHA-activated) than in the CCRF-CEM cultures, with viable CCRF-CEM cells still being over 80% of controls at 24 h, and over 70% at 48 h. The cytotoxic effect of 0.5 μM C0 in PBLs seemed to better correlate with the activation stage of the cells; the viability of PHA/IL2-stimulated PBLs was reduced by 30% already after 24 h, while that of the PHA-activated PBLs by 25–30% only after 48 h. In contrast to CDDP, C0 seemed to affect the viability also of the resting PBLs as a slight toxic effect, i.e. from 10% to 20% cytotoxic effects were observed in each PBL preparation from the three different donors. Nonetheless, in CCRF-CEM cells the cytotoxicity of C0 appeared to be even lower, if any, than in the resting PBLs: the viability of treated CCRF-CEM cells being over 90% of controls at all time points considered.
GSH-treatments (300 μM) appeared to be more toxic in CCRF-CEM cells than in PBLs and, among the latter, the PHA/IL2-stimulated PBLs were affected the most, followed by the PHA-activated PBLs, whereas resting PBLs were not affected at all. Although the GSH cytotoxicity was slightly greater against CEM cells (60–70% mortality) than against PHA/IL2-stimulated PBLs (50% mortality), in both cell types the maximum effect was reached after 48 h of exposure to GSH. Compared to single-drug treatments, in CCRF-CEM cells the drug cocktail confirmed a strong synergistic effect with a mortality of over 80% already at 24 h, further increasing with time. As for the PBLs, the PHA/IL2-stimulated PBLs were the most sensitive of all to the toxic effect of the drug combination, that was, however, both less potent and more delayed with respect to that exerted against CCRF-CEM cells; i.e. a maximum of only 50% mortality after 48 h. The toxic effect against the PHA-activated PBLs was even slower than that shown in the PHA/IL2-stimulated PBLs; i.e. 20–30% mortality at the first two time points, and comparable only after 72 h. The drug cocktail was totally devoid of cytotoxicity on the resting PBLs at any time points considered. Moreover, if we consider the effects of the drug combination vs. single-drug treatments in the PBLs, the drug cocktail always showed a degree of cytotoxicity comparable to that of the CDDP alone, whereas in the CCRF-CEM cells the toxic effect of the combination was 7-fold greater than that of CDDP alone. Taken together, these findings are very promising since the ternary combination showed a clear selective cytotoxic effect for T-leukaemia cells. In addition to the higher activity against leukaemia CEM cells (8% residual viability after 72 h) compared to PHA/IL2-stimulated PBLs (50% viability at 72 h), the effect of the drug combination against CCRF-CEM cells appeared to be also exceptional: i.e. only 17% viability left after 24 h, compared to the 80% of the proliferating PBLs at the same time point.
Multi-drug resistance (MDR) activity
To establish whether the CDDP-resistance of CCRF-CEM res and A2780 res sublines was due to the selection of MDR cell populations, the potential overexpression of drug-efflux pumps, MDR1/P-gp and MRP1, was investigated in drug-resistant cell lines and compared to that parental by a specific MDR fluorimetric kit. However, no significant decrease (≤10% variation) in RFU values of the CDDP-resistant vs. the wild type cells was detected (Fig. 9), thus indicating that a MDR phenotype was not the major mechanism of CDDP resistance.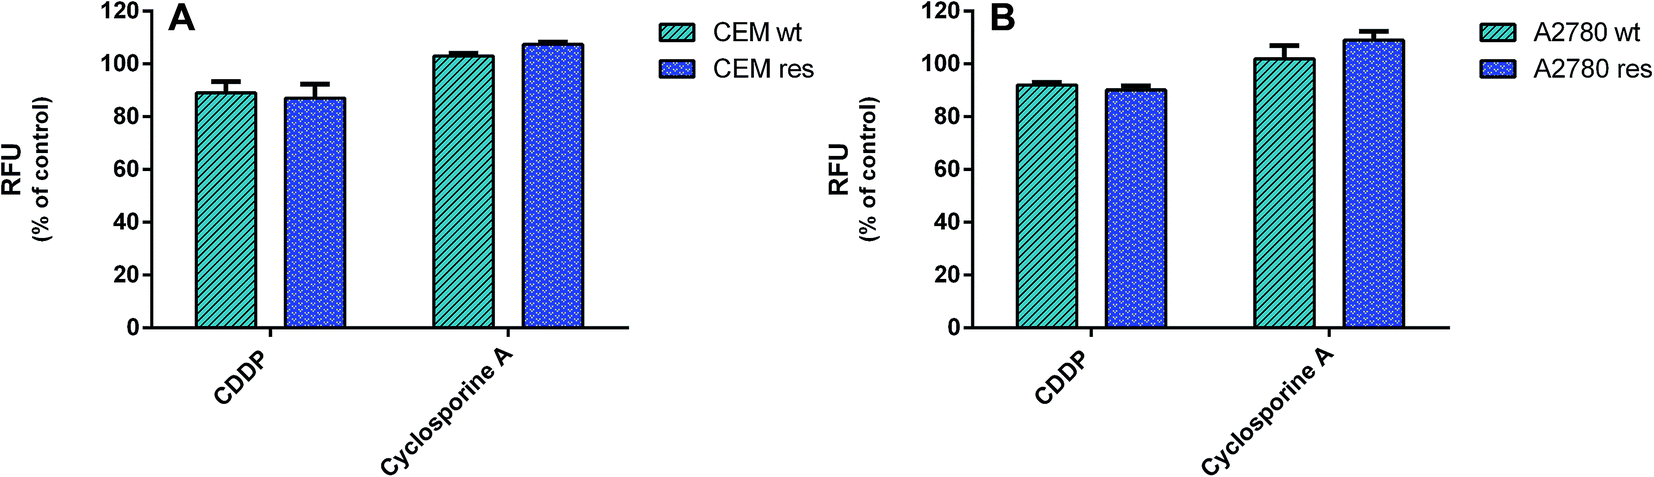 | ||
| Fig. 9 Multi-drug resistance (MDR) activity. The activity of drug-efflux proteins MDR1/P-gp and MRP1 in wild type and CDDP-resistant ccrf-cem and A2780 cells was determined by a fluorimetric MDR assay kit (Abcam). Intracellular fluorescence was determined in 2 × 10⁶ cells per well after 1 h of incubation. Data are representative of three independent experiments and are expressed as % of untreated cells ± SD. (A) CCRF-CEM wt treated with 0.5 μm CDDP and CCRF-CEM res treated with CDDP 2.5 μm. (B) A2780 wt treated with CDDP 0.5 μm and A2780 res treated with CDDP 2 μm. | ||
Apoptosis induction by ternary drug combination in A2780 cells
To determine whether the strong synergistic effect of the drug combinations was due to a massive induction of apoptosis, A2780 cells were exposed to CDDP, C0 and GSH, alone or in combination one another. Moreover, early and late apoptosis events were determined at different time points by the Alexa Fluor 488 Annexin V and PI staining method, which allows an excellent differentiation between early and late apoptotic cells.37 Cells were scored as early apoptotic or late apoptotic based on Annexin V-positive staining only, or both Annexin V and PI positivity, respectively. Conversely, viable cells were scored by the absence of Annexin V binding associated to propidium uptake.As shown (Fig. 10), in single treatments both C0 and CDDP induced apoptosis in A2780-res cells. After 20 hours of treatment, C0-treated cells (Fig. 10B) were Annexin V-positive and Annexin V-PI-positive, indicating cells in both early and late apoptosis. As expected, CDDP, known to induce apoptosis in several normal and tumour cells via the formation of platinum-DNA adducts,11–14 induced apoptosis also in the A2780-res cells (Fig. 10C). However, at the same time point, in contrast to C0-treated cells, most apoptotic cells exposed to CDDP were in the late apoptotic phase, showing both Annexin V and PI positive staining. A few cells showed membrane damage and appeared red-stained by the intercalating dye PI. A similar pattern was obtained when cells were co-treated with CDDP and C0 in a dual-drug combination (Fig. 10D); also in this case, in fact, the majority of the apoptotic cell fraction was positive for both stains, indicating late apoptosis. By contrast, at the same time point, when GSH was associated to CDDP and C0 (Fig. 10E) a statistically significant fraction of apoptotic cells appeared to be blocked in the early apoptotic phase. In the three-drug-treated cultures, almost all cells showed an intact cytoplasmic membrane, as indicated by membranes positive for Annexin V associated with the absence of PI staining. After 20 hours of exposure to the ternary drug cocktail (Fig. 9F), the percentage of early apoptotic cells, significantly increased from 9% to 96% (p < 0.001). Similarly, an increased percentage of early apoptotic cells was observed when the cells were treated with C0 alone (from 9% to 80%, p < 0.001). By contrast, the level of apoptosis in the early phase did not significantly change after exposure to CDDP alone or CDDP–C0 co-treatment, while late apoptosis levels significantly increased from 9% to 65% (p < 0.001) and to 60% (p < 0.001), respectively. Similar results were obtained in the parental A2780wt cells (data not shown).
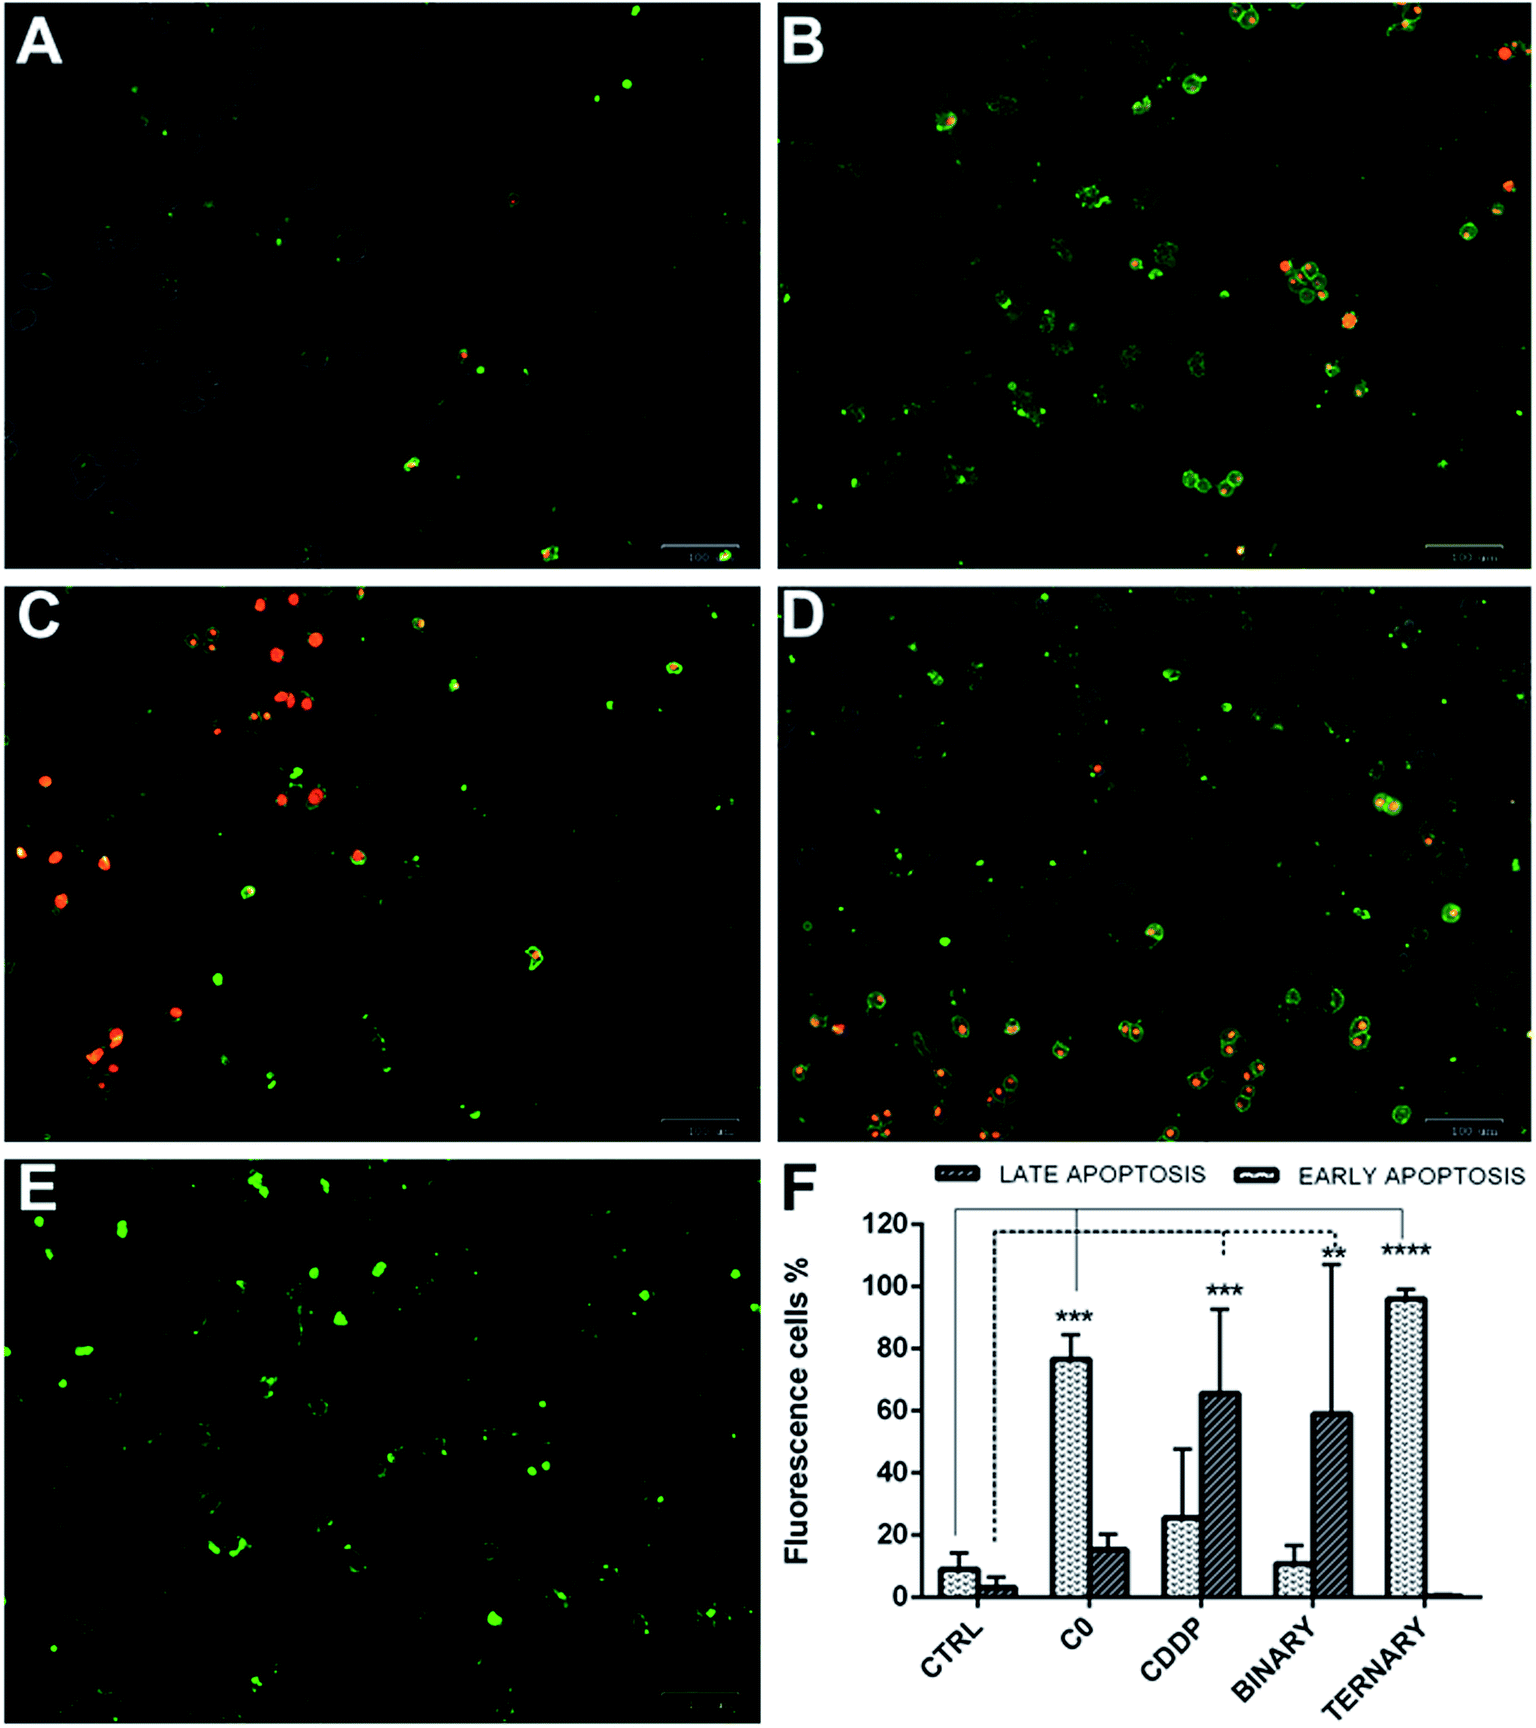 | ||
| Fig. 10 Early and late apoptotic A2780-res cells treated with: C0 and CDDP alone, in dual combination, and in ternary combination with GSH. (A) Untreated controls; (B) cells treated with C0; (C) cells treated with CDDP; (D) cells co-treated with CDDP and C0; and (E) cells treated with the ternary drug combination; (F) percentages of apoptotic A2780-res cells treated with C0, CDDP and GSH, alone, in binary (CDDP + C0), and ternary (CDDP + C0 + GSH) combinations. Values represent the mean ± SD of three independent experiments. Statistical analysis was performed by anova; *p < 0.05; **p < 0.001; ***p < 0.0001. (A–E) Cells were imaged with the ZOE Fluorescent Cell Imager after 20 hours of incubation (A) without drugs, or with (B) C0, 0.2 μm; (C) CDDP, 4.0 μm; (D) C0 and CDDP, 0.2 μm and 4.0 μm; (E) C0 and CDDP and GSH, 0.2 μm; 4.0 μm; 300 μm. Figures (A–E) are merged images of the brightfield, red and green fluorescence channels. Early apoptotic cells were stained by Alexa Fluor 488 Annexin V (green), late apoptotic cells were stained by Annexin V and pi (green-red). | ||
As far as the mode of action of drugs with one another in the binary and ternary combinations are concerned, a number of considerations needs to be drawn. As already mentioned, CDDP is a multi-target agent that interacts with several cellular molecules, therefore, synergistic effects with C0 may arise from interaction of the copper-complex with other molecules and/or processes correlated with one of the different molecular targets of CDDP. Given that C0 can also bind DNA28 by intercalation, and we previously demonstrated38 that copper–platinum complexes can readily be formed by mixing solutions of CDDP and C0 at various drug concentrations, once inside the cell, copper–platinum–DNA adducts may readily add to those of platinum-DNA and copper-DNA. An alternative or probably an additional mechanism of the CDDP–C0 synergism may reside in the inhibitory effect of these two drugs at different levels of the regulatory pathway that in cancer cells activates and maintains glycolysis as the main energetic metabolism also in the presence of oxygen (i.e. the Warburg effect).39 Although a detailed description of this metabolic switch in cancer cells, as well as its significance, complex molecular regulation, is beyond the aim of this study, it is worth mentioning that (i) the Warburg effect is activated by an increased expression of pyruvate kinase (PDK), an enzyme that inhibits the flux of pyruvate into the Krebs' cycle; and (ii) one of the reported cellular targets of CDDP is the synthesis of PDK itself. Besides the metabolic advantages of the Warburg effect, the inhibition of oxidative phosphorylation (OXPHOS) allows cancer cells to reduce ROS generation, and their triggering effect on the p53-mediated apoptotic process. Thus, the synergistic interaction of C0 with CDDP may result from the ability of C0 to target, as has been reported for other copper–phen complexes,40,41 hexokinase (HK), a key enzyme of glycolysis. The C0-induced HK inhibition, combined with the anti-PDK activity of CDDP, may reinforce the flux of pyruvate into the Krebs' cycle that, in turn, leads to increased ROS generation, including in CDDP-resistant cells overexpressing HK. At present, we are not able to identify the main and/or specific target(s) of C0 underlying its toxic mode of action in both wild type and CDDP-res cells, nor that determining its ability to overcome the antagonistic effect of GSH on CDDP. As CDDP, in fact, also C0 has showed to act at various molecular levels, e.g. beside DNA intercalation, redox reactions with GSH (endogenous or exogenous), which also lead to the release of free and active phen molecules26,42 and the likely activation of factor(s) of the apoptotic cascade (this work). Additionally, the copper complexes with two phen molecules have a redox potential higher than the corresponding complexes with only one phen.43
The ability of C0 to overcome the antagonistic effect of GSH on the cytotoxic activity of CDDP fits also with the relative stability of the complexes, previously studied in solutions containing C0, CDDP and GSH, in both binary and ternary combinations.38,42 CDDP was observed to react with the copper complex, as well as with GSH or oxidized glutathione (GSSG); however, in mixtures containing simultaneously CDDP, GSH and C0 or CDDP, GSSG and C0, only the Cu(phen)–GSH or Cu(phen)–GSSG complexes were detected while no platinum-glutathione adducts were found. In summary, although further and finalized experiments to dissect each drug–drug interaction have to be done, the key drug for all the above effects appears to be the copper–phen complex C0, and its interactions with GSH and/or with factors of molecular pathways directly or indirectly involving GSH. As a matter of fact, in the presence of exogenous GSH, the cytotoxicity increase was observed only in cells simultaneously exposed to C0.
Conclusions
The involvement of GSH in the cellular resistance to the CDDP cytotoxic effect was confirmed by our experiments in both leukaemia and ovarian carcinoma derived cell lines. In our cell models, the antagonistic effect of GSH on the cytocide activity of CDDP was particularly evident at GSH concentrations ≥ 500 μM. The simultaneous presence of the copper complex C0 restored the sensitivity of the cells to CDDP, and, at selected concentrations, led to strong synergistic effects. These findings were observed also in CDDP-resistant cell populations.Thanks to the potential of our approach we are able to state that: (i) GSH and CDDP interact mainly antagonistically; (ii) C0 and CDDP interact synergistically; (iii) C0 and GSH interact synergistically; (iv) in the presence of C0, at concentrations ranging from 0.10 μM to 0.20 μM, the antagonistic effect of GSH on CDDP was overcome, and its cytotoxicity fully restored; and (v) the C0–CDDP–GSH system showed synergistic toxic effects, even in the presence of 1000 μM GSH and 0.25 μM ≤ C0 ≤ 0.60 μM.
These outcomes may open a chance to reach maximum therapeutic effects, reduce the frequency of drug-resistant cell mutants and, using lower doses of cisplatin, minimize side effects, by choosing the optimal drug-combination and/or the dose of C0 required to revert GSH-antagonism (according to the modification of the intracellular content of GSH during cycles of chemotherapy of each individual patient, personalized therapy). The synergistic cytocide activity of the three-drug cocktail in the ovarian carcinoma A2780 cell line, especially against the CDDP-resistant subline and the higher cytotoxic potency exerted against leukemic cells with respect to normal lymphocytes are very promising findings. The effect of GSH in binary combinations of CDDP and C0 against two different types of CDDP-resistant cell populations was confirmed and a close in vitro estimation of the overall toxic effect of the three-drug cocktail for bone marrow cells in various stages of activation was obtained. Interestingly, compared to actively proliferating normal lymphocytes (PHA/IL2-PBLs), leukaemia cells were in fact extremely more susceptible to the cytocide effect of the three-drug combination and underwent the dying process(es) much quicker.
When the cells were exposed to dual-drug combinations with CDDP and C0, mainly late apoptotic effects were observed, similar to the effect of CDDP single-drug treatments, suggesting that DNA interactions with C0–cisplatin complexes, and/or metabolism-generated ROS, trigger a process of programmed cell death. On the other hand, the ternary combination induced apoptotic effects similar to that shown by C0 in single drug treatments. One possible explanation is that C0 and CDDP compete for GSH-binding before entering the cells. This could explain why most cells showed early apoptosis. Alternatively, GSH might bind with higher affinity C0 than CDDP, leaving more CDDP free molecules. All things considered, although C0, alone and in combination, induced apoptosis in both early and late phases, GSH in combination with C0 and CDDP clearly triggers a statistically significant apoptotic process(es) through a pathway which do not compromise the integrity of the plasma membrane of cells. In conclusion, studies attempting to unveil the mechanism of the potentiating effect of GSH on the synergistic combination CDDP–C0 and to investigate in mouse models, overall toxicity and antitumor efficacy of the multidrug cocktails, are a possible perspective of the findings reported in this manuscript.
Experimental section
Materials
Acetonitrile, cisplatin (CDDP), copper(II) basic carbonate (Cu2(CO3)(OH)2), dimethyl sulphoxide (DMSO), doxorubicin (doxo), ethanol, ethyl ether, glutathione (GSH), perchloric acid, 1,10-phenanthroline monohydrate, trypan blue, staurosporine and Interleukin 2 were purchased from Sigma-Aldrich (Italy). Foetal bovine serum (FBS), phytohemagglutinin (PHA) and kanamycin sulphate were purchased by Gibco-Invitrogen (Milan, Italy). RPMI 1640 with stable L-glutamine was purchased by EuroClone (Italy). All reagents were used without any further purification. Stock solutions of C0 and Staurosporine were prepared in DMSO, at 1000× the highest concentration to be used on the cell culture and stored at 4 °C in the dark. CDDP stock solution, being stable only for a few hours and showing a decrease in the cytotoxic potency during that time, was prepared fresh immediately before experiments took places. GSH stock solution was prepared in RPMI medium, filtered and used over a few days (the stability of the solution was checked by UV absorbance). The compound C0 was prepared as previously reported.26Cell lines
The human acute T-lymphoblastic leukaemia cell line (CCRF-CEM-wt) was purchased from the American Type Culture Collection (ATCC, USA) whereas the CCRF-CEM subline resistant to 5 μM CDDP (CCRF-CEM-res) was selected by us by serial sub-cultivation of the parental wild type cells at increasing concentrations of CDDP. CCRF-CEM cells were maintained in culture between 1 × 10⁵ cells per mL and 2 × 10⁶ cells per mL, in RPMI medium with stable L-glutamine medium supplemented with 10% fetal bovine serum and 1% kanamycin (growth medium). The human ovarian carcinoma cell lines, A2780-wt and A2780-res (CDDP-resistant), were a generous gift by Dr Eva Fischer (Tumor Biology Laboratory, The Ion Chiricuta Oncology Institute, Cluj-Napoca, Romania, acquired from the European Collection of Authenticated Cell Cultures (ECACC) through Sigma Aldrich, St. Louis, USA) and were maintained in culture between 1.5 × 10⁵ cells per mL and 3 × 10⁶ cells per mL (∼70% confluency) in the same medium. In addition, CDDP-resistant cell lines, CCRF-CEM-res and A2780-res, were treated with CDDP at 5 μM (every passage) and 1 μM (every two or three splits), respectively, in order to maintain the drug resistance. Cisplatin resistance was checked every month by determining the CC50 of CDDP in the absence and presence of the drug. All experiments with CDDP-resistant sublines were performed using cell populations that were grown for one passage without the drug. All cells used in the experiments were replaced every three months with freshly thawed cells from aliquots stored in liquid nitrogen. The absence of mycoplasma contamination was periodically monitored.44Cisplatin-resistant CCRF-CEM subline
A CCRF-CEM cell line able to grow to the same extent in the absence and presence of 5 μM CDDP (CCRF-CEM-res) was obtained by serial passages of parental (wild-type) cells in the presence of increasing CDDP concentrations, starting from a sub-inhibitory concentration (0.5 μM). At each cell passage (every 3–4 days), the number of viable cells in cisplatin-treated cultures was compared to that of untreated cultures cultivated in parallel. Initially, and up to 1.50 μM, the CDDP concentration was increased by 0.25 μM at each cell passage. From then on, cisplatin-treated cultures grew poorly and much more slowly than their untreated counterparts; thus, before further increasing the drug concentration, cells had to be grown at the same CDDP concentration until the cell population had regained its original growth timing and viability (about 5 consecutive passages). Given that cells never survived at concentrations higher than 5 μM, the cell population was stabilised by 15 further passages at this concentration, then amplified, grown for one passage in the absence of the CDDP, and stored in aliquots in liquid nitrogen for experimental use.The number of viable cells was determined at each cell passage by the trypan blue exclusion method. At intervals during the selection process, the level of CDDP resistance was checked by the 3-(4,5-dimethylthiazol-2-yl)-2,5-diphenyl-tetrazolium bromide (MTT) method in cells that had grown without the drug for one passage. Doxorubicin was used as a reference compound to evaluate the cisplatin-resistance specificity. The Resistance Index (RI) was the ratio of the CDDP CC50 in CCRF-CEM-res and CCRF-CEM-wt.
Determination of intracellular glutathione
Basal intracellular GSH levels were determined by using the GSH/GSSG ratio detection assay kit (Fluorometric green; Abcam ab138881, Cambridge, UK) according to the manufacturer's protocol. Briefly, CCRF-CEM wt, CCRF-CEM res, A2780 wt, and A2780 res cells were seeded at a density of 4 × 10⁵ cells per mL in flat-bottomed 24-well plates in growth medium and allowed to settle overnight before lysis with PBS/0.5% NP-40 (Sigma Aldrich). Cell lysates were deproteinized with the TCA/NaHCO3 method and diluted to ensure readings within the standard curve values. The samples were transferred into 96-well plates with black walls and clear bottom. GSH detection was at Ex/Em = 490/520 nm by a plate reader (FLUOstar Omega, BMGLabtech). All determinations were performed in triplicate.Peripheral blood lymphocytes
Peripheral blood lymphocytes (PBLs) used in the study were isolated from blood samples voluntarily donated by three coauthors following their informed written consent to the use for research purpose. PBLs were isolated by gradient separation in Lympholyte-H (Cedarlane). After extensive washing, cells were suspended (1 × 10⁶ cells per mL) in RPMI-1640 10% FBS and incubated overnight. For evaluations in resting PBLs, 1 × 10⁵ cells per well of flat-bottomed 24-well plates were incubated in RPMI-1640 with 10% FBS, in the absence or presence of the test drugs at the indicated concentrations.For experiments with activated and proliferating PBLs, 1 × 10⁵ cells per well of flat-bottomed 24-well plates were incubated in RPMI-1640 10% FBS supplemented with PHA (2.5 μg mL−1), or with PHA (2.5 μg mL−1) and Interleukin 2 (IL2, 5 U mL−1), in the absence or presence of the compounds at the indicated concentrations. Cell growth was determined after 24 h, 48 h and 72 h of incubation at 37 °C and 5% CO2 through the viable cell counting with the trypan blue exclusion method. Values in drug-treated samples were expressed as percentages of their respective controls.
Cytotoxic assays
The biological stability of the copper complex (C0) solutions was checked verifying the cytotoxic activity measured by using the same solutions over more than 6 months. The tested compound maintained the same CC50 (concentration of compound that reduces the viable cell by 50% with respect to untreated cells) in all the performed experiments. Dilutions of the drug stocks for biologic investigations were made in RPMI medium at 2× the final concentration for single drug evaluations, or at 4× the final concentration for evaluation of binary and ternary drug combinations. The concentration of DMSO in the cells was never higher than 0.1%. The effects of the drugs and drug combinations were evaluated in cultures of exponentially growing cells; for experiments in cisplatin-resistant cell cultures, cells were allowed to grow in the absence of the drug for one passage. CCRF-CEM-wt and CCRF-CEM-res cells were seeded at a density of 1 × 10⁵ cells per well in flat-bottomed 24-well plates in growth medium, and simultaneously exposed to the drugs, or drug combinations. A2780-wt and A2780-res cells were seeded at a density of 1 × 10⁵ cells per well in flat-bottomed 24-well plates and allowed to adhere overnight before of the addition of the drug combinations. Cell growth in the absence and presence of drugs was determined in both cell lines after 96 h of incubation at 37 °C and 5% CO2, through the viable cell counting with the trypan blue exclusion method.45 This method was used because coloured GSH solution interfered with the MTT method. Values obtained in drug-treated samples were expressed as percentages of those of their respective controls. All experiments were repeated three times. Dose–response curves for each drug were determined and the CC50 of single drug and drug combinations were calculated. To evaluate the cytotoxic effects of CDDP in combination with C0 and GSH, the ED–ANNs method was used, as described below.Experimental design
The number of prepared drug cocktails are reported in Table 3. Solutions (i), (vi) and (vii) were used to study by ANN the GSH–C0 system; solutions (ii), (v) and (vi) were used to study the GSH–CDDP system; solutions (iii), (v) and (vii) were used to study the CDDP–C0 system; solutions (iv), (v), (vi) and (vii) were used to study the ternary CDDP–GSH–C0 system. The experimental designs (ED) used are shown in the ESI (Fig. S2).†| Row | Combinations | CCRF-CEM-wt | CCRF-CEM-res | A2780-wt | A2780-res |
|---|---|---|---|---|---|
| i | GSH–C0 | 6 | 9 | 9 | 9 |
| ii | GSH–CDDP | 6 | 9 | 9 | 9 |
| iii | C0–CDDP | 7 | 9 | 9 | 9 |
| iv | GSH–CDDP–C0 | 52 | 27 | 27 | 27 |
| v | CDDP | 10 | 5 | 10 | 9 |
| vi | GSH | 10 | 4 | 5 | 7 |
| vii | C0 | 11 | 4 | 7 | 8 |
Multi-drug resistance (MDR) activity
The activity of major drug-efflux proteins MDR1/P-gp and MRP1 was determined by a fluorimetric MDR Assay kit (ab112142, Abcam, Cambridge, UK) according to the manufacturer's instructions. CCRF-CEM wt, CCRF-CEM res, A2780 wt and A2780 res cells were seeded at a cell density of 2 × 10⁵/well into 96-well plates, with black walls and clear bottoms, and incubated overnight. Cells were then treated with different concentrations of CDDP and Cyclosporine A (control) and the MDR dye-loading solution was added. After 1 hour incubation at room temperature in the dark, the intracellular-trapped fluorescence was detected using a plate reader (FLUOstar Omega, BMGLABTECH) with a filter set of Ex/Em = 490/525 nm. The experiments were performed in triplicate.Apoptosis
A number of 2.5 × 10⁴ A2780 cells were seeded in flat-bottomed 24/well plates in 1 mL of supplemented growth medium as described in the cell lines section. Cells were allowed to adhere overnight before the addition of drugs or drug combinations. After 20 hours of incubation with and without the drugs, apoptosis was evaluated by Alexa Fluor 488 Annexin V and propidium iodide (PI) staining (Invitrogen), according to the manufacturer's instructions. In brief, the cells were washed twice with PBS before the addition of the binding buffer containing recombinant Annexin V conjugated to Alexa Fluor 488 dye and PI. For the quantitation of cells in early and late apoptosis, the percentage of apoptotic target cells scored with the ZOE Fluorescent Cell Imager using filters for fluorescein (FITC) and Texas Red (excitation at 480/17 nm and 556/20 nm, respectively) was calculated.Ethical statement
All experiments were performed in compliance with institutional guidelines by the University of Cagliari. The use of human blood samples was approved for the purpose of this study by the Ethical Committee of Azienda Ospedaliero-Universitaria of Cagliari, and handling of samples proceeded accordingly. Written informed consent was obtained for each individual included in the study, and all data were handled in accordance with the local ethical committee approved protocol and in compliance with the Helsinki declaration.Conflicts of interest
There are no conflicts of interest to declare.Acknowledgements
We wish to thank SV, DP, and AS for voluntarily donating their blood samples.References
- A.-M. Florea and D. Büsselberg, Cancers, 2011, 3, 1351–1371 CrossRef CAS PubMed.
- R. A. Alderden, M. D. Hall and T. W. Hambley, J. Chem. Educ., 2006, 83, 728–734 CrossRef CAS.
- N. J. Wheate, S. Walker, G. E. Craig and R. Oun, Dalton Trans., 2010, 39, 8113–8127 RSC.
- D. Wang and S. J. Lippard, Nat. Rev. Drug Discovery, 2005, 4, 307–320 CrossRef CAS PubMed.
- C. Madeddu and A. Maccio, Expert Opin. Pharmacother., 2013, 14, 13 Search PubMed.
- Z. Han, J. Feng, Z. Hong, L. Chen, W. Li, S. Liao, X. Wang, T. Ji, S. Wang, D. Ma, G. Chen and Q. Gao, Biochem. Biophys. Res. Commun., 2013, 435, 188–194 CrossRef CAS PubMed.
- A. I. Ivanov, J. Christodoulou, J. A. Parkinson, K. J. Barnham, A. Tucker, J. Woodrow and P. J. Sadler, J. Biol. Chem., 1998, 273, 14721–14730 CrossRef CAS.
- F. Kratz, Metal Complexes in Cancer Chemotherapy, Germany VCH, Weinheim, 1993 Search PubMed.
- J. Arpalahti, in Cisplatin, Verlag Helvetica Chimica Acta, 1999, pp. 207–221 Search PubMed.
- F. Legendre and J.-C. Chottard, in Cisplatin, Verlag Helvetica Chimica Acta, 1999, pp. 223–245 Search PubMed.
- Z. Guo and P. J. Sadler, Adv. Inorg. Chem., 2000, 49, 183–306 CrossRef CAS.
- R. B. Martin, in Cisplatin, Verlag Helvetica Chimica Acta, 1999, pp. 181–205 Search PubMed.
- T. W. Hambley, J. Chem. Soc., Dalton Trans., 2001, 2711–2718 RSC.
- M. A. Fuertes, J. Castilla, C. Alonso and J. M. Pérez, Curr. Med. Chem.: Anti-Cancer Agents, 2002, 2, 539–551 CrossRef CAS.
- M. M. Gottesman, Annu. Rev. Med., 2002, 53, 615–627 CrossRef CAS PubMed.
- E. R. Jamieson and S. J. Lippard, Chem. Rev., 1999, 99, 2467–2498 CrossRef CAS.
- T. Egawa-takata, H. Endo, M. Fujita, Y. Ueda, T. Miyatake, H. Okuyama, K. Yoshino, S. Kamiura, T. Enomoto, T. Kimura and M. Inoue, Cancer Sci., 2010, 101, 2171–2178 CrossRef CAS PubMed.
- T. Ishikawa and F. Ali-Osman, J. Biol. Chem., 1993, 268, 20116–20125 CAS.
- Y. Kasherman, S. Sturup and D. Gibson, J. Med. Chem., 2009, 52, 4319–4328 CrossRef CAS PubMed.
- A. Meister, J. Biol. Chem., 1988, 263, 17205–17208 CAS.
- T. E. Tipple and L. K. Rogers, in Methods Mol Biol., 2012, vol. 889, pp. 315–324 Search PubMed.
- M. P. Gamcsik, M. S. Kasibhatla, S. D. Teeter and O. M. Colvin, Biomarkers, 2012, 17, 671–691 Search PubMed.
- C. Friesen, Y. Kiess and K. M. Debatin, Cell Death Differ., 2004, 11, S73–S85 CrossRef CAS PubMed.
- Z. H. Siddik, Oncogene, 2003, 22, 7265–7279 CrossRef CAS.
- T. Pivetta, M. D. Cannas, F. Demartin, C. Castellano, S. Vascellari, G. Verani and F. Isaia, J. Inorg. Biochem., 2011, 105, 329–338 CrossRef CAS PubMed.
- T. Pivetta, F. Isaia, G. Verani, C. Cannas, L. Serra, C. Castellano, F. Demartin, F. Pilla, M. Manca and A. Pani, J. Inorg. Biochem., 2012, 114, 28–37 CrossRef CAS PubMed.
- T. Pivetta, F. Isaia, F. Trudu, A. Pani and M. Manca, Talanta, 2013, 115, 84–93 CrossRef CAS.
- T. Pivetta, F. Trudu, E. Valletta, F. Isaia, C. Castellano, F. Demartin, R. Tuveri, S. Vascellari and A. Pani, J. Inorg. Biochem., 2014, 141, 103–113 CrossRef CAS.
- R. A. Davey, T. J. Longhurst, M. W. Davey, L. Belov, R. M. Harvie, D. Hancox and H. Wheeler, Leuk. Res., 1995, 19, 275–282 CrossRef CAS.
- N. Mohell, J. Alfredsson, A. Fransson, M. Uustalu, S. Byström, J. Gullbo, A. Hallberg, V. J. N. Bykov, U. Björklund and K. G. Wiman, Cell Death Dis., 2015, 6, e1794 CrossRef CAS PubMed.
- N. Nikounezhad, M. Nakhjavani and F. H. Shirazi, J. Exp. Ther. Oncol., 2017, 12, 1–7 CAS.
- B. G. M. Vandeginste, D. L. Massart, L. M. C. Buydens, S. De Jong, P. J. Lewi and J. Smeyers-Verbeke, Handbook of Chemometrics and Qualimetrics, Part A, Elsevier Science, Amsterdam, 1997 Search PubMed.
- B. Donnerstag, G. Ohlenschl, J. Cinatlb, M. Amrania, D. Hofmann, S. Flindt, G. Treuschc and L. Trlgera, Cancer Lett., 1996, 110, 63–70 CrossRef CAS PubMed.
- J. B. Rotstein and T. J. Slaga, Carcinogenesis, 1988, 9, 1547–1551 CrossRef CAS PubMed.
- G. K. Balendiran, R. Dabur and D. Fraser, Cell Biochem. Funct., 2004, 22, 343–352 CrossRef CAS.
- A. Russo, W. Degraff, N. Friedman and J. B. Mitchell, Cancer Res., 1986, 46, 2845–2848 CAS.
- V. Oers, Apoptosis, 1994, 1415–1420 Search PubMed.
- T. Pivetta, V. Lallai, E. Valletta, F. Trudu, F. Isaia, D. Perra, E. Pinna and A. Pani, J. Inorg. Biochem., 2015, 15, 107–114 CrossRef PubMed.
- M. López-lázaro, Anticancer Agents Med. Chem., 2008, 8, 305–312 CrossRef.
- C. Granchi, D. Fancelli and F. Minutolo, Bioorg. Med. Chem. Lett., 2014, 24, 4915–4925 CrossRef CAS PubMed.
- A. Marín-Hernández, J. C. Gallardo-Pérez, S. Y. López-Ramírez, J. D. García-García, J. S. Rodríguez-Zavala, L. Ruiz-Ramírez, I. Gracia-Mora, A. Zentella-Dehesa, M. Sosa-Garrocho, M. MacÍas-Silva, R. Moreno-Sánchez and S. Rodríguez-Enríquez, Arch. Toxicol., 2012, 86, 753–766 CrossRef PubMed.
- E. Cadoni, E. Valletta, G. Caddeo, F. Isaia, M. G. Cabiddu, S. Vascellari and T. Pivetta, J. Inorg. Biochem., 2017, 173, 126–133 CrossRef CAS PubMed.
- T. Pivetta, F. Isaia, G. Verani, C. Cannas, L. Serra, C. Castellano, F. Demartin, F. Pilla, M. Manca and A. Pani, J. Inorg. Biochem., 2012, 114, 28–37 CrossRef CAS PubMed.
- E. Valletta, L. Kučera, L. Prokeš, F. Amato, T. Pivetta, A. Hampl, J. Havel and P. Vaňhara, PLoS One, 2016, 11, e0147414 CrossRef PubMed.
- W. Strober, Curr. Protoc. Immunol., 2001, A.3A.1–A.3A.2 Search PubMed.
Footnotes |
| † Electronic supplementary information (ESI) available. See DOI: 10.1039/c8ra09652j |
| ‡ Equal contribution. |
| This journal is © The Royal Society of Chemistry 2019 |