 Open Access Article
Creative Commons Attribution 3.0 Unported Licence
Anionic effects on the structure and dynamics of water in superconcentrated aqueous electrolytes
Sungho Han *
*
CAE Group, Platform Technology Lab, Samsung Advanced Institute of Technology, Suwon, Gyeonggi 16678, Korea. E-mail: hellosungho@gmail.com
First published on 2nd January 2019
Abstract
Dissolved ions in aqueous solutions are ubiquitous in a variety of systems and the addition of ions to water gives rise to dramatic effects on the properties of water. Due to a significant role of ions in the structure and dynamics of water, the ionic conditions, such as the ion type and concentration, have been considered as critical factors. Here we study the effects of anions on the structure and dynamics of water in aqueous electrolytes for various lithium salt concentrations via extensive molecular dynamics simulations. Our results demonstrate that a certain amount of salt is needed to show the different properties of water caused by the presence of different types of anion. Below the cutoff concentration, most features of water show the same characteristics in spite of the presence of different anions. In the superconcentrated limit, we find that full disruption of the hydrogen bond network between water molecules occurs for most anions investigated, indicating that the effect of the water–water interaction becomes negligible. However, a certain type of anion could enhance an ion-pairing of cations and anions and the water–water interaction remains considerable even in the superconcentrated limit. We further investigate the cationic and anionic hydration shell structures and dynamics, revealing their dependence on the anion type and the salt concentration. Finally, we observe that the anionic effects on water extend to the dynamics of water molecules, such as an anionic dependence of the onset of subdiffusive translation and anisotropic rotation.
1 Introduction
The ability to form hydrogen-bonds (HBs) makes water unique among other liquids – with properties such as unusual temperature dependence of density and thermodynamic response functions, high boiling and melting temperatures and high surface tension.1 In recent years, furthermore, it has been proposed by computer simulations that water in the deeply supercooled regime could exhibit two distinct liquid properties of low-density water and high-density water, and they are separated by a first-order transition line terminating at the hypothesized second critical point.2 However, confirming the liquid–liquid phase transition scenario has been an experimentally challenging task due to the restriction of experimental approaches, also known as “no-man’s land”, since the nucleation of water occurs on a much shorter timescale than experimentally accessible timescales. As a result, the liquid–liquid phase transition scenario of water still remains controversial.3–5 Instead of direct exploration, existence of the Widom line, the locus of maximum thermodynamic response functions beyond a critical point, has been intensively explored in experiments and simulations.6–10 The remarkable and unusual properties of water are believed to originate from its complex HB network related to the tetrahedral structure, emphasizing the role of the HB network in the properties of water.Water is ubiquitous in nature and it mostly exists in complex forms with ions rather than as neat water. Complex forms of water with ions commonly exist in many chemical and biological systems.11,12 The influence of ions on the structure and dynamics of water is of great importance for understanding their roles in chemical and biological processes such as protein stability, cell membrane transport, and aerosol formation.13 Hence the effects of ions on the structure and dynamics of water have been extensively investigated both experimentally and theoretically.14–24 For example, there is a subject of ongoing discussion about the spatial extent of the influence of the dissolved ions on the structure of the surrounding water molecules in solutions. Recent studies have shown that long-range orientational order between water molecules exists in dilute salt solutions.25,26 The ionic effects on water are often described in terms of a concept of the structure-maker and structure-breaker,27 where ions could participate in either enhancing or weakening the HB network of water. A celebrated example is the Hofmeister series,28 a classification of ions in order of their ability to salt out or salt in proteins. Although the concept of the structure-maker/breaker of ions has been widely accepted, the effects of ions on the structure of water remain elusive. Some results are in good agreement with the concept, but some are not.17,18 Furthermore, many studies have shown that the ionic effects on the properties of water strongly depend on the type of ions. Experimental and simulation studies have shown that the dynamics of water can be suppressed or enhanced by the presence of a different type of ions, which is induced by the subtle change in the structure of water by the ions.29,30
Superconcentrated conditions in electrolytes have not gained much attention due to the lack of their practical applications. Recently, however, a series of studies has proposed that superconcentrated aqueous electrolytes could simultaneously enhance both the performance and safety of lithium ion batteries.31–35 The usage of aqueous electrolytes in lithium ion batteries has been limited by the narrow electrochemical stability of water.36 A water molecule is decomposed at around 1.23 volts, which is far below the practical demand for battery operations. Recent studies have shown that lithium ion batteries of 2.3 volts can be stably operated with superconcentrated aqueous electrolytes up to 1000 cycles with nearly 100% coulombic efficiency.32–34 They have also shown that an extremely high concentration of a lithium bis(trifluoromethanesulfonyl)imide salt (called ‘water-in-salt’) could help the batteries to be operated at up to 3 volts. In superconcentrated aqueous electrolytes, the interaction between salt and water would enormously increase and the properties of water would predominantly depend on the nature of interactions with cations and anions. For the electrolytes of lithium ion batteries, various anions in the lithium salt have been introduced and tested so far.37–39 However, the effects of anions on the structure and dynamics of water are far from being fully understood.15
In this work, we explore how the existence of different anions will affect the structural and dynamic properties of water in aqueous electrolytes for various salt concentrations, focusing on superconcentrated conditions. For the sake of it, we consider four different anions, as a counterion of a lithium ion, – bis(trifluoromethanesulfonyl)imide (TFSI−), bis(fluorosulfonyl)imide (FSI−), trifluoromethanesulfonate (OTf− or triflate) and nitrate (NO3−), according to their sizes. For each anion, we construct the systems with six salt concentrations: 1 M, 2 M, 5 M, 10 M, 15 M and 20 M. Especially, we focus on investigating the HB network structure and HB dynamics of water in the presence of different anions. In addition, we investigate the hydration shell structure and dynamics of an Li+ ion and four different anions. Finally, we examine the dependence of the translational and rotational dynamics of water molecules on the type of anion.
2 Methods
We performed molecular dynamics (MD) simulations of aqueous electrolyte solutions consisting of a lithium salt in water modeled with the extended simple point charge (SPC/E) model.40 For comparison of anionic effects, we modeled four different anions: TFSI−, FSI−, OTf− and NO3−. We investigated the systems with six different salt concentrations: 1, 2, 5, 10, 15 and 20 M. The number of water molecules was NW = 5832 and the number of the salt was NS = 105 up to 2100, depending on the salt concentration. We carried out all simulations using the MD simulation package, LAMMPS.41 We implemented the OPLS/AA force field to describe the molecular interaction of the anions.42 We used the combination rule of Lorentz–Berthelot for the intermolecular interactions. We computed the long-range interactions using the particle–particle particle–mesh (PPPM) algorithm. The simulations were performed initially in the NPT ensemble and then in the NVT ensemble, where N, V, P and T are the number of molecules (NW + NS), the volume, the pressure and the temperature, respectively. We kept the temperature and pressure constant via the Nóse–Hoover thermostat and barostat during the simulations. We applied periodic boundary conditions in all three directions of the simulation box. We used 1 fs as the timestep of the simulation. For each salt concentration, we ran MD simulations of 50 ns for the equilibration and 30 ns for the data collection. Initially, we prepared the random configuration and then increased the temperature up to 400 K to mix the system properly. After then, we decreased the temperature to the target temperature, 300 K, and finally equilibrated the system.3 Results and discussion
3.1 Structure and hydrogen-bond networks of water
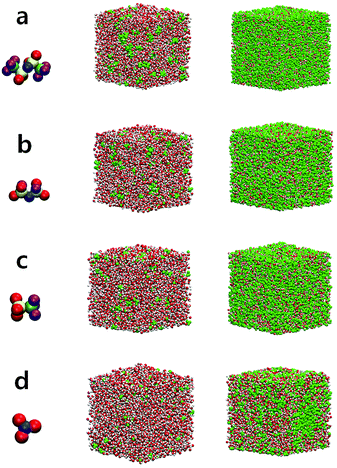
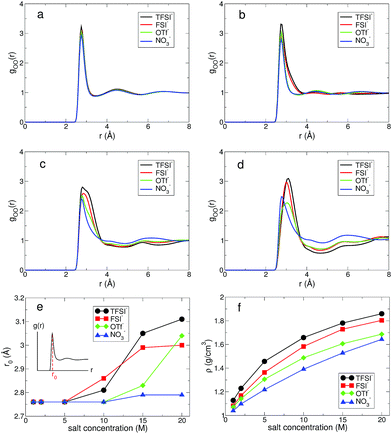
At low and extremely high salt concentrations, the surrounding conditions of water molecules are quite different and a dominant factor for the structure and dynamics of water would be either the water–water interaction or the ion–water interaction in both concentration limits. In Fig. 1, we present the configurations of four different aqueous electrolytes at low and extremely high salt concentrations. The configurations for all anions at 1 M show that most water molecules are surrounded by other water molecules and a relatively small fraction of them directly interact with cations and anions. In the superconcentrated limit, on the contrary, almost all water molecules are surrounded by ions and directly interact with them. Thus, the interactions of water with cations and anions would be key to determining the properties of water in the superconcentrated limit. It would be of great importance to understand how the properties of water depend on the type and amount of anions. Note that for NO3− the configuration at 20 M is different from the configurations of the other anions. This shows the enhanced ion-pairing of Li+ ions and NO3− ions, indicating the low solubility of the lithium salt in water.First, we investigated the structure of water by calculating the oxygen–oxygen radial distribution function (RDF) gOO(r) between water molecules.24,43,44 In Fig. 2, we present gOO(r) for four different anions. The RDFs at 1 M show no difference in the presence of the different anions. Namely, all RDFs fall onto the same curve. This tells us that the water–water interaction at 1 M remains dominant for the structure of water. As the salt concentration increases, we observe growing differences in gOO(r) with respect to the anion types. When the salt concentration becomes 5 M, the first peak of gOO(r) for TFSI− and FSI− broadens, even though the peak position does not change from gOO(r) at 1 M. At the extremely high concentration of 20 M, gOO(r) of the four different anions become clearly distinguishable from each other. The position r0 of the first peak in gOO(r) for TFSI− and FSI− shows the increase when the salt concentration becomes 10 M, whereas r0 for OTf− and NO3− starts to increase above 15 M. Thus, we conclude that the cutoff concentration generating the structural change in water depends on the type of anion. Note that the r0 for NO3− increases by about 0.03 Å at 20 M and it is relatively small compared to the other anions. The structure of water in the environment with NO3− is not affected much by increasing the salt concentration.
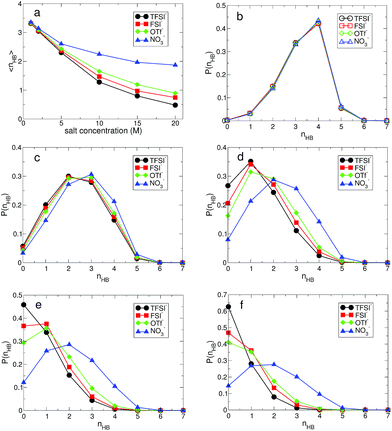
The structural change in gOO(r) we observed continues to the complex HB network in water. To explore changes in the HB characteristics of water, we adopted the traditional geometric definition of HB.24,45–47 This describes that the two tagged water molecules are considered to be hydrogen-bonded if simultaneously the distance between two oxygen atoms is less than 3.5 Å, and the angle between intra O–H and O⋯O is less than 30°. In Fig. 3, we present the average HB number and its distribution. Note that the HB in water denotes only the HB between water molecules. At 1 M, the average HB number 〈nHB〉 per molecule between water molecules is approximately 〈nHB〉 = 3.32–3.35, showing a small reduction in the HB number compared to bulk water, 〈nbulkHB〉 = 3.40–3.60.24,45–47 〈nHB〉 gradually decreases as the salt concentration increases. When it becomes 20 M, 〈nHB〉 for all anions except NO3− is less than 1.0, which means that one molecule acts as either an HB donor or an HB accepter. Otherwise, the molecules do not participate in forming the HB network of water at all. This indicates that connectivity of the HB network between water molecules is fully disrupted by the existence of ions in the superconcentrated limit. In contrast, 〈nHB〉 for NO3− at 20 M is about 2.0, indicating that a water molecule still plays the roles of both an HB donor and an HB acceptor, simultaneously. This different behavior in the presence of NO3− stems from the low solubility of the lithium salt in water.
For detailed information on the HB number of water, we calculated the probability function P(nHB) for a water molecule to have nHB hydrogen-bonding numbers.24 In Fig. 3, we present P(nHB) for various salt concentrations. At 1 M, P(nHB)s for all anions overlap with each other, which is the same behavior as found in gOO(r). This means that the HB network in water for low concentrations does not depend on the type of anion. Upon increasing the salt concentration, P(nHB) shows dependence on the anion species. For TFSI−, at 20 M, more than 60% of water molecules do not form HBs with the other water molecules at all. For FSI− and OTf−, about half of the water molecules at 20 M do not participate in forming the HB network in water at all. For NO3−, we find different behavior in P(nHB) above 10 M, compared to the other anions. Even at the salt concentration of 20 M, P(nHB) shows a maximum at nHB = 2.0, indicating the wide span of the HB network in water. The disruption of the HB network in water is the smallest in the presence of NO3−. In the superconcentrated limit, hence, the anion type could affect the formation of the HB network in water. Previously, an experimental study has shown that ions give negligible effects on the HB structure of water.48 However, the concentration of ions in this study was not within the range of the superconcentrated conditions.
3.2 Hydrogen-bond dynamics of water
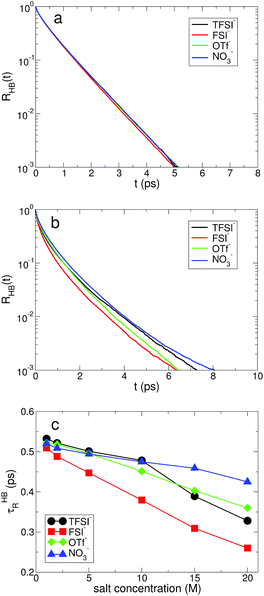
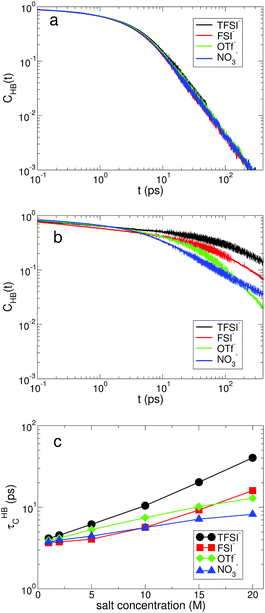
Next, we examine the fast and slow HB dynamics of water molecules to understand how the breaking and forming of HB between water molecules occur on different timescales for various anionic environments.49 First of all, we describe the fast HB dynamics of water via the HB residence time distribution24,45,47 defined as| RHB(t) ≡ 〈Θ(tHBb − t)〉, | (1) |
For the slow kinetics of HB, we define the HB correlation time distribution CHB(t)24,45–47,50 as
 | (2) |
The effects of the salt concentration on the forming and breaking of HB in water result in the two different behaviors in the fast and slow HB dynamics for all anions. Whereas τHBR gradually decreases upon increasing the salt concentration, τHBC increases exponentially. This tells us that two different timescales would be needed to fully characterize the HB dynamics of water in aqueous electrolyte solutions, on which the dependences of the HB dynamics on the salt concentration show opposite behaviors. Since the structure and dynamics of HB have deep impacts on the dynamical properties of water molecules, one can make a connection of the above results with the dynamical behaviors of water with respect to the salt concentration: the faster thermal fluctuations (possibly related to the rotational motion) and the much slower translational motion with the increasing salt concentration. Hence one can understand the dynamics of water with a molecular picture that a water molecule rotates faster on a certain molecular axis but it translates much slower with the given surrounding conditions for higher salt concentrations. We will see this later in detail. For NO3−, the changes in both τHBR and τHBC according to the salt concentration are quite small compared with the other anions. The result of 〈nHB〉 ∼ 2 for NO3− confirms that the water–water interaction is still influential on the properties of water even in the superconcentrated limit, so that the effect of NO3− on the HB dynamics of water is relatively weaker than the other anions due to the enhanced ion-pairing.
3.3 Cationic and anionic hydration shells – structure and dynamics
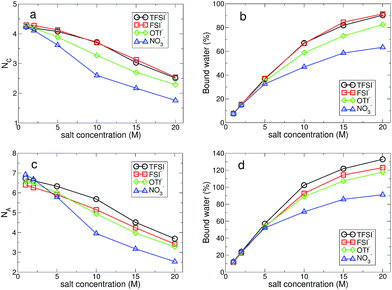
Since the ion–water interactions are of great importance to the properties of water in the superconcentrated limit, it is natural to investigate how water molecules interact with ions by considering the structure and dynamics of hydration regarding the cationic and anionic hydration shells. For the structural properties of the cationic hydration shell, we first calculated the lithium solvation number NC of water, which is defined as the number at the first plateau in the cumulative coordination number,24,51
 | (3) |
Now we can classify water molecules into those bound within the hydration shell of ions (bound) and those outside of it (free). In Fig. 6, we present the fraction of bound water molecules for each hydration shell for all anions. Although the average number of water molecules per ion within each hydration shell seems to decrease upon increasing the salt concentration, the total number of bound water molecules increases due to the increase in the number of ions. At 1 M, the fraction of bound water molecules in the cationic hydration shell is below 10% for all anions, and then at 20 M it exceeds 90% for TFSI− and FSI−. For NO3−, the fraction of bound water molecules is around 60% and it is the lowest among the anions in the superconcentrated limit. For the anionic hydration shell, the fraction of bound water molecules at 20 M exceeds 100% for the three anions of TFSI−, FSI− and OTf−, indicating that one water molecule is hydrogen-bonded with more than one anion. For NO3−, however, it is below 100%. This confirms that the water–water interaction in the anionic environment of NO3− remains significant and lithium nitrate has a relatively low solubility limit in water among the four anions.
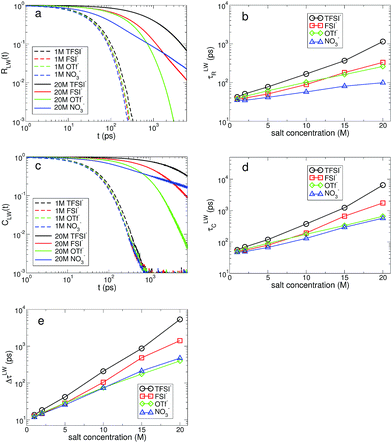
The water molecules hydrating ions have a finite lifetime in their residence within the hydration shell. The key idea to describe the exchange dynamics should be how long water molecules reside within the hydration shell of each ion.14,52,53 The residence time of water molecules within the hydration shell, also known to represent the rigidity of the hydration shell, plays an important role in the transport of ions.14,51 We examine the fast and slow kinetics of the exchange dynamics of water molecules in the hydration shell, R(t) and C(t), which are defined in the same ways as in eqn (1) and (2), respectively. The mechanisms of the two exchange dynamics are different. The fast exchange dynamics of water is associated with the thermal fluctuations in the motion of water molecules and the slow exchange dynamics is closely connected with the diffusive motions of both ions and water. For a Li+ ion, we describe the fast and slow exchange dynamics in terms of the cationic residence time and correlation time distributions of water molecules, RLW(t) and CLW(t), respectively. We consider that a bond between a Li+ ion and the oxygen atom of a water molecule is broken if the distance between them exceeds 2.7 Å, the approximate size of the first hydration shell. Similarly, for the anionic hydration dynamics, we calculate the fast and slow HB dynamics of water molecules with the oxygen atoms of anions, RAW(t) and CAW(t), respectively.
In Fig. 7, we present the RLW(t) and CLW(t) at low and high salt concentrations for the different types of anion. At low concentration, we find a small difference in both distributions for all anions. In other words, the effect of anions on the cationic hydration dynamics of water is weak at low concentration and the exchange dynamics of water in the cationic hydration shell is mostly affected by the other water molecules staying near the first hydration shell. Both RLW(t) and CLW(t) exhibit slower decaying behaviors with higher salt concentrations. To characterize the temporal behaviors of RLW(t) and CLW(t) in terms of a single variable, we introduce the characteristic residence and correlation times, τLWR and τLWC, defined as the times required for RLW(t) and CLW(t) to decay by a factor of e, respectively. Both the characteristic times of τLWR and τLWC increase upon increasing the salt concentration for all anions. For cationic hydration dynamics, in contrast to the HB dynamics of water, the fast and slow hydration dynamics show the same characteristics with respect to the salt concentration. Interestingly, the difference in the two characteristic times, ΔτLW ≡ τLWC − τLWR, shows an exponential change with a change in the salt concentration. As a result, this suggests that at low concentration the fast and slow cationic hydration dynamics would occur almost concurrently, but for the increasing salt concentration the timescales needed for describing the two hydration dynamics become separate and the two dynamics occur with a certain time gap.
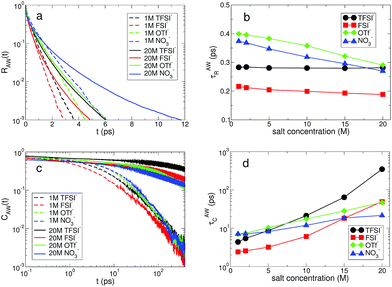
For the anionic hydration dynamics, the behaviors of the fast and slow hydration dynamics are slightly different from those of the cationic hydration dynamics. In Fig. 8, we present the RAW(t) and CAW(t) at low and high salt concentrations for the different types of anion. Even at low concentration, we find that recognizable differences in RAW(t) and CAW(t) are observed due to the presence of the different types of anion. To characterize the temporal behaviors of RAW(t) and CAW(t), we also introduce the characteristic HB residence and correlation times, τAWR and τAWC, defined in the same way as in τLWR and τLWC. For the fast anionic hydration dynamics, we can categorize the behavior of τAWR into two groups: OTf− and NO3− belong to the first group and the second group contains TFSI− and FSI−. We find that τAWR of the second group is almost unchanged with respect to a change in the salt concentration, whereas the first group shows a gradual change in τAWR. This means that the fast HB kinetics with the TFSI− and FSI− anions is insensitive to the salt concentration for most water molecules, whereas the breaking and forming of HB with OTf− and NO3− occur at a faster time for the higher salt concentration. On the other hand, the slow HB kinetics with anions occurs in a different way. We can still categorize the behavior of τAWC into the same two groups, but their behavior is different from that for τAWR. τAWC for TFSI− and FSI− abruptly increases upon increasing the salt concentration, whereas τAWC for OTf− and NO3− increases by relatively smaller values. By a direct connection of the slow anionic hydration dynamics with the diffusive motion of water molecules, our results reveal that the translational motion of water molecules abruptly slows down with TFSI− and FSI− upon increasing the salt concentration. As a result, the escape time of water molecules from the anionic hydration shell dramatically increases and the anionic hydration shell becomes more rigid on a long timescale. For the anionic hydration dynamics, we find that there are two timescales needed to describe the dependence of the hydration dynamics on the salt concentration, which are similar to the HB dynamics of water but in contrast to the cationic hydration dynamics.
3.4 Dynamical properties of water molecules
Lastly, we investigate how the existence of different anions would affect the translational and rotational dynamics of water molecules for increasing salt concentrations. First, we calculate the translational mean square displacement (TMSD), defined as24,43,44,51,54,55
 | (4) |
![[H with combining right harpoon above (vector)]](https://www.rsc.org/images/entities/i_char_0048_20d1.gif) (t). Its direction is defined as the vector from an oxygen atom to the midpoint of the line joining two hydrogen atoms. For a given time interval δt, the vector
(t). Its direction is defined as the vector from an oxygen atom to the midpoint of the line joining two hydrogen atoms. For a given time interval δt, the vector ![[H with combining right harpoon above (vector)]](https://www.rsc.org/images/entities/i_char_0048_20d1.gif) (t) will span the angle of δφ ≡ cos−1[
(t) will span the angle of δφ ≡ cos−1[![[H with combining right harpoon above (vector)]](https://www.rsc.org/images/entities/i_char_0048_20d1.gif) (t + δt)·
(t + δt)·![[H with combining right harpoon above (vector)]](https://www.rsc.org/images/entities/i_char_0048_20d1.gif) (t)]. Thus, we are able to define an angle vector δ
(t)]. Thus, we are able to define an angle vector δ![[small phi, Greek, vector]](https://www.rsc.org/images/entities/i_char_e13a.gif) (t) at time t. The magnitude of the angle vector is |δ
(t) at time t. The magnitude of the angle vector is |δ![[small phi, Greek, vector]](https://www.rsc.org/images/entities/i_char_e13a.gif) (t)| ≡ δφ and the direction of the angle vector is equal to
(t)| ≡ δφ and the direction of the angle vector is equal to ![[H with combining right harpoon above (vector)]](https://www.rsc.org/images/entities/i_char_0048_20d1.gif) (t) ×
(t) × ![[H with combining right harpoon above (vector)]](https://www.rsc.org/images/entities/i_char_0048_20d1.gif) (t + δt). Finally, we obtain the angle vector
(t + δt). Finally, we obtain the angle vector ![[small phi, Greek, vector]](https://www.rsc.org/images/entities/i_char_e13a.gif) (t) by summing the angular velocity δ
(t) by summing the angular velocity δ![[small omega, Greek, vector]](https://www.rsc.org/images/entities/i_char_e13e.gif) (t) over time t,
(t) over time t,
 | (5) |
![[small omega, Greek, vector]](https://www.rsc.org/images/entities/i_char_e13e.gif) (t) ≡ δ
(t) ≡ δ![[small phi, Greek, vector]](https://www.rsc.org/images/entities/i_char_e13a.gif) (t)/δt. The form of the angle vector
(t)/δt. The form of the angle vector ![[small phi, Greek, vector]](https://www.rsc.org/images/entities/i_char_e13a.gif) (t) allows us to keep track of a trajectory of the angle vector
(t) allows us to keep track of a trajectory of the angle vector ![[small phi, Greek, vector]](https://www.rsc.org/images/entities/i_char_e13a.gif) (t) as a function of time t, so that it is possible for us to calculate the RMSD, defined as24,56,57
(t) as a function of time t, so that it is possible for us to calculate the RMSD, defined as24,56,57
 | (6) |
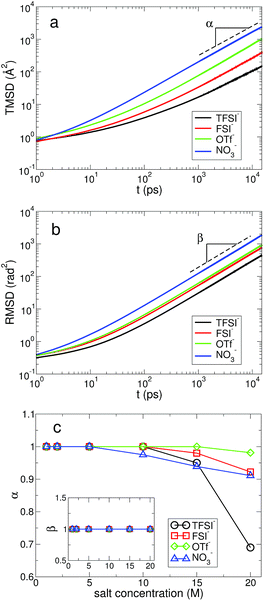
In Fig. 9, we present the TMSD and RMSD of water molecules in the superconcentrated limit in the presence of the different types of anion. For bulk water, the dynamic characteristics of water exhibit diffusive motion for both the translational and rotational dynamics in the long time limit,57,58 showing both exponents α = β = 1 in the relations  . In the superconcentrated limit, we find that α is less than 1, indicating the possibility of subdiffusive motion (α < 1) of water molecules. The subdiffusive translational motion of water has been observed in single-file diffusion inside a narrow carbon nanotube59–61 and it represents strongly correlated dynamics. In contrast, we find that β is always equal to 1 for all salt concentrations and for all anion species we investigated, showing that the rotational motion of water molecules remains diffusive, the same as in bulk water. This indicates that in superconcentrated aqueous electrolytes the temporal behavior of the translational and rotational motions could be separated (or decoupled). For the translational motion, the magnitude of α shows TFSI− < NO3− < FSI− < OTf−. For the three anions except TFSI−, the value of α is placed at between 0.9 and 1.0. As a result, we can interpret that it might represent simply a small deviation from the diffusive motion or weak subdiffusive motion. For TFSI−, the translational motion of water clearly shows subdiffusive motion with α = 0.69 in the superconcentrated limit.24 Thus, we conclude that the occurrence of subdiffusive translational motion could depend on the type of anion.
Using the results of the TMSD and RMSD, we examine the behavior of the translational diffusion constant DT and the rotational diffusion constant DR of water molecules for the different types of anion. We calculate DT from the TMSD via the Einstein relation,24,43,44,51,54
 | (7) |
In a similar way, we calculate DR from the RMSD,24,56,57,63
 | (8) |
To fully quantify the rotational dynamics of water molecules, we additionally calculate the rotational diffusion constants of the other two normalized principal vectors, ![[P with combining right harpoon above (vector)]](https://www.rsc.org/images/entities/i_char_0050_20d1.gif) (t) and
(t) and ![[Q with combining right harpoon above (vector)]](https://www.rsc.org/images/entities/i_char_0051_20d1.gif) (t),24,56,57 as shown in Fig. 10. For DR,H, the rotational motion of water molecules decreases upon increasing the salt concentration, representing the stronger attractive interaction between a Li+ ion and the oxygen atom of water molecules for higher salt concentrations. For DR,P, we can categorize the rotational motion of water molecules into two groups according to the type of anions. For TFSI−, FSI− and OTf−, DR,P in the superconcentrated limit is larger than DR,P at low concentration. This behavior of DR,P is in contrast to DR,H with respect to the salt concentration, indicating an occurrence of anisotropy in the rotational motion of water molecules.24 Namely, water molecules rotate more slowly in a certain molecular direction but rotate faster in the other molecular directions. Anisotropy in the rotational motion of water has been also found in water in polymer networks and around ions,64,65 emphasizing the effect of the complex environment. The rotational motions of a water molecule in all three directions cannot be independent, so that DR,Q shows the combined behaviors of DR,H and DR,P. Interestingly, we do not find the anisotropic rotation of water molecules with NO3−. For all three rotations DR decreases upon increasing the salt concentration. Thus, we conclude that the occurrence of the anisotropic rotation of water molecules depends on the type of anion. For NO3−, water molecules in the superconcentrated limit can still be hydrogen-bonded to each other by simultaneously acting as one HB donor and one HB acceptor, even though a large amount of ions exists. This affects how water molecules rotate in the surrounding conditions with NO3−.
(t),24,56,57 as shown in Fig. 10. For DR,H, the rotational motion of water molecules decreases upon increasing the salt concentration, representing the stronger attractive interaction between a Li+ ion and the oxygen atom of water molecules for higher salt concentrations. For DR,P, we can categorize the rotational motion of water molecules into two groups according to the type of anions. For TFSI−, FSI− and OTf−, DR,P in the superconcentrated limit is larger than DR,P at low concentration. This behavior of DR,P is in contrast to DR,H with respect to the salt concentration, indicating an occurrence of anisotropy in the rotational motion of water molecules.24 Namely, water molecules rotate more slowly in a certain molecular direction but rotate faster in the other molecular directions. Anisotropy in the rotational motion of water has been also found in water in polymer networks and around ions,64,65 emphasizing the effect of the complex environment. The rotational motions of a water molecule in all three directions cannot be independent, so that DR,Q shows the combined behaviors of DR,H and DR,P. Interestingly, we do not find the anisotropic rotation of water molecules with NO3−. For all three rotations DR decreases upon increasing the salt concentration. Thus, we conclude that the occurrence of the anisotropic rotation of water molecules depends on the type of anion. For NO3−, water molecules in the superconcentrated limit can still be hydrogen-bonded to each other by simultaneously acting as one HB donor and one HB acceptor, even though a large amount of ions exists. This affects how water molecules rotate in the surrounding conditions with NO3−.
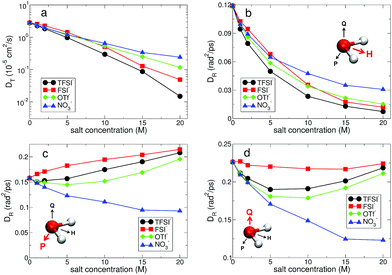 | ||
Fig. 10 Translational and rotational diffusion constants of water molecules. (a) Translational diffusion constant DT of water molecules as a function of salt concentration for different anions in a semi-log plot. For subdiffusive translations, we estimate DT by simply calculating the slope of TMSD (divided by 6) in Fig. 9. (b) Rotational diffusion constant DR,H of a polarization vector ![[H with combining right harpoon above (vector)]](https://www.rsc.org/images/entities/i_char_0048_20d1.gif) of a water molecule as a function of salt concentration for different anions. (c) Rotational diffusion constant DR,P of a principal vector of a water molecule as a function of salt concentration for different anions. (c) Rotational diffusion constant DR,P of a principal vector ![[P with combining right harpoon above (vector)]](https://www.rsc.org/images/entities/i_char_0050_20d1.gif) of a water molecule as a function of salt concentration. (d) Rotational diffusion constant DR,Q of a principal vector of a water molecule as a function of salt concentration. (d) Rotational diffusion constant DR,Q of a principal vector ![[Q with combining right harpoon above (vector)]](https://www.rsc.org/images/entities/i_char_0051_20d1.gif) of a water molecule as a function of salt concentration. of a water molecule as a function of salt concentration. | ||
4 Conclusions
When ions are dissolved in water, the structural and dynamic properties of water deviate from neat water depending on the ion–water interaction. For bulk water, the complex HB network structure spans the whole space and it critically determines the unique and unusual characteristics of water. As the amount of ions increases, the ion–water interaction becomes significant instead of the water–water interaction. The HB network in water would be interrupted by ions and the disrupted HB network would be also different from bulk water. For a dilute concentration, the presence of ions can be treated as a perturbation to the properties of bulk water. In the superconcentrated limit, however, the situation surrounding the water molecules cannot be simply described by the perturbative ion–water interaction. In this case, the existence of the full HB connectivity in water is generally obscured. Since the structure of the system will be mainly affected by ions, the simple role of ions as structure-makers or structure-breakers in the HB network has to be modified. The local electric field induced by cations and anions will suppress or enhance the translational and rotational dynamics of water molecules. Because the ion–water interaction also depends on the type of ions, the ion type would be of great importance to the properties of water.In this work, we have performed molecular dynamics simulations to investigate the effects of anions on the structural and dynamical properties of water for various salt concentrations, especially focusing on superconcentrated conditions. For most structural properties of water, we found that the anionic effects at low concentration are negligible. In other words, the existence of different anions does not affect the structural properties of water at low concentration. We found that at the low salt concentration of 1 M the HB features in water, such as the HB structure and HB dynamics, do not exhibit any dependence on the anion species as well. The different properties of water in the presence of different anions appear above a certain concentration of ions. In the superconcentrated limit, most properties of water show a strong dependence on the type of anion. For the anionic hydration dynamics as well as the HB dynamics of water, we found that there are two opposite behaviors with respect to the salt concentration and two timescales are needed for fully describing the dependence of the fast and slow dynamics on the salt concentration. In contrast, for the hydration dynamics associated with an Li cation we observed the same behavior of the cationic hydration dynamics on short and long timescales. Those different behaviors are ascribed to the different mechanisms to form and break the bonds of water molecules with cations and anions. In addition, the existence of different anions would affect the translational and rotational dynamics of water molecules, such as the appearance of the subdiffusive translation and anisotropic rotation of water molecules.
We believe that our results will provide a comprehensive molecular picture on the effects of anions on aqueous electrolytes for a wide range of salt concentrations. Particularly, our results will give broader understanding of the properties of water in various environments. Even though our results are based on the lithium cation, we think that our results are able to be extended to more general cases. Finally, we believe that our results will give an insight into chemical and biological processes as well as lithium ion batteries.
Conflicts of interest
There are no conflicts to declare.Notes and references
- D. Eisenberg and W. Kauzmann, The Structure and Properties of Water, Oxford University Press, New York, 1969 Search PubMed.
- P. H. Poole, F. Sciortino, U. Essmann and H. E. Stanley, Nature, 1992, 360, 324–328 CrossRef CAS.
- O. Mishima, Phys. Rev. Lett., 2000, 85, 334–336 CrossRef CAS PubMed.
- D. T. Limmer and D. Chandler, J. Chem. Phys., 2011, 135, 134503 CrossRef PubMed.
- J. C. Palmer, F. Martelli, Y. Liu, R. Car, A. Z. Panagiotopoulos and P. G. Debenedetti, Nature, 2014, 510, 385–388 CrossRef CAS PubMed.
- L. Liu, S.-H. Chen, A. Faraone, C. W. Yen and C. Y. Mou, Phys. Rev. Lett., 2005, 95, 117802 CrossRef PubMed.
- L. Xu, P. Kumar, S. V. Buldyrev, S.-H. Chen, P. H. Poole, F. Sciortino and H. E. Stanley, Proc. Natl. Acad. Sci. U. S. A., 2005, 102, 16558–16562 CrossRef CAS PubMed.
- P. Kumar, S. V. Buldyrev, S. R. Becker, P. H. Poole, F. W. Starr and H. E. Stanley, Proc. Natl. Acad. Sci. U. S. A., 2007, 104, 9575–9579 CrossRef CAS.
- S. Han and C. C. Yu, Phys. Rev. E, 2012, 85, 051201 CrossRef PubMed.
- K. H. Kim, A. Späh, H. Pathak, F. Perakis, D. Mariedahl, K. Amann-Winkel, J. A. Sellberg, J. H. Lee, S. Kim, J. Park, K. H. Nam, T. Katayama and A. Nilsson, Science, 2017, 358, 1589–1593 CrossRef CAS PubMed.
- P. Kumar, Z. Yan, L. Xu, M. G. Mazza, S. V. Buldyrev, S.-H. Chen, S. Sastry and H. E. Stanley, Phys. Rev. Lett., 2006, 97, 177802 CrossRef PubMed.
- P. Ball, Chem. Rev., 2008, 108, 74–108 CrossRef CAS PubMed.
- P. M. Wiggins, Microbiol. Rev., 1990, 54, 432–449 CAS.
- M. F. Kropman and H. J. Bakker, Science, 2001, 291, 2118–2120 CrossRef CAS PubMed.
- J. D. Smith, R. J. Saykally and P. L. Geissler, J. Am. Chem. Soc., 2007, 129, 13847–13856 CrossRef CAS PubMed.
- R. Mancinelli, A. Botti, F. Bruni, M. A. Ricci and A. K. Soper, J. Phys. Chem. B, 2007, 111, 13570–13577 CrossRef CAS PubMed.
- H. J. Bakker, Chem. Rev., 2008, 108, 1456–1473 CrossRef CAS.
- Y. Marcus, Chem. Rev., 2009, 109, 1346–1370 CrossRef CAS PubMed.
- M. D. Fayer, D. E. Moilanen, D. Wong, D. E. Rosenfeld, E. E. Fenn and S. Park, Acc. Chem. Res., 2009, 42, 1210–1219 CrossRef CAS PubMed.
- K. J. Tielrooij, N. Garcia-Araez, M. Bonn and H. J. Bakker, Science, 2010, 328, 1006–1009 CrossRef CAS PubMed.
- A. Oleinikova and T. Brovchenko, Phys. Chem. Chem. Phys., 2012, 14, 5686–5694 RSC.
- Y.-L. S. Tse, G. A. Voth and T. A. Witten, J. Chem. Phys., 2015, 142, 184905 CrossRef PubMed.
- A. P. Gaiduk and G. Galli, J. Phys. Chem. B, 2017, 8, 1496–1502 CAS.
- S. Han, Sci. Rep., 2018, 8, 9347 CrossRef PubMed.
- Y. Chen, H. I. Okur, N. Gomopoulos, C. Macias-Romero, P. S. Cremer, P. B. Petersen, G. Tocci, D. M. Wilkins, C. Liang, M. Ceriotti and S. Roke, Sci. Adv., 2016, 2, e15019891 Search PubMed.
- L. Belloni, D. Borgis and M. Levesque, J. Phys. Chem. Lett., 2018, 9, 1985–1989 CrossRef CAS PubMed.
- R. W. Gurney, Ionic Processes in solution, McGraw-Hill, New York, 1953 Search PubMed.
- F. Hofmeister, Arch. Exp. Pathol. Pharmakol., 1888, XXV, 1–30 Search PubMed.
- J. S. Kim, Z. Wu, A. R. Morrow, A. Yethiraj and A. Yethiraj, J. Phys. Chem. B, 2012, 116, 12007–12013 CrossRef CAS PubMed.
- Y. Ding, A. A. Hassanali and M. Parrinello, Proc. Natl. Acad. Sci. U. S. A., 2013, 111, 3310–3315 CrossRef PubMed.
- Y. Yamada and A. Yamada, J. Electrochem. Soc., 2015, 162, A2406–A2423 CrossRef CAS.
- L. Suo, O. Borodin, T. Gao, M. Olguin, J. Ho, X. Fan, C. Luo, C. Wang and K. Xu, Science, 2015, 350, 938–943 CrossRef CAS PubMed.
- L. Suo, O. Borodin, W. Sun, X. Fan, C. Yang, F. Wang, T. Gao, Z. Ma, M. Schroeder, A. von Cresce, S. M. Russell, M. Armand, C. A. Angell, K. Xu and C. Wang, Angew. Chem., Int. Ed., 2016, 55, 7136–7141 CrossRef CAS PubMed.
- L. Suo, F. Han, X. Fan, H. Liu, K. Xu and C. Wang, J. Mater. Chem. A, 2016, 4, 6639–6644 RSC.
- O. Borodin, L. Suo, M. Gobet, X. Ren, F. Wang, A. Faraone, J. Peng, M. Olguin, M. Schroeder, M. S. Ding, E. Gobrogge, A. von Wald Cresce, S. Munoz, J. A. Dura, S. Greenbaum, C. Wang and K. Xu, ACS Nano, 2017, 11, 10462–10471 CrossRef CAS PubMed.
- H. Kim, J. Hong, K.-Y. Park, H. Kim, S.-W. Kim and K. Kang, Chem. Rev., 2014, 114, 11788–11827 CrossRef CAS PubMed.
- K. Xu, Chem. Rev., 2004, 104, 4303–4417 CrossRef CAS PubMed.
- D. Aurbach, Y. Talyosef, B. Markovsky, E. Markevich, E. Zinigrad, L. Asraf, S. J. Gnanaraj and H.-J. Kim, Electrochim. Acta, 2004, 50, 247–254 CrossRef CAS.
- K. Xu, Chem. Rev., 2014, 114, 11503–11618 CrossRef CAS PubMed.
- H. J. C. Berendsen, J. R. Grigera and T. P. Straatsma, J. Phys. Chem., 1987, 91, 6269–6271 CrossRef CAS.
- S. J. Plimpton, J. Comp. Physiol., 1995, 117, 1–19 CrossRef CAS.
- J. N. Canongia Lopes and A. A. H. Pádua, J. Phys. Chem. B, 2004, 108, 16893–16898 CrossRef.
- S. Han, M. Y. Choi, P. Kumar and H. E. Stanley, Nat. Phys., 2010, 6, 685–689 Search PubMed.
- S. Han, Phys. Rev. E, 2011, 84, 051204 CrossRef PubMed.
- A. Luzar and D. Chandler, Nature, 1996, 379, 55–57 CrossRef CAS.
- F. W. Starr, J. K. Nielsen and H. E. Stanley, Phys. Rev. Lett., 1999, 82, 2294–2297 CrossRef CAS.
- S. Han, P. Kumar and H. E. Stanley, Phys. Rev. E, 2009, 79, 041202 CrossRef PubMed.
- A. W. Omta, M. F. Kropman, S. Woutersen and H. J. Bakker, Science, 2003, 301, 347–349 CrossRef CAS PubMed.
- C. J. Fecko, J. D. Eaves, J. J. Loparo, A. Tokmakoff and P. L. Geissler, Science, 2003, 301, 1698–1702 CrossRef CAS PubMed.
- O. Markovitch and N. Agmon, J. Chem. Phys., 2008, 129, 084505 CrossRef PubMed.
- S. Han, Sci. Rep., 2017, 7, 46718 CrossRef PubMed.
- D. Laage and J. T. Hynes, Proc. Natl. Acad. Sci. U. S. A., 2007, 104, 11167–11172 CrossRef CAS PubMed.
- J. Thøgersen, J. Réhault, M. Odelius, T. Ogden, N. K. Jena, S. J. Knak Jensen, S. R. Keiding and J. Helbing, J. Phys. Chem. B, 2013, 117, 3376–3388 CrossRef PubMed.
- S. Han, P. Kumar and H. E. Stanley, Phys. Rev. E, 2008, 77, 030201 CrossRef PubMed.
- P. Kumar and S. Han, J. Chem. Phys., 2012, 137, 114510 CrossRef PubMed.
- S. Kämmerer, W. Kob and R. Schilling, Phys. Rev. E, 1997, 56, 5450–5461 CrossRef.
- M. G. Mazza, N. Giovambattista, F. W. Starr and H. E. Stanley, Phys. Rev. Lett., 2006, 96, 057803 CrossRef PubMed.
- S. R. Becker, P. H. Poole and F. W. Starr, Phys. Rev. Lett., 2006, 97, 055901 CrossRef PubMed.
- G. Hummer, J. C. Rasaiah and J. P. Noworyta, Nature, 2001, 414, 188–190 CrossRef CAS PubMed.
- A. Striolo, Nano Lett., 2006, 6, 633–639 CrossRef CAS PubMed.
- B. Mukherjee, P. K. Maiti, C. Dasgupta and A. K. Sood, ACS Nano, 2010, 4, 985–991 CrossRef CAS PubMed.
- L. E. Bove, S. Klotz, Th. Strässle, M. Koza, J. Teixeira and A. M. Saitta, Phys. Rev. Lett., 2013, 111, 185901 CrossRef CAS.
- A. B. Farimani, Y. Wu and N. R. Aluru, Phys. Chem. Chem. Phys., 2013, 15, 17993–18000 RSC.
- J. Mijović and H. Zhang, J. Phys. Chem. B, 2004, 108, 2557–2563 CrossRef.
- K. J. Tielrooij, S. T. van der Post, J. Hunger, M. Bonn and H. J. Bakker, J. Phys. Chem. B, 2011, 115, 12638–12647 CrossRef CAS PubMed.
| This journal is © The Royal Society of Chemistry 2019 |

