 Open Access Article
Enhanced charge separation and transport efficiency induced by vertical slices on the surface of carbon nitride for visible-light-driven hydrogen evolution†
Qian Yangab,
Zehao Liab,
ChengCheng Chenab,
Zhengguo Zhangab and
Xiaoming Fang *ab
*ab
aKey Laboratory of Enhanced Heat Transfer and Energy Conservation, The Ministry of Education, School of Chemistry and Chemical Engineering, South China University of Technology, Guangzhou 510640, China. E-mail: cexmfang@scut.edu.cn; Fax: +86 20 87113870; Tel: +86 20 87112997
bGuangdong Engineering Technology Research Center of Efficient Heat Storage and Application, South China University of Technology, Guangzhou 510640, China
First published on 5th February 2019
Abstract
Numerous vertical slices with thicknesses in the range of 100–200 nm were generated from pristine bulk carbon nitride (BCN) via an ammonium nitrate (NH4NO3)-assisted hydrothermal treatment. Compared with the structure of BCN, the obtained novel hierarchical structure consisted of more uniform mesopores (2–14 nm) and possessed enlarged specific surface area of 64.1 m2 g−1. It was elucidated that both NH4+ and NO3− play important roles in the formation of the vertical slices, which could not only create an acidic environment for the hydrothermal system but also form hydrogen bonds with the surface tri-s-triazine units of BCN simultaneously. It was found that the hierarchical structure exhibited enhanced crystallinity, reduced photoluminescence emission, and increased photocurrent response. Consequently, a hydrogen evolution rate of 1817.9 μmol h−1 g−1 was achieved by the hierarchical structure, which was 4.1 times higher than that of BCN. The hydrothermal post-treatment strategy explored in this work provides a new insight into the design and modification of polymeric carbon nitride for generating a hierarchical porous microstructure.
1 Introduction
With the increasing demand for clean and sustainable energy resources, hydrogen energy from water splitting using sunlight has become even more important in the context of environmental problems and energy crisis caused by the dominant consumption of fossil fuels.1,2 The design of highly efficient and robust photocatalysts responsive to visible light is the prerequisite for ideal photocatalytic conversion.3,4 Graphitic carbon nitride (g-C3N4), a promising metal-free photocatalyst, has triggered great interest due to its easy synthesis, outstanding physicochemical stability, appropriate optical bandgap, and earth-abundant sources.5,6 Typical synthetic routes of g-C3N4 depend on the thermal polymerization of melamine, dicyanamide, urea and other C/N/H-containing precursors, producing 2D layered carbon nitride comprising intralayer π–π conjugated electron systems and hydrogen bonding.7,8 Nonetheless, the photocatalytic performance of pristine carbon nitride is relatively low on account of the inherently limited lateral edges with less access to reactants, high recombination rate of charge carriers and insufficient light absorption.9Until now, various strategies have been explored to improve the photocatalytic activity of g-C3N4, and these include copolymerization with organic molecules,10 element doping,11,12 heterojunction construction,13,14 and nanostructure engineering.15,16 Among these methods, the nanostructure engineering approach has been widely considered as an efficient measure owing to its merits of improved light absorption, promoted diffusion kinetics, and increased specific surface areas. By means of hard and soft templates, numerous nanostructures with different morphologies, such as mesoporous nanoarchitectures,17 hollow nanospheres,18 and nanorod arrays,19 have been developed. Although tailoring the structure and porosity with the assistance of sacrificial templates is flexible and versatile, the hazardous chemical etchants and toxic gases accompanying the removal of templates restrict the practical use. Besides, residual carbon and impure organics after calcining soft templates may cause detrimental side effects. Consequently, more attention has been paid lately to the introduction of template-free methods, which are efficient strategies to yield porous g-C3N4, and these include the traditional self-assembled supramolecular preorganization approach and variation of the reaction parameters and reaction medium without templates.20 The simplest template-free approach is the exfoliation of bulk g-C3N4 via hydrothermal treatments to yield porous g-C3N4 with thin layers, which is inspired by the delamination of graphene.21 Very recently, Xie et al.22 employed the hydrothermal method combined with the use of ammonium chloride to produce a semicrystalline heptazine-based melon with abundant order–disorder interfaces, resulting in boosted exciton dissociation. Yu et al.23 demonstrated that the post-hydrothermal treatment of bulk g-C3N4 can promote local spatial charge separation and proton activation for polymeric carbon nitride by surface hydroxylation. Apparently, the post-treatment strategy shows great promise for improving the photocatalytic performance of bulk g-C3N4 by modifying its surface features and microstructure24–27 and thus, more investigations need to be conducted.
In the current work, an NH4NO3-aided hydrothermal post-treatment was explored for the first time for modifying bulk g-C3N4 derived from melamine to produce a novel hierarchical structure with vertical slices. The effects of the addition amount of NH4NO3 and the hydrothermal duration on the morphologies and microstructures were investigated, and the optimal process conditions for preparing the hierarchical structure were obtained. Furthermore, the formation mechanism of the vertical slices was elucidated. Moreover, the optical and photoelectrochemical properties of the obtained hierarchical structure were measured together with evaluation of its photocatalytic activity. It was found that compared with the structure of bulk g-C3N4, the hierarchical structure with vertical slices possessed an enlarged specific surface area as well as better charge carrier diffusion, thereby leading to improved photocatalytic hydrogen evolution. This work sheds light on the design and modification of polymeric carbon nitride for producing a hierarchical porous microstructure.
2 Experimental section
2.1 Sample preparation
 | ||
| Scheme 1 Schematic illustration of the synthesis of the vertical edge carbon nitride (H-CN) (the blue balls, grey balls and red balls represent N atoms, H atoms and O atoms, respectively). | ||
Moreover, to investigate the effect of the addition amount of ammonium nitrate, 0.2 g of the as-prepared BCN was mixed with different amounts (0.4, 0.8, or 1.6 g) of ammonium nitrate, followed by the hydrothermal treatment at 160 °C for 24 h. The obtained samples were weighed and named as CN0.4 g, CN0.8 g and CN1.6 g. In addition, several samples were prepared from the mixture consisting of 0.2 g of the as-prepared BCN and 1.2 g of ammonium nitrate by the hydrothermal treatment at 160 °C for different durations (8, 16, or 32 h), which were designated as CN-8, CN-16, and CN-32, respectively. To investigate the influence of hydrothermal temperature, several samples were prepared from the mixture consisting of 0.2 g of the as-prepared BCN and 1.2 g of ammonium nitrate by the hydrothermal treatment for 24 h at different temperatures (120, 140, and 180 °C).
2.2 Characterizations
The X-ray diffraction (XRD) patterns were recorded by a Rigaku D/max-2200 V diffractometer with Cu Kα1 radiation. The low-angle XRD patterns were obtained using Ni-filtered Cu Kα radiation on a Rigaku D/max-3A diffractometer. Fourier transform infrared (FT-IR) spectra were measured using a Bruker Vector 33 FT-IR spectrometer with KBr as a reference sample. 13C solid-state nuclear magnetic resonance (NMR) spectra were recorded using a Bruker Avance III 600 spectrometer. The morphologies of the samples were determined using field emission scanning electron microscopy (SEM, Hitachi SU8220) and transmission electron microscopy (TEM, JEOL JEM-2100F). The surface composition and chemical state were analyzed on an ESCALab220i-XL electron spectrometer from VG Scientific using 300 W Al Kα radiation. The binding energies were referenced to the C 1s line at 284.6 eV from adventitious carbon. Elemental analysis for carbon and nitrogen was carried out on a vario EL cube elemental analyzer. The UV-Vis diffuse reflectance spectra (DRS) were obtained using a Hitachi U-3010 UV-Vis spectrophotometer with an integrating sphere using BaSO4 as a reference sample. Photoluminescence (PL) emission spectra were obtained using a Hitachi F-4600 fluorescence spectrometer with the excitation wavelength of 370 nm. Time resolved fluorescence measurements (FLS 980, Edinburgh Instruments, UK) were employed to detect the fluorescence lifetimes of the samples. Specific surface areas and pore distribution were evaluated by using the BET method at 77 K (N2 absorption–desorption isotherms, ASAP 2020, Micromeritics). Solid electron paramagnetic resonance (EPR) signals were acquired using a Bruker model A300 spectrometer at room temperature.2.3 Evaluation of photocatalytic H2 evolution performance
The photocatalytic hydrogen production experiments were performed in a reactor with a quartz glass lid and a sealed glass gas circulation system. A 300 W Xe lamp (Microsolar 300, Beijing PerfectLight Technology Co., Ltd) with a 420 nm cutoff filter served as the visible light source, and H2PtCl6 (Pt, 0.2 wt%) was employed as a precursor of cocatalyst. Then, 50 mg of each catalyst was dispersed in 100 mL of 10 vol% triethanolamine aqueous solution. Before irradiation, the suspension and the gas circulation were degassed for 1 hour, and the reactor was kept at 278 K by flowing cooling water during the photoredox reaction. The amount of generated hydrogen was quantitatively analyzed every hour by an online gas chromatograph (GC7600, Tian Mei) equipped with a thermal conductive detector and nitrogen as carrier gas.2.4 Photoelectrochemical measurements
Photoelectrochemical measurements were conducted in a conventional three-electrode cell system, in which a piece of Pt sheet and an Ag/AgCl electrode were used as the counter electrode and reference electrode, respectively. The working electrode was fabricated by coating the as-prepared catalyst slurry onto a piece of clean FTO glass using a doctor-blading technique, followed by annealing at 150 °C for 2 h. The light ON/OFF photocurrent response was conducted by a 300 W Xe lamp with a 420 nm cutoff and recorded every 10 seconds. The Mott–Schottky curves were gauged at frequencies of 8, 10 and 12 kHz in 0.5 M Na2SO4 aqueous solution.3 Results and discussion
3.1 Morphology and formation mechanism
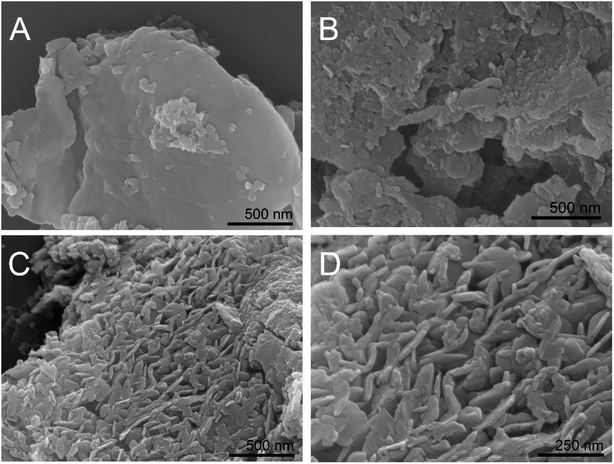
BCN was hydrothermally treated in the presence of ammonium nitrate, and the obtained samples exhibited some changes in morphology, as observed from the SEM images in Fig. 1. BCN showed chunk morphology with very smooth surfaces and edges (Fig. 1A), while BCN-ht obtained from the hydrothermal treatment in the presence of only water broke into smaller pieces with a rough surface and many holes (Fig. 1B). Interestingly, unlike BCN and BCN-ht, H-CN consisted of many vertical slices with thicknesses in the range of around 100–200 nm (Fig. 1C and D), which seemed to grow on the bulk sheet of BCN. It can be inferred that these vertically aligned slices may provide more active sites and shorter diffusion length from the interior to edges and reactants for photogenerated carriers, which favored photocatalytic surface reactions. The differences in morphologies between BCN-ht and H-CN implied that the growth of the vertical slices is related to the presence of ammonium nitrate in the hydrothermal treatment system. This can be further verified by the SEM images (Fig. S1†) of the samples obtained from the hydrothermal treatment in the presence of different amounts of NH4NO3. Only a few vertical slices were formed when 0.4 g of NH4NO3 was added, and their number increased as the NH4NO3 content was increased from 0.4 g to 0.8 g. With further increase in the amount of NH4NO3 from 1.2 g to 1.6 g, the slices became thicker.Furthermore, as seen in the TEM images in Fig. 2A and B, BCN is a compact solid and BCN-ht turns into a porous structure. After the hydrothermal treatment aided by ammonium nitrate, H-CN showed a holey structure with the vertical slices perpendicular to the bulk sheet of BCN (Fig. 2C–E), which was in accordance with the above SEM observations. Mesopores can be clearly observed in the TEM image, as displayed in Fig. S2.† As shown in Fig. 2F, the HR-TEM image of H-CN displays the characteristic spacing of 0.322 nm, which can be indexed to the (002) lattice plane. From the SAED (selected area electron diffraction) pattern (the inset of Fig. 2F), three bright diffraction rings can be clearly observed, revealing the relatively high crystallinity of H-CN. The elemental mappings (Fig. S3†) confirmed that both C and N are present and homogeneously distributed.
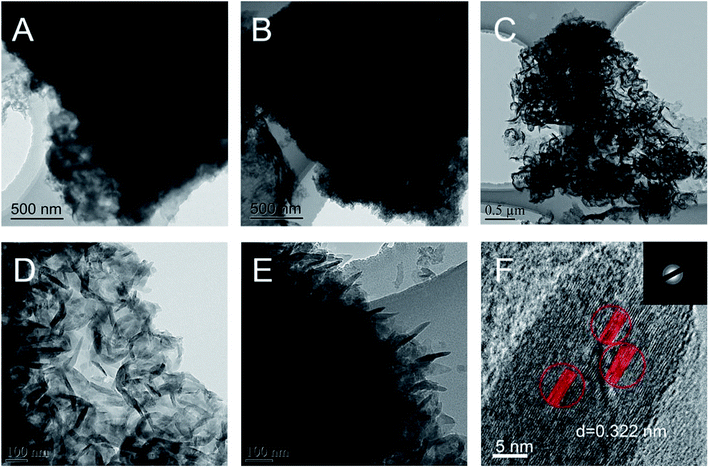 | ||
| Fig. 2 TEM images of BCN (A), BCN-ht (B) and H-CN (C–F) ((D and E) enlarged view and side view; (F) HRTEM image; the inset in (F) SAED pattern). | ||
In order to elucidate the formation mechanism of H-CN, BCN was also hydrothermally treated in the presence of NH4NO3 (1.2 g) at 160 °C for different durations. The SEM images of the obtained samples are shown in Fig. S4.† As the hydrothermal duration was increased from 8 h to 16 h, a few vertical slices were observed. However, with further increase in hydrothermal duration from 24 h to 32 h, the vertical slices disappeared and a loose microstructure was formed instead. These results indicated that the hydrothermal treatment duration plays a significant role in the formation of the vertical slices. Moreover, BCN was also hydrothermally treated at 160 °C for 24 h in the presence of NH4Cl or NaNO3 at the same molar concentration as that of NH4NO3, and the obtained samples were observed using SEM as well. Neither of the two samples consisted of vertical slices (Fig. S5†). These results suggested that both NH4+ and NO3− are needed for generating vertical slices during the hydrothermal treatment of BCN.
Based on the aforementioned results, the formation mechanism of the hierarchical g-C3N4 structure can be speculated as follows. Please note that NH4NO3 has strong acid–weak basic character. The addition of NH4NO3 to the hydrothermal treatment system could create an acidic aqueous environment with pH value of 4.96 (Fig. S6†). It has been reported that N atoms in the triazine ring change from original hydrogen bonding accepting sites into hydrogen bonding donating sites under acidic conditions (pH = 2.0–5.1).28 The protonated N atoms in the triazine ring thus can form hydrogen bonds and electrostatic interactions with oxoanions such as NO3−, where three oxygen atoms act as hydrogen bonding acceptors.29 Consequently, in the hydrothermal system containing NH4NO3, the N atoms in the surface triazine ring of BCN could bond with NO3− to form the vertical slices. This mechanism can be verified by two contrasting experiments by replacing NH4NO3 with NH4Cl or NaNO3. NH4Cl cannot provide NO3− for bonding with the N atoms in the surface triazine ring of BCN though it also has the strong acid–weak basic character. Although NaNO3 can provide NO3−, it cannot create an acidic aqueous environment due to its strong acid–strong basic character. As a result, no vertical slices were found on the two samples prepared from the hydrothermal treatment systems containing NH4Cl or NaNO3. Moreover, the weights of the samples prepared from BCN by the hydrothermal treatments under different conditions could also provide evidence that NO3− was involved in the hydrothermal reaction. As listed in Table S1,† the weights of the samples increase with the addition of NH4NO3.
3.2 Microstructures
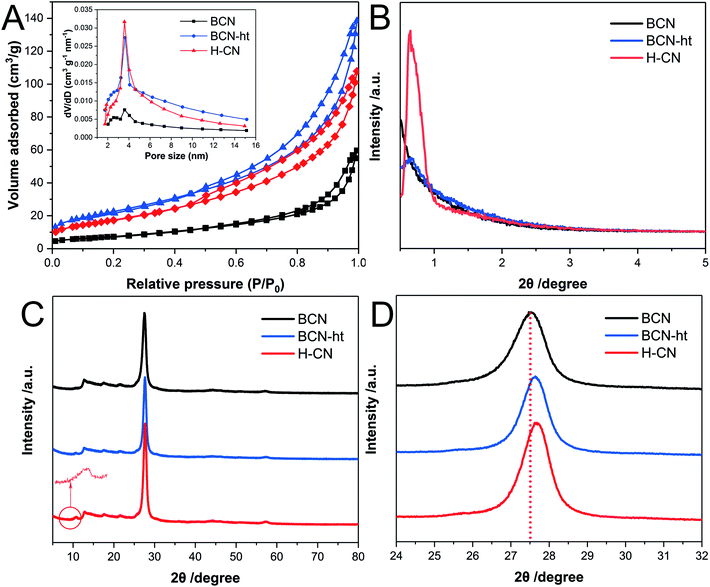
The pore distribution and BET surface area of the as-prepared samples were analyzed by N2 adsorption–desorption isotherms at 77 K. As shown in Fig. 3A, H-CN exhibits typical IV isotherms with characteristic capillary condensation as a result of a large amount of mesopores. Specifically, the isotherms of H-CN displayed an H3-type hysteresis loop, suggesting the presence of slit-like pores owing to the overlapping of plate-like nanosheets.6 Moreover, the addition amount of NH4NO3 has an effect on the BET surface area of the obtained samples. When no NH4NO3 was added, BCN-ht exhibited BET surface area of 82.9 m2 g−1; for the sample obtained at the NH4NO3 loading of 0.4 g, its BET surface area significantly decreased to 74.1 m2 g−1. The BET surface areas of the samples obtained with different amounts of NH4NO3 were 65.1 m2 g−1 for 0.8 g, 64.1 m2 g−1 for 1.2 g and 63.7 m2 g−1 for 1.6 g, indicating just slight decreases in BET surface areas of the three samples. These variations in BET surface areas were related to the formation of the vertical slices during the hydrothermal treatment. For BCN-ht, due to the hydrothermal treatment only using water, its BET surface area increased from 24.1 m2 g−1 for BCN to 82.9 m2 g−1. This increase in BET surface area was attributed to its loose microstructure, which originated from the etching effect of the hydrothermal treatment.21 When NH4NO3 was added into the hydrothermal system, NO3− could bond with the N atoms of the surface triazine ring of BCN to form vertical slices. The generation of the vertical slices was responsible for the decrease in BET surface area. As the amount of NH4NO3 was increased from 0.4 to 0.8 g, significant decrease in BET surface area occurred, corresponding to more generated slices, as shown in Fig. S1.† In addition, the corresponding pore size distribution plot (the inset of Fig. 3A) was derived from the adsorption branches of the isotherms by using the Barrett–Joyner–Halenda (BJH) method; it shows distribution over the range of 2–14 nm. The differences in pore size distributions between BCN and BCN-ht/H-CN implied that hydrothermal treatments favor the generation of mesoporous structures. Moreover, H-CN retained a higher sharp peak as compared to those of BCN and BCN-ht, implying its more uniform mesoporous network.30,31 The microstructures of these samples could be further characterized by their low-angle powder XRD diffraction patterns. As shown in Fig. 3B, unlike BCN and BCN-ht, H-CN shows a strong diffraction peak at 0.637° with d-spacing of 13.9 nm, indicating the existence of mesopores with well-ordered structures.31Fig. 3C shows the XRD patterns of BCN, BCN-ht and H-CN. All three samples exhibit two typical diffraction peaks located at 13.0° (100) and 27.6° (002), representing the in-plane structural packing of heptazine motifs and interlayer periodic stacking of conjugated aromatic systems, respectively.32 On one hand, the low angle reflection peaks at 13.0° (100) for H-CN and BCN-ht were the same as that for BCN, implying that their in-plane structural packing of heptazine motifs was well retained after the hydrothermal treatments with or without NH4NO3. On the other hand, in comparison to BCN, BCN-ht and H-CN showed a slight shift of the (002) peak from 27.5° to 27.7° (Fig. 3D), revealing the decrease in the gallery distance between the adjacent layers. It has been reported that the predominant transport channel of charge carriers is perpendicular to interplanar sheets in 2D network polymeric carbon nitrides.33,34 Due to closer stacking, the diffusion length along the interplanar channels is shorter and may further benefit the electron mobility and charge separation efficiency.35 Moreover, compared with BCN and BCN-ht, H-CN exhibited narrower width of the (002) diffraction peak, suggesting its enhanced crystallinity, which was consistent with the result of SAED analysis. Furthermore, a new peak located at 10.7° was found in the XRD patterns of BCN-ht and H-CN, which may originate from the extended distance of partial intraplanar packing motifs and more short-range atomic order as a result of the hydrothermal process.36
Solid-state 13C nuclear magnetic resonance was also used to identify the chemical states and structural differences of samples. Fig. 4A presents two distinct peaks at approximately 165 and 157 ppm for BCN, BCN-ht and H-CN, which are assigned to the CN2(NHx) and CN3 moieties.37 These spectra confirm the formation of a poly(tri-s-triazine) structure. Compared with the observations for BCN, the broadened signals of high and low fields for BCN-ht and H-CN indicate increased structural disorder resulting from the hydrothermal treatment. Furthermore, it could be found that the signal at 165 ppm of H-CN shifted to higher field relative to that of BCN-ht, which was attributed to fewer NHx species and additional O atoms in the system.32
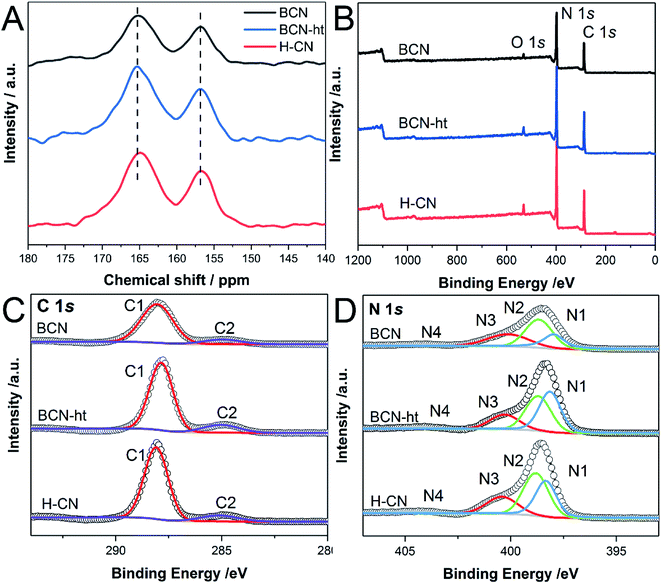 | ||
| Fig. 4 (A) Solid-state 13C NMR spectra; XPS spectra of (B) survey, (C) high resolution C 1s, and (D) N 1s of BCN, BCN-ht and H-CN. | ||
The chemical compositions and elemental valence states were investigated by XPS. As shown in Fig. 4B, XPS survey spectra of BCN, BCN-ht and H-CN contain three typical peaks at 288.1, 397.5, and 531.6 eV, corresponding to C, N and O. The O 1s signal might be ascribed to C–O and O–H originating from absorbed CO2 and H2O molecules, respectively, on the surface of the samples.30,36 All samples showed similar binding energies of C 1s and N 1s, demonstrating the presence of basic tri-s-triazine units, except for a slight shift caused by their different surface electronic states.38 As shown in the C 1s spectra in Fig. 4C, the peaks located at 288.1 and 285.0 eV can be assigned to N–C![[double bond, length as m-dash]](https://www.rsc.org/images/entities/char_e001.gif) N and C
N and C![[double bond, length as m-dash]](https://www.rsc.org/images/entities/char_e001.gif) C, respectively.39 Compared with BCN, BCN-ht showed decrease in the peak area ratio of N–C
C, respectively.39 Compared with BCN, BCN-ht showed decrease in the peak area ratio of N–C![[double bond, length as m-dash]](https://www.rsc.org/images/entities/char_e001.gif) N and C
N and C![[double bond, length as m-dash]](https://www.rsc.org/images/entities/char_e001.gif) C from 6.81 to 5.68. For H-CN obtained from the hydrothermal treatment in the presence of NH4NO3, the peak area ratio of N–C
C from 6.81 to 5.68. For H-CN obtained from the hydrothermal treatment in the presence of NH4NO3, the peak area ratio of N–C![[double bond, length as m-dash]](https://www.rsc.org/images/entities/char_e001.gif) N and C
N and C![[double bond, length as m-dash]](https://www.rsc.org/images/entities/char_e001.gif) C further increased to 7.56, implying the existence of fewer graphitic carbon species. The high-resolution N 1s spectra of BCN, BCN-ht and H-CN consist of four main peaks centered at 398.4, 398.8, 400.4 and 404.7 eV associated with C
C further increased to 7.56, implying the existence of fewer graphitic carbon species. The high-resolution N 1s spectra of BCN, BCN-ht and H-CN consist of four main peaks centered at 398.4, 398.8, 400.4 and 404.7 eV associated with C![[double bond, length as m-dash]](https://www.rsc.org/images/entities/char_e001.gif) N–C, N–(C)3, N–H and charge effect, respectively (Fig. 4D).40 Quantitative analysis of XPS data revealed that the surface C/N molar ratio of H-CN (0.696) was much smaller than 0.850 of BCN and 0.847 of BCN-ht (Table S2†). Furthermore, the C/N molar ratios of these samples were also obtained by elemental analysis. As listed in Table S3,† H-CN has C/N molar ratio of 0.647, which is just slightly smaller than 0.656 of BCN and 0.649 of BCN-ht. These results suggested that the differences in the C/N molar ratios of the three samples only exist in their surfaces rather than the whole samples.
N–C, N–(C)3, N–H and charge effect, respectively (Fig. 4D).40 Quantitative analysis of XPS data revealed that the surface C/N molar ratio of H-CN (0.696) was much smaller than 0.850 of BCN and 0.847 of BCN-ht (Table S2†). Furthermore, the C/N molar ratios of these samples were also obtained by elemental analysis. As listed in Table S3,† H-CN has C/N molar ratio of 0.647, which is just slightly smaller than 0.656 of BCN and 0.649 of BCN-ht. These results suggested that the differences in the C/N molar ratios of the three samples only exist in their surfaces rather than the whole samples.
3.3 Optical and photoelectrochemical properties
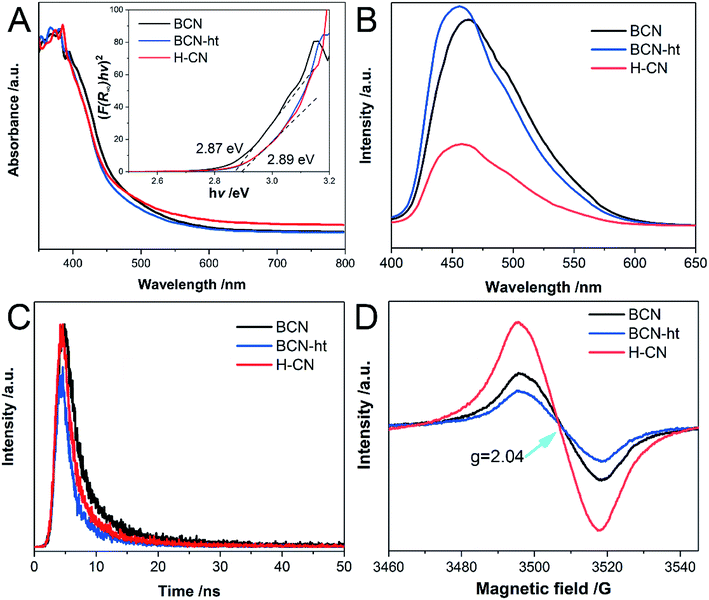
To examine the optical absorption of the as-prepared samples, their DRS spectra were obtained. As shown in Fig. 5A, the light absorptions of both BCN-ht and H-CN display a blue-shift relative to that of BCN mainly owing to the quantum size effect resulting from the hydrothermal top-down methods.30,41 In addition, an increased absorption band in the visible-light region was found for H-CN, which may be caused by the introduced carbon vacancies and multiple light reflections of the porous structure.42 Based on the DRS spectra, the band gaps of all the samples were acquired using the Kubelka–Munk method (α = hν = A(hν − Eg)n, n = 2).6 As shown in the inset of Fig. 5A, H-CN and BCN-ht exhibit band gap of around 2.89 eV, which is larger than 2.87 eV of BCN.The radiative recombination of charge carriers was studied using the photoluminescence (PL) spectra, as shown in Fig. 5B. Compared to BCN, BCN-ht and H-CN exhibit a blue shift in emission, which is consistent with their band gap values. More significantly, unlike the slightly increased emission for BCN-ht, a much lower intensity of the PL peak was observed for H-CN compared to that for BCN, suggesting its remarkably suppressed photo-generated electron–hole recombination.43 This phenomenon may be due to the formation of vertical slices as well as enhanced crystallinity of H-CN. A slight increase in PL emission for BCN-ht may be attributed to some structural defects generated by the hydrothermal treatment in the presence of only water,30 which can serve as charge recombination centers. Moreover, the PL emission intensity varied with the amount of NH4NO3, and the lowest emission intensity was achieved by H-CN obtained from the hydrothermal treatment system containing 1.2 g of NH4NO3 (Fig. S7†).
Furthermore, time-resolved fluorescence spectra obtained at the corresponding wavelengths of emission peaks provide quantitative information regarding the photo-generated charge carrier lifetimes of the samples. As shown in Fig. 5C, the curves can be fitted well to a double-exponential decay function. Table S4† lists the average lifetimes and the % contribution determined from the fitting PL decay data. In detail, the short lifetimes were 2.08, 1.33 and 1.56 ns and the long lifetimes were 7.24, 4.80 and 5.96 ns for BCN, BCN-ht and H-CN, respectively. Clearly, the two samples obtained from the hydrothermal treatments showed decreased singlet exciton lifetimes relative to BCN mostly due to their enhanced crystallinity.35 However, compared with BCN-ht, H-CN obtained with the assistance of ammonium nitrate possessed a prolonged radiative lifetime, which was associated with its improved separation efficiency of charge carriers.42 It can be inferred that the photogenerated carriers of H-CN possess higher possibility to participate in photocatalytic reactions before the combination.44
Moreover, the electronic delocalization and charge transfer properties of the samples were examined by EPR. As shown in Fig. 5D, all samples exhibit a single Lorentzian line with g value of 2.04 in a magnetic field ranging from 3460 to 3545 G, which is derived from the delocalized unpaired electrons on aromatic π-conjugated systems.45 A decreased EPR signal for BCN-ht was found as compared to that of BCN, which was consistent with its enhanced PL emission. More recombination could lead to reduction in electron pairs. Significantly, compared to BCN and BCN-ht, H-CN exhibited an enhanced EPR signal, revealing its higher concentration of lone electron pairs that favored the photocatalytic process.
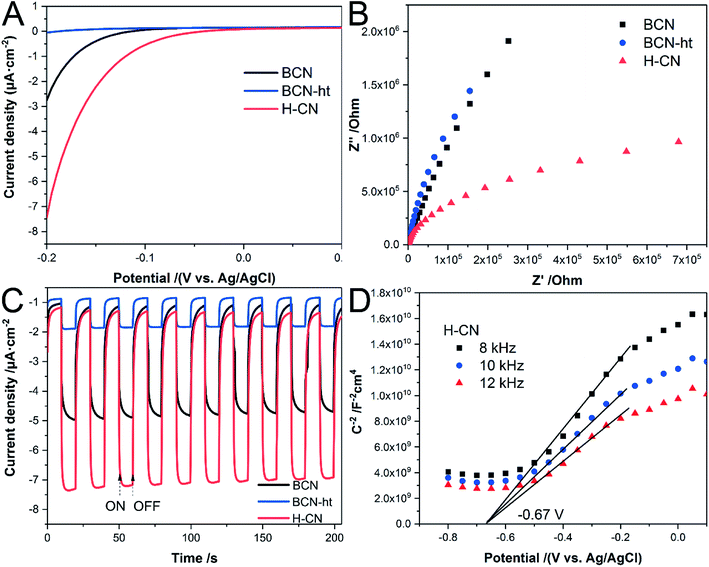
In addition, the samples were fabricated into electrodes, and their photoelectrochemical properties were measured. As plotted in Fig. 6A, the onset potential of H-CN is more positive than those of BCN and BCN-ht, and it exhibits rapid increase in the cathodic current with the applied negative voltage. It was revealed that H-CN could trigger redox reactions more easily, potentially benefiting its photocatalytic activity.46 It can be seen from the EIS Nyquist plot (Fig. 6B) that H-CN exhibits a much smaller arc radius, indicating reduced electric resistance and faster interface charge transport.41 Moreover, as shown in Fig. 6C, the transient photocurrent of H-CN is nearly 1.5-fold and 3.8-fold higher than those of BCN and BCN-ht under a negative bias voltage (−0.1 V vs. Ag/AgCl), demonstrating that H-CN possesses higher density of photogenerated electrons and holes.38 Besides, the reproducible response of photocurrent during the repeatedly switched ON/OFF cycles of intermittent irradiation suggested good photoelectrochemical stability for as-prepared samples. Fig. 6D displays the Mott–Schottky curves for H-CN at different frequencies of 8, 10, and 12 kHz, where the positive slopes demonstrate its n-type feature.22 From the extrapolated x-axis intercept, the flat band potential of H-CN was about −0.67 V with reference to the Ag/AgCl electrode; BCN and BCN-ht exhibited flat band potentials at −0.60 V and −0.64 V, respectively, as shown in Fig. S8.† The downshift of the conduction band for H-CN indicated a promoted thermodynamic driving force for the reduction reactions.42
3.4 Photocatalytic hydrogen evolution performance
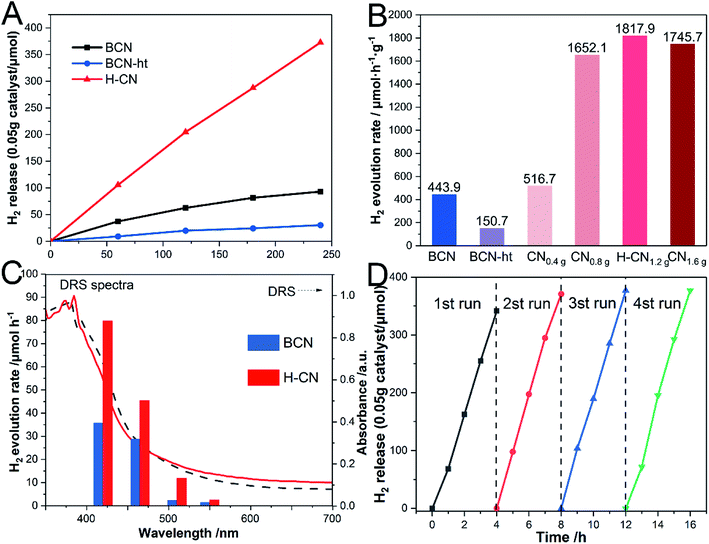
The photocatalytic performance of the as-prepared g-C3N4 samples was investigated through photocatalytic hydrogen evolution in triethanolamine aqueous solution under visible-light illumination (λ > 420 nm) and 0.2 wt% Pt serving as the co-catalyst. As shown in Fig. 7A, BCN and BCN-ht exhibit HER values of 443.9 and 150.7 μmol h−1 g−1, respectively. Significantly, H-CN presented a significantly enhanced H2 evolution rate of 1817.9 μmol h−1 g−1, which was 4.1 and 12.1 times higher than those of BCN and BCN-ht. Moreover, HER values varied with the amount of NH4NO3; this trend was consistent with that of PL emission intensity (Fig. S7†). It can be inferred that the recombination of the photogenerated carriers plays a critical role in affecting the hydrogen evolution reaction. The highest HER of H-CN was associated with its lowest PL emission. The lowest HER of BCN-ht was attributed to the loss of the amino groups originating from the interaction between g-C3N4 and water during the hydrothermal process, which was disadvantageous for the photocatalytic activity.8 It was revealed that the formation of vertical slices with high crystallinity on the surface greatly improved the photocatalytic activity of H-CN because of more exposure of active reaction sites and enhanced charge carrier transfer. In addition, the effect of the hydrothermal temperature on the photocatalytic activity of the obtained samples was also investigated. As displayed in Fig. S9,† the sample prepared at 160 °C exhibits the highest HER.Fig. 7C presents the wavelength dependence of HER on H-CN. It was clear that HER of H-CN mostly matched its DRS, indicating that the HER reaction was indeed driven by light absorption. To evaluate the stability and durability of H-CN, the time course of HER reaction was monitored, as shown in Fig. 7D. After four consecutive runs (16 h), there was no significant decrease in the photocatalytic performance under the same conditions, verifying the excellent stability of photocatalytic hydrogen production for H-CN. This observation was further confirmed by SEM and TEM images of the used H-CN, as shown in Fig. S10.† No significant change in the microstructure was found for H-CN, and the edge-on lamellas on the surface could be clearly observed; this suggested that H-CN possessed good structural stability.
4 Conclusions
In summary, a hierarchical g-C3N4 nanostructure with vertically aligned slices was synthesized by the ammonium nitrate-assisted hydrothermal post-treatment. In comparison with pristine graphitic carbon nitride, the as-obtained H-CN sample possessed a large specific surface area and more active sites. In particular, the separation efficiency of electron–hole pairs was promoted, as revealed by transient photocurrent, linear sweep voltammetry, electrochemical impedance spectra, and photoluminescence. The photocatalytic hydrogen evolution rate measured for H-CN under visible light was 1817.9 μmol h−1 g−1, which was 4.1 and 12.1 times higher than those of BCN and BCN-ht. The present work provides a promising approach for g-C3N4 modification in application of solar to energy conversion systems.Conflicts of interest
There are no conflicts of interest to declare.Acknowledgements
This work was financially supported by the National Natural Science Foundation of China (21276088 and U1507201) and Natural Science Foundation of Guangdong Province (2014A030312009).References
- X. Chen, L. Liu, P. Y. Yu and S. S. Mao, Science, 2011, 331, 746–750 CrossRef CAS PubMed.
- Q. Wang, T. Hisatomi, Q. Jia, H. Tokudome, M. Zhong, C. Wang, Z. Pan, T. Takata, M. Nakabayashi, N. Shibata, Y. Li, I. D. Sharp, A. Kudo, T. Yamada and K. Domen, Nat. Mater., 2016, 15, 611–615 CrossRef CAS PubMed.
- R. Kuriki, T. Ichibha, K. Hongo, D. Lu, R. Maezono, H. Kageyama, O. Ishitani, K. Oka and K. Maeda, J. Am. Chem. Soc., 2018, 140, 6648–6655 CrossRef CAS PubMed.
- A. Puthirath Balan, S. Radhakrishnan, C. F. Woellner, S. K. Sinha, L. Deng, C. d. l. Reyes, B. M. Rao, M. Paulose, R. Neupane, A. Apte, V. Kochat, R. Vajtai, A. R. Harutyunyan, C.-W. Chu, G. Costin, D. S. Galvao, A. A. Martí, P. A. van Aken, O. K. Varghese, C. S. Tiwary, A. Malie Madom Ramaswamy Iyer and P. M. Ajayan, Nat. Nanotechnol., 2018, 13, 602–609 CrossRef CAS PubMed.
- X. Wang, K. Maeda, A. Thomas, K. Takanabe, G. Xin, J. M. Carlsson, K. Domen and M. Antonietti, Nat. Mater., 2009, 8, 76–80 CrossRef CAS PubMed.
- J. Ran, T. Y. Ma, G. Gao, X.-W. Du and S. Z. Qiao, Energy Environ. Sci., 2015, 8, 3708–3717 RSC.
- L. Seyfarth, J. Seyfarth, B. V. Lotsch, W. Schnick and J. Senker, Phys. Chem. Chem. Phys., 2010, 12, 2227–2237 RSC.
- X. Wang, K. Maeda, X. Chen, K. Takanabe, K. Domen, Y. Hou, X. Fu and M. Antonietti, J. Am. Chem. Soc., 2009, 131, 1680–1681 CrossRef CAS PubMed.
- Y. Matsumoto, S. Ida and T. Inoue, J. Phys. Chem. C, 2008, 112, 11614–11616 CrossRef CAS.
- G. Peng, L. Xing, J. Barrio, M. Volokh and M. Shalom, Angew. Chem., 2018, 57, 1186–1192 CrossRef CAS PubMed.
- Y. R. Guo, T. X. Chen, Q. Liu, Z. G. Zhang and X. M. Fang, J. Phys. Chem. C, 2016, 120, 25328–25337 CrossRef CAS.
- S. Z. Hu, X. Y. Qu, P. Li, F. Wang, Q. Li, L. J. Song, Y. F. Zhao and X. X. Kang, Chem. Eng. J., 2018, 334, 410–418 CrossRef CAS.
- Q. Liu, Y. Guo, Z. Chen, Z. Zhang and X. Fang, Appl. Catal., B, 2016, 183, 231–241 CrossRef CAS.
- Q. Liu, T. Chen, Y. Guo, Z. Zhang and X. Fang, Appl. Catal., B, 2016, 193, 248–258 CrossRef CAS.
- Z. Tong, D. Yang, Z. Li, Y. Nan, F. Ding, Y. Shen and Z. Jiang, ACS Nano, 2017, 11, 1103–1112 CrossRef CAS PubMed.
- C. Lv, Y. Qian, C. Yan, Y. Ding, Y. Liu, G. Chen and G. Yu, Angew. Chem., Int. Ed., 2018, 57, 10246–10250 CrossRef CAS PubMed.
- Y. Zheng, L. Lin, X. Ye, F. Guo and X. Wang, Angew. Chem., Int. Ed., 2014, 53, 11926–11930 CrossRef CAS PubMed.
- J. H. Sun, J. S. Zhang, M. W. Zhang, M. Antonietti, X. Z. Fu and X. C. Wang, Nat. Commun., 2012, 3, 1139 CrossRef.
- X. H. Li, J. S. Zhang, X. F. Chen, A. Fischer, A. Thomas, M. Antonietti and X. C. Wang, Chem. Mater., 2011, 23, 4344–4348 CrossRef CAS.
- J. X. Xu, S. W. Cao, T. Brenner, X. F. Yang, J. G. Yu, M. Antonietti and M. Shalom, Adv. Funct. Mater., 2015, 25, 6265–6271 CrossRef CAS.
- Q. Liu, X. Wang, Q. Yang, Z. Zhang and X. Fang, Appl. Catal., B, 2018, 225, 22–29 CrossRef CAS.
- H. Wang, X. Sun, D. Li, X. Zhang, S. Chen, W. Shao, Y. Tian and Y. Xie, J. Am. Chem. Soc., 2017, 139, 2468–2473 CrossRef CAS PubMed.
- S. Yu, J. Li, Y. Zhang, M. Li, F. Dong, T. Zhang and H. Huang, Nano Energy, 2018, 50, 383–392 CrossRef CAS.
- C. M. Li, F. Raziq, C. Liu, Z. J. Li, L. Q. Sun and L. Q. Jing, Appl. Surf. Sci., 2015, 358, 240–245 CrossRef CAS.
- H. Ma, S. Zhao, S. Li and N. Liu, RSC Adv., 2015, 5, 79585–79592 RSC.
- S. Hu, L. Ma, Y. Xie, F. Li, Z. Fan, F. Wang, Q. Wang, Y. Wang, X. Kang and G. Wu, Dalton Trans., 2015, 44, 20889–20897 RSC.
- B. Luo, R. Song and D. W. Jing, Chem. Eng. J., 2018, 332, 499–507 CrossRef CAS.
- A. Weinstabl, W. H. Binder, H. Gruber and W. Kantner, J. Appl. Polym. Sci., 2001, 81, 1654–1661 CrossRef CAS.
- J.-S. Shen, Q.-G. Cai, Y.-B. Jiang and H.-W. Zhang, Chem. Commun., 2010, 46, 6786–6788 RSC.
- Q. H. Liang, Z. Li, Z. H. Huang, F. Y. Kang and Q. H. Yang, Adv. Funct. Mater., 2015, 25, 6885–6892 CrossRef CAS.
- G. P. Mane, S. N. Talapaneni, K. S. Lakhi, H. Ilbeygi, U. Ravon, K. Al-Bahily, T. Mori, D. H. Park and A. Vinu, Angew. Chem., 2017, 56, 8481–8485 CrossRef CAS PubMed.
- Y. O. Wang, M. K. Bayazit, S. J. A. Moniz, Q. S. Ruan, C. C. Lau, N. Martsinovich and J. W. Tang, Energy Environ. Sci., 2017, 10, 1643–1651 RSC.
- C. Merschjann, S. Tschierlei, T. Tyborski, K. Kailasam, S. Orthmann, D. Hollmann, T. Schedel-Niedrig, A. Thomas and S. Lochbrunner, Adv. Mater., 2015, 27, 7993–7999 CrossRef CAS PubMed.
- C. Merschjann, T. Tyborski, S. Orthmann, F. Yang, K. Schwarzburg, M. Lublow, M. C. Lux-Steiner and T. Schedel-Niedrig, Phys. Rev. B, 2013, 87, 205204 CrossRef.
- G. Zhang, G. Li, Z. A. Lan, L. Lin, A. Savateev, T. Heil, S. Zafeiratos, X. Wang and M. Antonietti, Angew. Chem., Int. Ed., 2017, 56, 13445–13449 CrossRef CAS PubMed.
- Q. Han, B. Wang, J. Gao, Z. Cheng, Y. Zhao, Z. Zhang and L. Qu, ACS Nano, 2016, 10, 2745–2751 CrossRef CAS PubMed.
- B. V. Lotsch, M. Döblinger, J. Sehnert, L. Seyfarth, J. Senker, O. Oeckler and W. Schnick, Chem.–Eur. J., 2007, 13, 4969–4980 CrossRef CAS PubMed.
- H. W. Huang, K. Xiao, N. Tian, F. Dong, T. R. Zhang, X. Du and Y. H. Zhang, J. Mater. Chem. A, 2017, 5, 17452–17463 RSC.
- Z. Zhou, J. Wang, J. Yu, Y. Shen, Y. Li, A. Liu, S. Liu and Y. Zhang, J. Am. Chem. Soc., 2015, 137, 2179–2182 CrossRef CAS PubMed.
- P. Niu, G. Liu and H. M. Cheng, J. Phys. Chem. C, 2012, 116, 11013–11018 CrossRef CAS.
- N. N. Meng, J. Ren, Y. Liu, Y. Huang, T. Petit and B. Zhang, Energy Environ. Sci., 2018, 11, 566–571 RSC.
- P. Yang, H. Ou, Y. Fang and X. Wang, Angew. Chem., Int. Ed., 2017, 56, 3992–3996 CrossRef CAS PubMed.
- X. Q. Fan, L. X. Zhang, R. L. Cheng, M. Wang, M. L. Li, Y. J. Zhou and J. L. Shi, ACS Catal., 2015, 5, 5008–5015 CrossRef CAS.
- T. Xiong, W. L. Cen, Y. X. Zhang and F. Dong, ACS Catal., 2016, 6, 2462–2472 CrossRef CAS.
- B. Han, K. A. Stoerzinger, V. Tileli, A. D. Gamalski, E. A. Stach and Y. Shao-Horn, Nat. Mater., 2017, 16, 121–126 CrossRef CAS PubMed.
- X. Zou, X. Huang, A. Goswami, R. Silva, B. R. Sathe, E. Mikmekova and T. Asefa, Angew. Chem., Int. Ed., 2014, 53, 4372–4376 CrossRef CAS PubMed.
Footnote |
| † Electronic supplementary information (ESI) available. See DOI: 10.1039/c8ra09576k |
| This journal is © The Royal Society of Chemistry 2019 |

