 Open Access Article
Creative Commons Attribution 3.0 Unported Licence
Preparation of a novel fracturing fluid with good heat and shear resistance†
Yang Zhang ,
Jincheng Mao
 *,
Tao Xu,
Zhaoyang Zhang*,
Bo Yang,
Jinhua Mao and
Xiaojiang Yang*
State Key Laboratory of Oil & Gas Reservoir Geology and Exploitation, Southwest Petroleum University, Chengdu, Sichuan, China. E-mail: jcmao@swpu.edu.cn; 790016605@qq.com; 815675989@qq.com
First published on 9th January 2019
Abstract
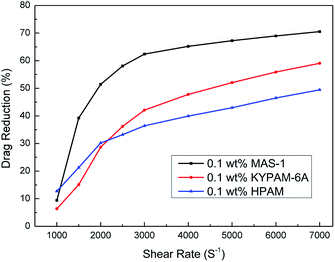
A new terpolymer (MAS-1) was created by copolymerizing acrylamide (AM), acrylic acid (AA), and 4-isopropenylcarbamoyl-benzene sulfonic acid (AMBS). Thermogravimetric analysis (TGA) suggested that MAS-1 has better heat resistance and meets the requirements for a fracturing fluid at 200 °C. X-ray diffraction (XRD), and conductivity tests showed that MAS-1 has good water solubility. The viscosity of the fracturing fluids containing MAS-1 was found to be about 135 mPa s after 120 min at 170 s−1 and 150 °C. SEM images and the determination of viscoelasticity showed that MAS-1 has a dense and robust spatial network structure in the fracturing fluid. The sedimentation velocity of the proppant was 0.0528 cm min−1 at 90 °C. When enough ammonium persulfate was added to yield approximately 0.10 wt%, the viscosity of the broken fluid was 4.5 mPa s, and the gel broken fluid was transparent without visible residue. In addition, the fracturing fluid did little damage to the reservoir. The drag reduction rate of MAS-1 was always higher than KYPAM-6A and HPAM with the shear rate ranging from 1000 s−1 to 7000 s−1. Therefore, this fracturing fluid could be an alternative for low permeability reservoir stimulation.
Introduction
With the development of the oil and gas industry, low-permeability reservoirs account for an increasing proportion of the total oil and gas resources.1–3 In order to successfully exploit these resources, reservoir stimulation must be carried out. Hydraulic fracturing is a technique widely adopted to stimulate the production of low-permeability oil and gas wells.4–7 It has been used in well stimulation for more than 40 years.8 As an indispensable component of fracking, fracturing fluid ultimately affects the success or failure of fracking.9,10 In the last decade, domestic and foreign scholars have conducted extensive research on fracturing fluids. Various fracturing fluid systems have been investigated, such as guar gum fracturing fluid, polymer fracturing fluid, foam fracturing fluid, acid-based fracturing fluid, emulsified fracturing fluid, oil-based fracturing fluid and VES fracturing fluid.11 Meanwhile, because of their low frictional resistance, good sand-suspension, and lower filter loss, guar gum and polymer-based fracturing fluids are the main fracturing fluids used in oilfields.12–14However, from a field operational point of view, guar gum-based fracturing fluids usually have the disadvantages of high insoluble residue, poor shear resistance, and large damage to reservoirs due to the plugging of pore throats. Hence, it difficult to use guar gum fracturing fluids in high-temperature and low-permeability oil and gas wells.15 Not only that, because guar gum is mainly imported from places such as Pakistan, India, and Brazil, the availability and price of guar gum is subject to fluctuations. Moreover, synthetic polymers have the advantages of strong thickening ability, good gel stability, strong ability to carry sand, insensitivity to bacteria, less residue formation, and low damage to reservoirs.15–18 Nevertheless, polymer-based fracturing fluids are unstable at high temperatures and high shear rates. In addition, the water solubility of synthetic polymers is poor compared to viscoelastic surfactants. Based on the early work with fracturing fluids, it was believed that the heat-resistance and shear-resistance of polymers could be improved by introducing a benzene ring, and the water solubility of polymers could be improved by introducing strongly hydrophilic groups, such as sulfonate and carboxyl groups. Naturally, the terpolymer MAS-1 was synthesized by copolymerizing acrylamide (AM), acrylic acid (AA), and 4-isopropenylcarbamoyl-benzene sulfonic acid (AMBS). The benzene ring improves the rigidity of the polymer, which will keep the main chain of the polymer stretched in solution, giving the polymer solution an excellent resistance to temperature and shear.
In addition, organic zirconium is used to crosslink with the polymer. This further improves the temperature and shear resistance of the fracturing fluid, allowing the fracturing fluid to transport the proppant deeply into the cracks. Using MAS-1 in fracturing fluids could improve the stimulation efficiency of fracking, which could greatly increase the production of oil and gas wells. Therefore, it is important to investigate this fracturing fluid as an alternative for low-permeability reservoir stimulation.
Experimental
Materials
Acrylamide (AM), acrylic acid (AA), sodium hydroxide, 2,2′-azobis (2-methylpropionamide) dihydrochloride (V50), ammonium persulfate and HPAM (Mw = 16–18 × 106) were purchased from the chemical market. KYPAM-6A having 26.4% degree of hydrolysis, Mw = 25.14 × 10⁶, was purchased from the Hengju Oil Field Chemical Reagents Co., Ltd. (Beijing, China). 4-Isopropenylcarbamoyl-benzene sulfonic acid (AMBS) is a functional monomer prepared in our lab. Zirconium crosslinking agent (Zr-CL) was prepared in our lab by chelating zirconium oxychloride octahydrate with triethanolamine and glycerol at a certain temperature. All chemicals were of analytical reagent grade and were utilized without further purification.Measurements and fluid preparation
The detailed experimental procedures can be found in the ESI.†
Results and discussion
Synthesis of MAS-1
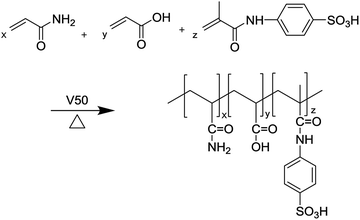
Certain proportions of acrylamide (AM), acrylic acid (AA), and 4-isopropenylcarbamoyl-benzene sulfonic acid (AMBS) were added into a 100 mL beaker in deionized water under an inert nitrogen atmosphere. The pH value was adjusted to 7.0 by sodium hydroxide. Copolymerization was allowed to be initiated by a certain amount of V50 at 50 °C for 4 h. Then, the polymer was obtained and cut into small pieces, which were dried at 50 °C under a vacuum desiccator for approximately 10 h after being purified repeatedly with ethanol, and named it as MAS-1. The synthesis process is shown in Scheme 1.Optimal synthesis conditions of MAS-1
The variation in the apparent viscosity of 0.3 wt% copolymer solutions was determined by a single variable method with different synthetic conditions. All these experiments are based on a neutral pH solution, a polymerization time of 4 h, and an acrylamide and acrylic acid molar ratio of 80![[thin space (1/6-em)]](https://www.rsc.org/images/entities/char_2009.gif) :
:![[thin space (1/6-em)]](https://www.rsc.org/images/entities/char_2009.gif) 20. The viscosities were measured with a ZNN-D6 viscometer at room temperature (25 °C). The experimental results were shown in Fig. 1.
20. The viscosities were measured with a ZNN-D6 viscometer at room temperature (25 °C). The experimental results were shown in Fig. 1.
Fig. 1(a) shows that increasing the amount of AMBS increased the viscosity of the MAS-1 solutions at first, followed by decreasing viscosity. We concluded that adding AMBS appropriately enhanced the polymer rigidity and the ability to form hydrogen bonds within and between the molecules. However, once the amount of AMBS was higher than 0.8 mol%, the steric effect of AMBS slowed the polymerization, resulting in a decrease in molecular weight and viscosity.
Fig. 1(b) shows that the maximum viscosity was reached with a 22 wt% total monomer concentration. We concluded that when the total monomer concentration was less than 22 wt%, the probability of collision among monomers was lower, leading to slower polymerization and the faster termination of free radicals, causing the molecular weights of the polymers to be lower. When the monomer concentration exceeded 22 wt%, the increase in collision frequency released a lot of heat that could accelerate the rate of polymerization, chain transfer, and chain termination. These reactions will reduce the molecular weight of the copolymer, which will lead the viscosity of the copolymer solutions to decrease.
Fig. 1(c) shows that increasing the amount of initiator led to an initial increase in the viscosity of MAS-1 solutions, followed by a decrease. We concluded that initially increasing the amount of initiator led to more free radicals, causing a greater conversion rate of the monomers while also causing the viscosity of the MAS-1 solution to increase. However, when the concentration of the initiator was too high, an excessive number of free radicals were generated by the decomposition of the initiator, which also accelerated the rate of polymerization, chain transfer, and chain termination. Meanwhile, the temperature of the gel rose sharply, causing an implosion of the gel and decreasing the apparent viscosity of the copolymer solution.
Fig. 1(d) shows an inverted V-shaped curve between the viscosity and temperature. We concluded that the rate of production of free radicals was inhibited by the low temperature. Increasing the temperature increased the number of free radicals, which also increased the rate of reaction and accelerated the rate of chain termination. However, at temperatures higher than 50 °C, many free radicals were produced during a very short time, resulting in a lower chain propagation rate, and the molecular weight of the final product decreased.
Therefore, we concluded that the optimum synthesis conditions for MAS-1 were (1) a total monomer concentration of 22 wt%, (2) a pH of 7.0 for the solution, (3) an initiator concentration of 0.05% of the mass of the total monomers, (4) a reaction temperature of 50 °C, (5) an AM to AA mole ratio of 80![[thin space (1/6-em)]](https://www.rsc.org/images/entities/char_2009.gif) :
:![[thin space (1/6-em)]](https://www.rsc.org/images/entities/char_2009.gif) 20, and (6) an AMBS concentration of 0.8% of the moles of the total monomers.
20, and (6) an AMBS concentration of 0.8% of the moles of the total monomers.
Characterization
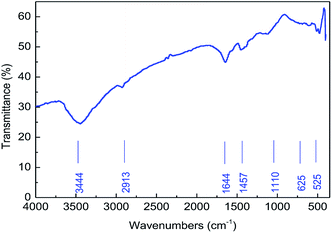
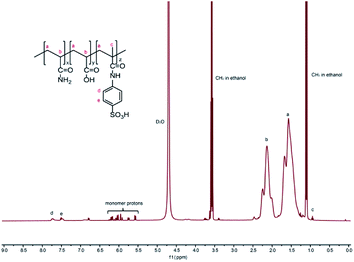
![[double bond, length as m-dash]](https://www.rsc.org/images/entities/char_e001.gif) O in the amide group. The peak at 1110 cm−1 is due to the stretching vibration of –C–N–. The peak at 1110 cm−1 comes from the stretching vibration of –C–C–. In addition, the absorption peaks at around 625 cm−1 and 525 cm−1 in the IR spectrum were due to the stretching vibrations of the –SO32− groups. The results verified that the synthesized polymer was consistent with the designed MAS-1.
O in the amide group. The peak at 1110 cm−1 is due to the stretching vibration of –C–N–. The peak at 1110 cm−1 comes from the stretching vibration of –C–C–. In addition, the absorption peaks at around 625 cm−1 and 525 cm−1 in the IR spectrum were due to the stretching vibrations of the –SO32− groups. The results verified that the synthesized polymer was consistent with the designed MAS-1.
Thermogravimetric analysis (TGA) of MAS-1
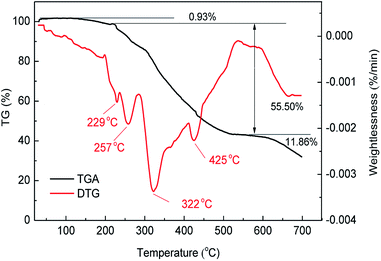
The decomposition temperature of the polymer mostly depends on the thermal stability of the groups of macromolecules. Fig. 4 shows the thermogravimetric analysis (TGA) and differential thermogravimetry (DTG) curves for MAS-1. It can be seen that when the weight loss rate is 50%, the decomposition temperature is 454 °C, indicating the good thermal stability of MAS-1.19 The curves showed that MAS-1 had three stages of mass loss. The first stage was in the range of 25 °C to 217 °C with a mass loss of 0.93% due to the evaporation of intramolecular and intermolecular moisture. The second stage occurred in the temperature range of 217 °C to 579 °C with a mass loss of 55.50%. This stage could be associated with the pyrolysis temperature for the breakdown of C–N chemical bonds, the benzene and sulfonic acid groups. The final stage of the mass loss of MAS-1 appeared at above 579 °C, which can be attributed to carbonization. It should be emphasized that most of the mass loss of MAS-1 occurred well above 200 °C, indicating that MAS-1 is stable at 200 °C, suggesting that MAS-1 has better heat resistance and meets the requirement for a fracturing fluid at 200 °C.X-ray diffraction (XRD) of MAS-1
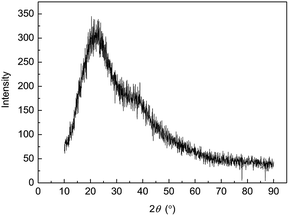
X-ray diffraction pattern analysis is another way to understand element, internal atom or molecular structure and morphology of materials. The wide-angle XRD spectrogram of MAS-1 was shown in Fig. 5. It illustrated that MAS-1 is an amorphous structure because there were no sharp peaks rather than wide diffuse peaks. MAS-1 does not absorb outside energy as crystals to destroy their spatial lattice, which made it easily dissolvable in water.Water solubility of the copolymer
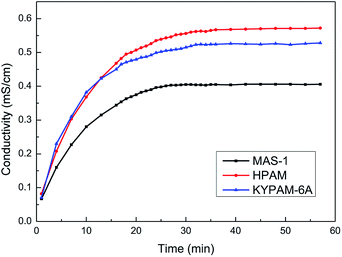
Generally, the conductance of a solution increases as a copolymer is dissolved in water continuously, and the conductivity of the solution is constant when the copolymer is dissolved completely. Therefore, a higher rate of increase in conductivity reflects a higher dissolution rate of a copolymer, which indicates that the water solubility of the polymer is better.Fig. 6 shows that the conductivity of the solution is small before the copolymer is added. As the polymer dissolves in water, the conductivity of the solution increases. Finally, the conductivity of the solution becomes constant, indicating that the copolymer dissolved completely. The dissolution times of MAS-1, hydrolyzed polyacrylamide (HPAM), and KYPAM-6A were 27 min, 39 min, and 33 min, respectively, which indicates that the water solubility of MAS-1 is better than that of HAPM or KYPAM-6A. There are two reasons for these experimental results. The molecular weight of MAS-1 is less than that of HPAM and KYPAM-6A, and the hydrophilic groups, such as sulfonate and carboxylate, in MAS-1 make the solubility of MAS-1 better than HPAM.20 The fast-dissolving property of MAS-1 is conducive to its preparation and application in hydraulic fracturing.
Shear resistance
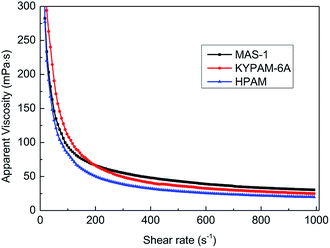
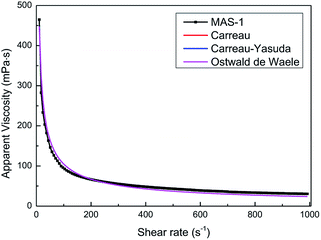
In hydraulic fracturing, fracturing fluids are subjected to greatly varying shear rates as they move from the ground pump sets to the target reservoir through pipelines. Excellent shear-resistance ensures that the fracturing fluid will maintain good viscosity and proppant suspension. Viscosity is usually used to evaluate the shear resistance of the fracturing fluids under variable shear conditions. Fig. 7 shows the results of the continuously variable shear of MAS-1, KYPAM-6A, and HPAM. It is notable that the viscosity of MAS-1 decreased more slowly than the viscosity of KYPAM-6A and HPAM as the shear rate continuously increased. At 1000 s−1, the retention rates of the viscosity of MAS-1, KYPAM-6A, and HPAM were 56.2%, 46.3%, and 45.8%, respectively. The results of the variable shear measurement demonstrated that because the bending of the polymer backbone was prevented by rigid groups introduced in MAS-1, it has a better shear-resistance than KYPAM-6A or HPAM. Therefore, the viscosity retention rate of MAS-1 was relatively higher than that of KYPAM-6A or HPAM. Furthermore, the variable shear property of the solution (0.3 wt% MAS-1) was fitted by three physical models (Carreau, Carreau-Yasuda, Ostwald de Waele), which are shown in eqn (1)–(3).21–23Carreau:
 | (1) |
Carreau-Yasuda:
 | (2) |
Ostwald de Waele:
η = K![[small gamma, Greek, dot above]](https://www.rsc.org/images/entities/i_char_e0a2.gif) n−1 n−1
| (3) |
![[small gamma, Greek, dot above]](https://www.rsc.org/images/entities/i_char_e0a2.gif) b represents the shear rate parameters, n represents the flow behavior index, λ represents the relaxation time, K represents the consistency coefficient (mPa sn), and α represents the Carreau constant.
b represents the shear rate parameters, n represents the flow behavior index, λ represents the relaxation time, K represents the consistency coefficient (mPa sn), and α represents the Carreau constant.
Fig. 8 and Table 1 show the fitting results and parameters. All fitting curves coincided with the experimental data (r = 0.9931). Therefore, the fitting parameters can reflect the actual variable shear property of the solution. In addition, wider cracks in the fracturing process can be formed when the non-Newtonian fluid (0.3 wt% MAS-1) is used to suspend the proppant because the flow behavior index is smaller (n < 1) and the consistency coefficient is larger (K = 2049).
| Fitting model | Fitting parameters | Fitting results | Correlation value (r) |
|---|---|---|---|
| Carreau | η0 | 10![[thin space (1/6-em)]](https://www.rsc.org/images/entities/char_2009.gif) 740 740 |
0.9931 |
| η∞ | 0 | ||
| γb | 0.07677 | ||
| n | 0.3227 | ||
| Carreau-Yasuda | η0 | 13![[thin space (1/6-em)]](https://www.rsc.org/images/entities/char_2009.gif) 730 730 |
0.9931 |
| η∞ | 0 | ||
| λ | −19.06 | ||
| n | 0.3547 | ||
| α | 2 | ||
| Ostwald de Waele | K | 2049 | 0.9931 |
| n | 0.3547 |
Rheological property measurement
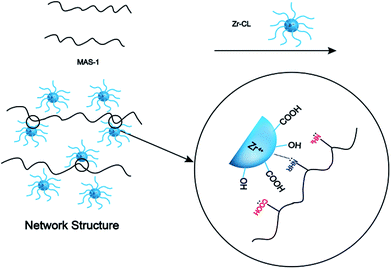
The fracturing fluid was prepared by mixing 0.3 wt% MAS-1 and 0.8 wt% Zr-CL. Then, fracturing fluid was placed into the RS600 rheometer at 150 °C and 170 s−1. Fig. 9 shows that with thermal shear, the viscosity of the fracturing fluid generally decreased at first and then increased. Later, the viscosity dropped again and eventually remained around 135 mPa s. This may be due to the reaction of Zr-CL with the MAS-1 in aqueous solution. We concluded that the weaker bonds, such as hydrogen bonds, in the polymer solution are destroyed during thermal shearing. At the same time, the chelating agents on the zirconium atoms gradually fall off, so the empty orbitals on the zirconium atoms are gradually exposed to the lone-pair electrons on the oxygen and nitrogen atoms in the MAS-1.24 Fig. 10 shows the crosslinking mechanism for MAS-1 and Zr-CL. There are some chelating bonds forming between the zirconium atoms and MAS-1. However, the chelating bonds are weaker than covalent bonds, so they are more easily broken by the thermal shear. From the macro point of view, Fig. 9 shows that the viscosity of the fracturing fluid decreases first, then increases, decreases again, and then stabilizes at about 135 mPa s after 120 min. Therefore, the fracturing fluid can maintain excellent thermo-shear stability at 150 °C. In addition, it should be emphasized that the initial viscosity of the fracturing fluid is less than 100 mPa s, which is significant for fracking, especially in deep or ultra-deep wells, because there would be less frictional resistance in the pumping process.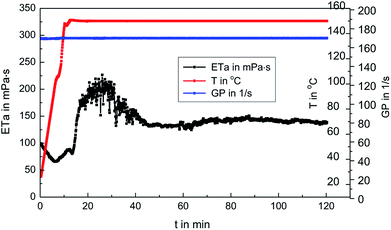 | ||
| Fig. 9 Rheological properties of 0.3 wt% MAS-1 with 0.8 wt% Zr-CL fracturing fluid at 150 °C, 170 s−1. | ||
Viscoelasticity
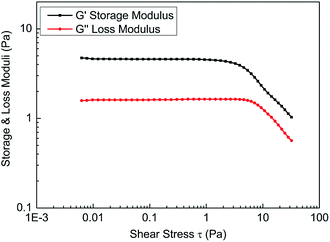
To a certain extent, the elasticity of the fracturing fluid reflects the density of the network structure in the solution. A stronger spatial network structure will result in a larger storage modulus, indicating more extensive network structures in fracturing fluids.Shear stress must be within the linear viscoelastic area during material property constant measurements, so linear viscoelastic zone measurements of the fracturing fluids should be conducted prior to the viscoelasticity measurements. Fig. 11 shows the results that were obtained through stress scanning experiments with a frequency of 1 Hz. The results show that the change in the storage modulus (G′) and loss modulus (G′′) of the fracturing fluid was small and that the ratio of storage modulus and loss modulus is 2.842 when the shear stress was less than 3.0 Pa, which indicates that the solution is in the linear viscoelastic zone. Therefore, the shear stress should be less than 3.0 Pa during the frequency scanning experiment for the fracturing fluids. For experimental convenience, frequency scanning was usually performed when the shear stress was set to 1.0 Pa.
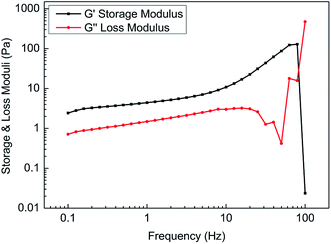
Fig. 12 shows the variation in the storage modulus and loss modulus with frequencies ranging from 0.1 Hz to 100 Hz. It is found that the storage modulus was always greater than the loss modulus with increasing scanning frequency in the linear viscoelastic zone. However, in the non-linear viscoelastic zone, the mutual entanglement among the molecular chains was destroyed, and most of the energy became thermal energy. Therefore, it is unnecessary to research the viscoelasticity of the fracturing fluids in the non-linear viscoelastic zone.
Microstructure analysis
It is well accepted that the macroscopic properties of the copolymers are determined by their microstructures. The change of the storage modulus and loss modulus of the MAS-1 fracturing fluids implies that their spatial network structure (SNS) has experienced microstructural changes. Fig. 13a and b show the SNS of the MAS-1 solution without and with the crosslinker. It is observed that the SNS of the MAS-1 solution with the crosslinker was denser than the solution without the crosslinker. This can be attributed to the chelation of the polymer with the crosslinker that makes the SNS denser than the solution without the crosslinker. From a macro point of view, the viscoelasticity and thermal stability of the polymer solution improved sharply, indicating that the MAS-1 fracturing fluid is an efficient carrier of the proppant into the cracks.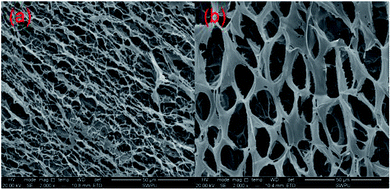 | ||
| Fig. 13 SEM images of the aggregation state of the different fluids. (a) 0.3 wt% MAS-1, (b) 0.3 wt% MAS-1 + 0.8 wt% Zr-CL. | ||
Proppant carrying capacity (PCC)
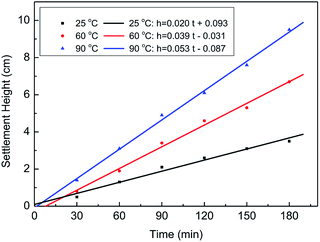
To determine the proppant carrying capacity, fracturing fluid was poured into a 50 mL cylinder with proppant (20/40 mesh), and the settlement height and time were measured at 25 °C, 60 °C, and 90 °C. Then, the settlement height and time were used to calculate the sedimentation velocities. Fig. 14 and Table 2 show that the sedimentation velocities of the proppant were 0.0194 cm min−1 at 25 °C, 0.0372 cm min−1 at 60 °C, and 0.0528 cm min−1 at 90 °C. It is clear that the sedimentation velocities of the proppant at three different temperatures were all less than 1.08 cm min−1, indicating that the fracturing fluid can meet the requirement of proppant suspension and transportation in fracking.25| Temperature (°C) | Time (min) | Height (cm) | Sedimentation rate (cm min−1) |
|---|---|---|---|
| 25 | 180 | 3.5 | 0.0194 |
| 60 | 180 | 6.7 | 0.0372 |
| 90 | 180 | 9.5 | 0.0528 |
Gel breaking evaluation
The viscosities of the fracturing fluid with different concentrations of breaker were investigated at 90 °C. Table 3 shows these results. The results show that the fracturing fluid was broken thoroughly within 3 h when amounts of 0.10 wt% APS were added. The broken fluid is transparent without any visible residues.| Breaking time (h) | Viscosity (mPa s) | |||
|---|---|---|---|---|
| 0.02 wt% APS | 0.04 wt% APS | 0.08 wt% APS | 0.10 wt% APS | |
| 0.5 | 180 | 162 | 138 | 123 |
| 1.0 | 168 | 147 | 108 | 84 |
| 1.5 | 141 | 126 | 81 | 66 |
| 2.0 | 126 | 111 | 54 | 42 |
| 2.5 | 108 | 93 | 36 | 21 |
| 3.0 | 87 | 72 | 18 | 4.5 |
Core damage
The core damage tests were measured by injecting the broken fluid into the core at 25 °C, 60 °C, and 90 °C to further detect the damage of the fracturing fluid to the formation. Table 4 shows the experimental results. The results show that the permeability damage rate was between 12.64% and 17.62%. That is to say, the damage rate of this fluid is less than the industry standard (≤30%), which indicates that the fracturing fluid does little damage to the reservoir.| Temperature (°C) | Core parameters | Core permeability (mD) | Permeability damage rate (%) | ||
|---|---|---|---|---|---|
| Diameter (cm) | Length (cm) | K1 | K2 | ||
| 25 | 2.50 | 4.25 | 4.36 | 3.81 | 12.64 |
| 60 | 2.48 | 4.64 | 4.54 | 3.74 | 17.62 |
| 90 | 2.50 | 4.50 | 3.65 | 3.08 | 15.7 |
Field-scale friction reduction evaluation
Fig. 15 shows the relationship between the shear rate and drag reduction rate for fluids with MAS-1, KYPAM-6A, and HPAM. It is clear that the drag reduction rates of fluids with MAS-1, KYPAM-6A, and HPAM increase with increasing shear rate. It is concluded that polymers form an elastic bottom layer near the inner wall of the pipeline. The elastic bottom layer thickens gradually as the shear rate increases, indicating that the drag reduction rate is increasing.26 Meanwhile, the drag reduction rate reaches a maximum value when the thickness of the elastic bottom layer reaches its limit at the center of the pipe. Moreover, it should be emphasized that the drag reduction rate of MAS-1 fluids was always higher than for KYPAM-6A or HPAM fluids, which were up to 70.5%, indicating that the MAS-1 solution could reduce friction and improve the pump efficiency in fracking. Therefore, this fluid is an alternative to presently used fracturing fluids for low permeability reservoir stimulation.Conclusions
In order to obtain a high-performance fracturing fluid, a new terpolymer (MAS-1) was synthesized by free-radical copolymerization under optimized conditions using the single variable method. MAS-1 was characterized by FT-IR. Investigations of the use of this polymer in the fracturing fluid were carried out, and the following conclusions were made:(1) TGA suggested that MAS-1 has better heat resistance and meets the requirement for a fracturing fluid at 200 °C. XRD and conductivity tests showed that MAS-1 has good water solubility. In addition, it was investigated that MAS-1 fracturing fluid maintained a viscosity of about 135 mPa s after 120 min at 170 s−1 and 150 °C. (2) Viscoelasticity determination and SEM images showed that there was a dense and robust spatial network structure in the MAS-1 fracturing fluid. The sedimentation velocity of proppant was 0.0528 cm min−1 at 90 °C. (3) When approximately 0.10 wt% ammonium persulfate was added, the viscosity of the broken fluid was 4.5 mPa s at 90 °C after 3 h. The permeability damage rate of the gel broken fluid to cores was 12.64% to 17.62%, indicating that the fracturing fluid causes little damage to the reservoir. (4) The drag reduction rate of MAS-1 solutions was always higher than for KYPAM-6A or HPAM solutions, with a shear rate ranging from 1000 s−1 to 7000 s−1, which would reduce the pump pressure and increase the efficiency of fracking.
Conflicts of interest
There are no conflicts to declare.Acknowledgements
This research is supported by the Sichuan Youth Science & Technology Foundation (2017JQ0010), the National High Technology Research & Development Program (2016ZX05053), the Key Fund Project of the Educational Commission of Sichuan Province (16CZ0008), the Explorative Project Fund (G201601) of the State Key Laboratory of Oil and Gas Reservoir Geology and Exploitation (Southwest Petroleum University).Notes and references
- B. Sun, J. Wang, Z. Wang, Y. Gao and J. Xu, J. Pet. Sci. Eng., 2018, 166, 420–432 CrossRef CAS.
- J. Wang, R. Yin, Q. Liu and Z. Fan, Adv. Pet. Explor. Dev., 2016, 10, 140–146 Search PubMed.
- Q. Zeng and J. Yao, Computation, 2015, 3, 541–557 CrossRef CAS.
- B. Ihejirika, A. Dosunmu and C. Eme, Performance Evaluation of Guar Gum as a Carrier Fluid for Hydraulic Fracturing, Society of Petroleum Engineers, 2015 Search PubMed.
- D. Kekacs, Treatment and Characterization of Hydraulic Fracturing Fluids, The Ohio State University, 2014 Search PubMed.
- R. Masoomi, I. Bassey, D. S. Viktorovich and H. Dehghani, Int. J. Eng. Technol., 2015, 7, 1598–1609 CAS.
- B. Saba, ChemBioEng Rev., 2015, 1, 273–279 CrossRef.
- M. Samuel, C. Obianwu, W. Chao, E. Samuel, H. Alim, F. Hashim and D. Rohaya, An Engineered Fiber for the Fracturing of Unconsolidated Sand in Highly Deviated Wells in the Tali Field of Brunei, Society of Petroleum Engineers, 2007 Search PubMed.
- K. E. Cawiezel and D. V. S. Gupta, SPE Prod. Oper., 2010, 25, 80–88 CAS.
- F. Liang, G. Al-Muntasheri, H. Ow and J. Cox, SPE J., 2017, 22, 622–631 CrossRef CAS.
- Y. Zhang, Preparation and Properties of a Novel Thickener Used in High-Temperature Fracturing Fluid, Southwest Petroleum University, 2018 Search PubMed.
- S. Wang, Y. Zhang, J. Guo, J. Lai, D. Wang, L. He and Y. Qin, J. Pet. Sci. Eng., 2014, 124, 432–435 CrossRef CAS.
- S. Wang, X. Zhao, B. Cai and S. Hua, Adv. Mater. Res., 2014, 1061–1062, 283–286 Search PubMed.
- Z. Zhang, H. Pan, P. Liu, M. Zhao, X. Li and Z. Zhang, J. Appl. Polym. Sci., 2017, 134, 45037 CrossRef.
- W. A. M. Wanniarachchi, P. G. Ranjith and M. S. A. Perera, Environ. Earth Sci., 2017, 76, 91 CrossRef.
- A. Cadix, J. Wilson, T. Carouhy, S. Harrisson and H. Guichon, A New Class of Associative Polymer for Hydraulic Fracturing Applications, Society of Petroleum Engineers, 2015 Search PubMed.
- J. Holtsclaw and G. P. Funkhouser, SPE Drill. Completion, 2010, 25, 555–563 CrossRef CAS.
- P. Wuthrich, R. P. Mahoney, D. S. Soane, and R. C. Portilla, Crosslinked Synthetic Polymer Gel Systems for Hydraulic Fracturing, U.S. Patent Application 13/915,065, 2013 Search PubMed.
- Y. Zhang, J. Mao, J. Zhao, X. Yang, Z. Zhang, B. Yang, W. Zhang and H. Zhang, Chem. Eng. J., 2018, 354, 913–921 CrossRef CAS.
- K. Tang and S. Pan, Guangzhou Chem. Ind., 1996, 55–61 CAS.
- F. M. Abbasi, T. Hayat and A. Alsaedi, J. Magn. Magn. Mater., 2015, 382, 104–110 CrossRef CAS.
- D. Schmicker, K. Naumenko and J. Strackeljan, Computer Methods in Applied Mechanics and Engineering, 2013, 265, 186–194 CrossRef.
- Y. Shen, Study of Rheology Behaviors of Polymer Melt in Micro-Channels, Zhengzhou University, 2010 Search PubMed.
- X. Zhao, Q. Song, H. Lin, Y. Wang, Z. Wang, J. Jin and C. Xu, Adv. Mater. Res., 2013, 624, 252–255 Search PubMed.
- L. Li, Inn. Mong. Petrochem. Ind., 2011, 21, 51–52 CAS.
- B. Xiao, S. Zhang and X. Lei, Pet. Geol. Recovery Effic., 2014, 21, 102–105 CAS.
Footnote |
| † Electronic supplementary information (ESI) available. See DOI: 10.1039/c8ra09483g |
| This journal is © The Royal Society of Chemistry 2019 |

