 Open Access Article
Creative Commons Attribution 3.0 Unported Licence
Rheological, electrochemical, surface, DFT and molecular dynamics simulation studies on the anticorrosive properties of new epoxy monomer compound for steel in 1 M HCl solution†
Omar Dagdaga,
Ahmed El Harfia,
Omar Cherkaouib,
Zaki Safi c,
Nuha Wazzand,
Lei Guo
 e,
E. D. Akpan
 fg,
Chandrabhan Verma
 *fg,
E. E. Ebenso
 *fg and
Ramzi T. T. Jalghamh
aLaboratory of Agroresources, Polymers and Process Engineering (LAPPE), Department of Chemistry, Faculty of Science, Ibn Tofail University, BP 133, 14000 Kenitra, Morocco
bHigher School of Textile and Clothing Industries, Laboratory REMTEX, BP 7731, Oulfa, Casablanca, Morocco
cAlAzhar University-Gaza, Chemistry Department, Faculty of Science, P. O. Box 1277, Gaza, Palestine
dKing Abdulaziz University, Chemistry Department, Faculty of Science, P. O. Box 42805, Jeddah, 21589, Saudi Arabia
eSchool of Materials and Chemical Engineering, Tongren University, Tongren, 554300, China
fDepartment of Chemistry, Faculty of Natural and Agricultural Sciences, School of Chemical and Physical Sciences, North-West University, Private Bag X2046, Mmabatho 2735, South Africa. E-mail: chandraverma.rs.apc@itbhu.ac.in; Eno.Ebenso@nwu.ac.za
gMaterial Science Innovation & Modelling (MaSIM) Research Focus Area, Faculty of Natural and Agricultural Sciences, North-West University, Private Bag X2046, Mmabatho 2735, South Africa
hDepartment of Oil and Gas, Faculty of Engineering, Bani Walid University, Bani Walid, Libya
First published on 5th February 2019
Abstract
A new epoxy monomer, namely, tetraglycidyl-1,2-aminobenzamide (ER), was synthesized by condensation of the amines with epichlorohydrin in a basic medium. The obtained epoxy monomer was characterized by FT-IR and 1H NMR spectroscopy. Rheological properties of this monomer were determined using an advanced rheometer. Subsequently, the synthesized ER monomer was investigated as corrosion inhibitor for carbon steel in 1 M HCl solution. The adsorption properties of ER were analyzed by electrochemical, surface investigation and theoretical computational studies using DFT and molecular dynamics (MD). Results showed a high dependence of the viscosity of ER on temperature and concentration, and also, that ER has better inhibition performance. A good agreement between the results derived from computational (MD and DFT) and experimental methods was observed. The thermodynamic parameters, along with the kinetic parameters, showed that the adsorption of ER molecules onto carbon steel surface obeyed the Langmuir isotherm model, and the adsorption at metal–electrolyte interfaces involved both chemical and physical adsorption, but predominantly chemisorption mechanism.
1 Introduction
Steel alloys are widely applied in numerous industries, such as the petroleum and construction industries, due to their low cost, availability and outstanding mechanical and physical properties. However, carbon steel is susceptible to corrosion in an environment containing chloride ions, especially acid media, which are frequently utilized in engineering procedures, including oil well acidification, acid curing and industrial acid cleaning.1–3 The use of corrosion inhibitors, mainly organic heterocyclic compounds, has been reported to be one of the most operational and functional approaches against corrosion, as these can easily interact and adsorb on metal surfaces via electron-rich centers constituted mainly of heteroatoms (P, O, S, N), π-electrons of multiple (double and triple) bonds and phenyl rings.4,5 Many of these organic heterocyclic compounds are obtained efficiently using easy and cost-effective approaches, and they show relatively high inhibition effectiveness.6Aromatic resins, such as those based on bisphenol A-epichlorohydrin condensates, are a widely known group of epoxy monomers. The synthetic procedures and characterization of these epoxy monomers have been discussed in detail in the literature.7–9 The epoxy monomers are widely used because of their excellent adhesion performance.10 In our laboratory, we have successfully synthesized some aromatic epoxy monomers, employing reagents containing at least two mobile hydrogens of diamine type and alcohols (mostly with low molecular weights) to react with epichlorohydrin.
In this study, we synthesized the epoxy monomer, namely, tetraglycidyl-1,2-aminobenzamide (ER), and characterized it by FT-IR and 1H NMR spectroscopy. The rheological property of the epoxy monomer was determined by the HAAKE MARS rheometer. Moreover, this epoxy monomer contains several electron-rich centers in the form of heteroatoms and π-electrons, through which they can adsorb effectively and thereafter inhibit corrosion. To this end, we report the inhibition effect of the epoxy monomer ER against carbon steel corrosion in 1 M HCl acidic medium using experimental (electrochemical) and computational techniques.
2 Experimental
2.1. Materials and chemicals
The chemicals and materials used in this work, such as 1,2-aminobenzamide (98%), epichlorohydrin (99%) and triethylamine (≥99.5%) were purchased from Aldrich Chemical Company. Composition of carbon steel is given in Table SI 1.† The corrosive solution of 1 M HCl was prepared by diluting the appropriate amount of concentrated HCl (37%) with distilled water. The range of concentration for the tested inhibitor was from 10−3 to 10−6 mol L−1. Synthesis of the epoxy monomer ER was carried out as shown in Fig. 1 by reacting 1,2-aminobenzamide (I) with epichlorohydrin (II) in the presence of triethylamine, according to a procedure reported in the literature.7–92.2. Rheological measurements
The rheological properties of the epoxy monomer ER were determined with a HAAKE MARS rheometer (Thermo-Scientific) with the cone-plate geometry (the diameter of plateau is 35 mm and cone angle 1°). Shear viscosity (η) was obtained by employing an increasing shear stress ramp at a constant stress rate. All the measurements were performed in duplicate.2.3. Electrochemical measurements
The effect of ER on the corrosive dissolution of carbon steel was studied using electrochemical techniques. Before doing the electrochemical measurements, the carbon steel specimens were abraded using different grades (180 to 1000) of emery paper, washed with distilled water and ethyl alcohol, and finally, degreased with acetone. For electrochemical measurements, a three-electrode setup was used, consisting of a reference electrode constituted by saturated calomel electrode (SCE), a counter electrode of Pt ring and working electrode (WE) of carbon steel specimen. All electrochemical measurements were performed after 30 min immersion time. For electrochemical measurements, the exposed WE area was 1 cm2. The electrochemical behavior of ER was studied using a potentiostat instrument (BioLogic SP-200) as described in our earlier reports.9,10The electrochemical impedance spectroscopy (EIS) measurements were performed over a frequency range of 100 kHz to 10 mHz, using 10 mV amplitude. The Nyquist plots derived in the absence and presence of ER were fitted in the suitable equivalent circuit (described later) in order to obtain some useful parameters, including the charge transfer resistance (Rct). Inhibition efficiency ηEIS% is calculated from charge transfer resistance Rct of ER, according to eqn (1):
 | (1) |
Results of the EIS study were supported by potentiodynamic polarization (PDP) measurement. The PDP curves were measured at a scan rate of 1 mV s−1, from −800 to 0 mV versus SCE. Anodic and cathodic Tafel curves for carbon steel dissolution with and without ER (in 1 M HCl) were recorded. Extrapolation of the linear segments of the anodic and cathodic curves gives the useful parameters, including anodic and cathodic Tafel slopes, corrosion potential (Ecorr), and corrosion current density (icorr). The corrosion current density (icorr) was used to calculate ηPDP (%) of ER, given by eqn (2):
 | (2) |
2.4. Scanning electron microscopy (SEM)
The SEM study was conducted using the S3000H instrument (Hitachi) at the accelerating voltage of 20 kV. For SEM study, the carbon steel coupon was allowed to corrode in 1 M HCl solution without and with 10−3 M ER; thereafter, the surfaces of the coupons were examined for their morphological changes.2.5. Computational details
| The ionization potential: I = −EHOMO | (3) |
| The electron affinity: A = −ELUMO | (4) |
| The energy gap: ΔE = ELUMO − EHOMO | (5) |
 | (6) |
 | (7) |
It is worth mentioning that both the stability and reactivity of a molecule can be measured by estimating the absolute hardness of a molecule.24–26 Generally, molecules with a large energy gap are known as hard molecules, whereas molecules possessing a small energy gap are referred to as soft molecules.27,28
The electrophilicity index (ω), which is a measure of the electrophilic power of an inhibitor, has been estimated using the following expression:
 | (8) |
The calculated values χ and η of the inhibitors can be used to estimate the fraction of electrons transferred, ΔN (eqn (9)), which could be used to evaluate the ability of the inhibitor molecule to transfer electron density to the metal surface:29–32
 | (9) |
The theoretical value of the ηFe is 0, and the values of the work function (φ) are 3.91, 4.82 and 3.88 eV for (1 0 0), (1 1 0) and (1 1 1) planes of Fe, respectively.33,34
The back-donation energy, ΔEb-d, corresponds to the interaction existing between the inhibitor molecule and the metal surface and correlates with the hardness of the inhibitor, as shown in eqn (10):35
 | (10) |
When η > 0 or ΔEb-d < 0, the back-donation from the inhibitor to the metal surface is energetically favored.
Finally, the initial molecule–metal interaction energy (Δψ) index can be calculated using eqn (11):29
 | (11) |
| fk+ = qk(N + 1) − qk(N) (for nucleophilic attack) | (12) |
| fk− = qk(N) − qk(N − 1) (for nucleophilic attack) | (13) |
In eqn (12) and (13), qk(N), qk(N + 1) and qk(N − 1) are the atomic charges of the systems with N, N+1, and N − 1 electrons, respectively.
3 Results and discussion
3.1. Mechanism of epoxide ring opening
Water, alcohols and many other reagents have exerted significant effects on epoxy resin ring opening. These reactions serve as basis for the production of glycols and/or the formation of epoxy glues.41 Under acidic conditions, nucleophilic addition is affected by steric effects that occur mainly by SN2 mechanism, as well as the stability of emerging carbocation, which occurs by SN1 mechanism. Hydrolysis of an epoxide ring in acid medium generates glycol, as shown in Fig. SI 2.†3.2. Rheological properties
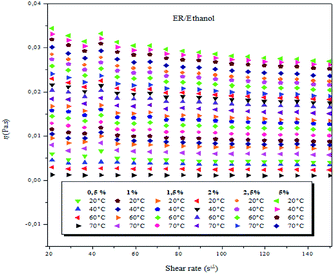 | ||
| Fig. 2 Viscosity as a function of shear rate of ER/ethanol solutions at 0.5, 1.0, 1.5, 2.0, 2.5 and 5 wt% (weight concentrations) and varying temperatures. | ||
In the present study, at the different studied concentrations (0.5–5 wt%), the ER/ethanol acted as a non-Newtonian liquid, and the viscosity was dependent on the shear rate at temperatures between 20 and 70 °C, ranging from 0.01 to 150 s−1. A decrease in viscosity with a corresponding increase in the shear rate was observed, suggestive of the fact that the epoxy monomer ER/ethanol showed a non-Newtonian rheological behavior of pseudo-plastic type.42 The viscosity behaviors of epoxy monomer ER/ethanol as a function of shear rate depends on temperature and concentration, respectively. As anticipated, the viscosity of ER increases with increase in ER concentration, primarily resulting from the increase in the molecular interactions between the epoxy monomers (entanglements, see Fig. SI 3).†
 | (14) |
The activation energy for ER/ethanol varies between 0.60–11.90 kJ mol−1. The obtained results indicate the high activation energy for ER/ethanol. Ea expresses the difficulty of the epoxy monomer molecules’ movement from one position to another, which is controlled by the intermolecular forces, bulkiness and rigidity. The effect of molecular structure on the value of Ea has been reported by many authors.42
3.3. Electrochemical measurements
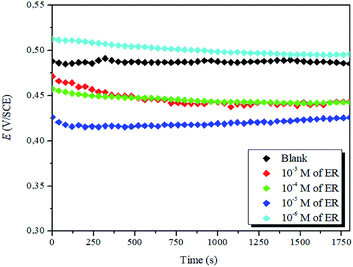 | ||
| Fig. 3 Evolution of OCP against time for the corrosion of steel in 1 M HCl with varying concentrations of ER at 298 K. | ||
It is evident that the addition of the inhibitor molecules brings a continuous shift in OCP (i.e., Ecorr) to anodic potentials. Straight OCP versus time curves reveal that adsorption of the ER takes place after the dissolution of surface oxide (Fe3O4 and Fe2O3) layers.
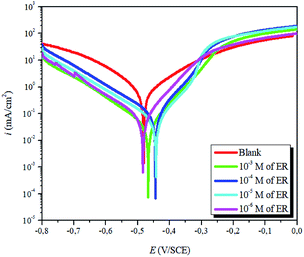 | ||
| Fig. 4 Potentiodynamic polarization plots for carbon steel corrosion in 1 M HCl solution without and with varying concentrations of ER. | ||
| Inh | C (M) | Ecorr (mV) | icorr (μA cm−2) | βa (mV dec−1) | −βc (mV dec−1) | ηPDP% | θ |
|---|---|---|---|---|---|---|---|
| Blank | — | −473.80 | 916.6 | 163.6 | 155 | — | — |
| 10−3 | −467.05 | 34.31 | 78.1 | 126 | 96.0 | 0.960 | |
| ER | 10−4 | −444.53 | 87.22 | 70.5 | 135 | 90.5 | 0.905 |
| 10−5 | −469.74 | 88.38 | 128 | 152 | 90.3 | 0.903 | |
| 10−6 | −455.70 | 108 | 128 | 136 | 88.0 | 0.880 |
The results show that in the presence of ER, icorr values decreased sharply. Correspondingly, the highest inhibition efficiency of 96% was obtained at 10−3 M concentration. This value suggests that ER acted as an efficient corrosion inhibitor against carbon steel corrosion in acidic solution. Furthermore, as presented in Fig. 4 and Table 1, the addition of ER molecules shifted the corrosion potential (Ecorr) slightly to a more positive direction and also shows changes in both the cathodic and anodic polarization branches. These results indicate that the added epoxy monomer ER acted as an anodic-type inhibitor.
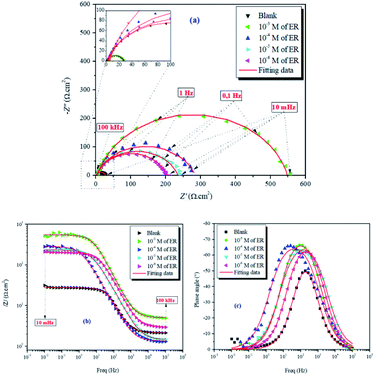 | ||
| Fig. 5 Nyquist (a) and Bode (b and c) diagrams for carbon steel in 1 M HCl solution without and with varying concentrations of ER. | ||
The values of electrochemical parameters such as Rs, Rct and Cdl of ER are presented in Table 2. A careful look at Fig. 5a clearly reveals only one capacitive loop in the Nyquist plots, which could be attributed to a single charge transfer.44 Meanwhile, the size of these loops increases with the rise of ER concentration up to 10−3 mol L−1, which signifies that ER was adsorbed on the carbon steel surface, and the area exposed to the corrosive 1 M HCl solution was reduced. The electrochemical equivalent circuit used to model the experimental data is depicted in Fig. SI 6.† The Rs and Rct in the circuit signify the resistance of the solution and charge transfer resistance, respectively. The constant phase element (CPE) replaces the double-layer capacitor to allow for accurate fitting of the experimental results.45,46 Eqn (15) was used to calculate the impedance of CPE:
 | (15) |
| Inh | C (M) | |Z|0.01 Hz (Ω cm2) | Rs (Ω cm2) | Rct (Ω cm2) | Cdl (mF cm−2) | ηEIS% | χ2 |
|---|---|---|---|---|---|---|---|
| Blank | — | 27 | 2.15 | 25 | 4.6 | — | 0.056 |
| ER | 10−3 | 538 | 5.04 | 543 | 0.08 | 95 | 0.148 |
| 10−4 | 291 | 1.34 | 283 | 0.11 | 91 | 0.983 | |
| 10−5 | 229 | 1.43 | 234 | 0.24 | 90 | 0.189 | |
| 10−6 | 199 | 2.90 | 199 | 0.60 | 87 | 0.034 |
In the above equation, n denotes the phase shift. The value of n serves as a gauge for the measurement of CPE nature; for example, n = 1, Y0 = C indicate the capacitive behavior of the CPE; n = 0, Y0 = 1/L indicate the inductive behavior of the CPE; and n = 1/2, Y0 = W indicate the Warburg impedance. Additionally, high n value is related to high surface smoothness, and its low value is consistent with high surface roughness. In the present study, values of n are very close to unity, which indicates the CPE behaves as pseudo-capacitor.47
The magnitude of the double-layer capacitance (Cdl) is derived as follows:
| Cdl = Yo(ωmax)n−1 | (16) |
3.4. Morphological analysis
The surface morphology of metal coupons after immersion in 1 M HCl solution without ER and with 10−3 M ER for 12 h were examined by SEM, and their micrographs are shown in Fig. 6. As seen in Fig. 6a, the SEM image revealed surface damage owing to the aggressive attack of 1 M HCl solution. On the other hand, the surface of the carbon steel immersed in the corrosive media for 12 h with 10−3 M ER shows a drastic reduction in surface damage (Fig. 6b). From the micrographs, it could be seen that there is adsorption of molecules of ER via the active sites of the metallic surface, resulting in a smoother surface (except for a few spots), signifying the protection of the metal from corrosion. Elemental composition of the metallic surface with and without ER was determined using EDX spectra, which are given in Fig. SI 11.†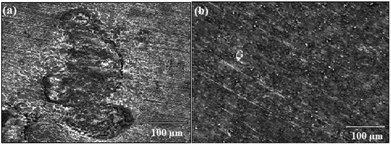 | ||
| Fig. 6 SEM micrographs of carbon steel after 12 h of immersion in 1 M HCl solution: (a) without inhibitor and (b) with 10−3 M ER. | ||
3.5. Effect of temperature
To gain further understanding of the effect of temperature on the corrosion inhibition process, the inhibition ability of ER in 1 M HCl solution was investigated at 298, 308, 318 and 328 K. PDP measurements recorded at the respective temperatures are depicted in Fig. SI 7,† and the values for PDP parameters (Ecorr, icorr) and inhibition efficiencies are listed in Table SI 3.† A careful look at Table SI 3† reveals that increasing the temperature of the 10−3 M ER solution in 1 M HCl resulted in a corresponding increase in the values of icorr and a decrease in protection efficiency (η%). This result shows that temperature affects the inhibition performance of ER in this temperature range (298–328 K), especially at lower concentration.
 | (17) |
The Arrhenius plot obtained in this study is shown in Fig. SI 8.† Moreover, the Arrhenius equation can be converted to a transition-state equation, as shown in eqn (18):44,52
 | (18) |
where, T is temperature, N is Avogadro's constant (6.022 × 10²³ mol−1) and other symbols have their usual meaning. Several parameters, such as Ea, ΔHa and ΔSa, were calculated using Arrhenius and transition state plots (Fig. SI 9†) and are presented in Table SI 4.† The positive value of ΔHa reveals the endothermic nature of metal-inhibitor interactions,52 whereas the increased value of ΔSa suggests that replacement of the water molecules from ER resulted in a corresponding increase in the disorder (randomness) on the metallic surface.
3.6. Adsorption studies
Various adsorption isotherm models are frequently utilized to understand the mechanism of adsorption between the inhibitors and metal atoms at the surface. In the present study, Langmuir, Temkin, and Frumkin adsorption isotherms were employed to fit the results from PDP analysis of ER:53
 | (19) |
 | (20) |
| exp(−2αθ) = KadsC (Temkin isotherm) | (21) |
where θ and Cinh are the surface coverage and concentration of ER, respectively. Kads is the equilibrium constant of the adsorption–desorption (of ER) processes. A perfect linear regression coefficient (R2) was obtained when data obtained from PDP analysis was fitted into the linear Langmuir isotherm model, indicating that ER adsorption at the interface was consistent with the Langmuir adsorption isotherm model. As seen in Fig. SI 10,† the relationship between Cinh and Cinh/θ gave straight lines, and Kads was calculated from the intercept. The standard free energy of adsorption ΔGoads was obtained from eqn (22):54
 | (22) |
3.7. Theoretical studies
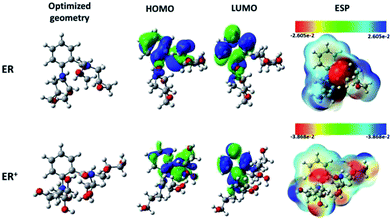 | ||
| Fig. 7 Chemical structures, optimized, HOMO, LUMO, and ESP images of neutral and protonated forms of the studied ER molecule using B3LYP functional and 6-31+G(d,p) basis set. | ||
On the other hand, the electronic parameters can be used to study the reactivity of the tested molecule. Singh and co-workers58 showed that increasing HOMO energy leads to increase in the electron donation tendency of a compound. In contrast, decrease in the LUMO energy is a good indication of electron acceptance ability. Fig. 7 shows that the distribution of the HOMO is concentrated in the middle of the molecular structure of the tested molecule and its protonated form. The electronic distribution is mainly located on the aromatic benzene ring, the carbonyl group and on the nitrogen atoms, with less activity around the epoxy groups. It is also obvious that both the inhibitor and its protonated form have similar HOMO distribution. Interestingly, the LUMO electron densities of the tested molecule and its protonated form moved toward the non-reactive parts in HOMO distributions.
Rahmani and co-workers59 suggested that electron-rich and -deficient centers can be identified with the aid of molecular electrostatic potential (ESP). The ESP derived for ER is presented in Fig. 7. The values of the electrostatic potential have been used to evaluate the ESP maps. The most negative regions of the ESP have been given the red color, while blue stands for the regions of the most positive ESP, and green for zero ESP.60 Therefore, the potential increase follows the order: red > orange > yellow > green > blue. For the monoprotonated molecule (ER), it can be seen that deep red color is mainly located over the carbonyl group (C![[double bond, length as m-dash]](https://www.rsc.org/images/entities/char_e001.gif) O) and over two nitrogen atoms, which suggests that these moieties interact with the metallic surface through electrostatic forces. Meanwhile, the remaining part of the molecule interacts with chemical forces (nucleophilic reactivity). Similar observation was derived for the protonated ER+ species.
O) and over two nitrogen atoms, which suggests that these moieties interact with the metallic surface through electrostatic forces. Meanwhile, the remaining part of the molecule interacts with chemical forces (nucleophilic reactivity). Similar observation was derived for the protonated ER+ species.
The total energies, dipole moments (μ), the quantum chemical descriptors HOMO and LUMO energies (EHOMO and ELUMO), energy gap (ΔE), electrophilicity (ω), electronegativity (χ), the fraction of electron transferred (ΔN), the initial molecule–metal interaction energy (Δψ), and the back-donation energy (ΔEb–d), in both gas phase and in solution for the neutral ER molecule and its protonated form, ER+, are reported in Table SI 5.† Higher value of EHOMO, lower value of ELUMO and lower value of ΔE are consistent with high metal–inhibitor interactions and therefore high protection efficiency, as stated previously.61,62 More importantly, the energy gap plays a significant role in the comparison among inhibitor molecules, especially when they have similar molecular structures. The molecule associated with lower ΔE value is also related to high softness, lower hardness and high chemical reactivity, and thereby high protection ability.62,63 From Table SI 5,† it can be seen that the inhibitor and its protonated form possesses higher EHOMO value in solution. If the value of ΔN is more than zero, then the inhibitor molecule has the ability to move its electrons to the metal, and vice versa.62,64,65 The positive values of ΔN (Table SI 5†) for the neutral ER and for the protonated form of ER indicate that ER has the ability to transfer its electrons into empty d-orbitals of the surface iron atoms.
In order to achieve this particular aim, the condensed Fukui functions of the inhibitor are considered as a valuable indices in estimating the local reactivity of the molecules.66 From the Fukui function, very useful data about the atomic site responsible for the electrophilic and nucleophilic reactions are derived.62,67 Fig. SI 12† presents the graphical representation of the most active sites, as well as the schematic representations of the tested inhibitor and its protonated form, with the number of atoms. For neutral ER molecule, the maximum positive magnitudes of Fukui functions are located on C7, C4, O1, C1 and N1. On the other hand, maximum negative magnitudes of Fukui functions are on N2, C3, and O1. In the protonated form (ER+), the maximum positive magnitudes of Fukui functions are located on C4, C8, C1, O1 and C6, while the maximum negative magnitudes of Fukui functions are located on N2, O4, C3, and N1.
3.8. Molecular dynamics simulation
It has been well established that epoxides in ER have a great tendency to undergo ring-opening reactions in acidic solution. Thus, the open ring form of ER was used for the simulation. Fig. 8 depicts the equilibrium configurations of inhibitor molecules adsorbed on the surface of Fe(110) at different simulated temperatures. As presented in Fig. 8, it is probable that the inhibitor molecules are adsorbed on the Fe(110) surface through benzamide and hydroxyl groups.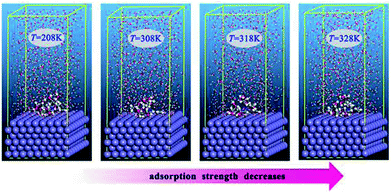 | ||
| Fig. 8 Equilibrium adsorption configurations of the inhibitor compound studied on Fe(110) surfaces with different simulated temperatures. | ||
The energy of adsorption in solution can be calculated following eqn (23):68
| Eads = Etotal − (Esurf+water + Eihn+water) + Ewater | (23) |
4 Conclusions
In this work, we presented the synthesis of the epoxy monomer tetraglycidyl-1,2-aminobenzamide (ER). This epoxy monomer was characterized by 1H NMR and FT-IR spectroscopy. Based on the results obtained and presented, it can be concluded that:- The viscosities of the studied solution showed a high dependence on temperature and concentration.
- ER solutions in ethanol showed a non-Newtonian fluid behavior, and their viscosities were found to depend on shear rate.
- The zero shear rate activation energy of ER/ethanol solutions varies between 0.60–11.90 kJ mol−1.
- The PDP results reveal that the epoxy monomer behaves as an anodic-type corrosion inhibitor.
- The EIS results suggest that ER protects the carbon steel from corrosion by the formation of a protective film at the metal surface.
- The values of standard free energy of adsorption indicate strong interaction between inhibitor molecules and carbon steel.
- DFT and molecular dynamics simulation parameters showed that ER molecules form strong bonds with the metallic surface. The theoretical results are consistent with experimental findings.
5 Author's contributions
O. Dagdag, A. El Harfi, and O. Cherkaoui carried out the experiments. Z. Safi and N. Wazzan carried out and discussed the DFT part. Lei Guo carried out and discussed the molecular dynamics simulation study. E. D. Akpan and Chandrabhan Verma assisted in collation of the results and carried out the computational calculations. E. E. Ebenso and Ramzi T. T. Jalgham conceptualised and designed the work and were part of the manuscript write-up.Conflicts of interest
There are no conflicts to declare.Acknowledgements
C. Verma and E. D. Akpan thankfully acknowledge the North-West University (Mafikeng Campus), South Africa, for providing financial assistance under the postdoctoral fellowship scheme. Nuha Wazzan gratefully acknowledges King Abdulaziz University's High Performance Computing Centre (Aziz Supercomputer) (http://hpc.kau.edu.sa) for assisting with the calculations for this study. This research was partially supported by the National Natural Science Foundation of China (21706195), the Science and Technology Program of Guizhou Province (QKHJC2016-1149), and the Guizhou Provincial Department of Education Foundation (QJHKYZ2016-105). Prof. Safi acknowledges Al Azhar University of Gaza for assistance and help.References
- C. Verma, M. A. Quraishi, K. Kluza, M. Makowska-Janusik, L. O. Olasunkanmi and E. E. Ebenso, Sci. Rep., 2017, 7, 44432 CrossRef CAS PubMed.
- A. Bouoidina, F. El-Hajjaji, M. Drissi, M. Taleb, B. Hammouti, I.-M. Chung, S. Jodeh and H. Lgaz, Metall. Mater. Trans. A, 2018, 49, 5180 CrossRef CAS.
- S. Ben Aoun, RSC Adv., 2017, 7, 36688–36696 RSC.
- K. Azzaoui, E. Mejdoubi, S. Jodeh, A. Lamhamdi, E. Rodriguez-Castellón, M. Algarra, A. Zarrouk, A. Errich, R. Salghi and H. Lgaz, Corros. Sci., 2017, 129, 70–81 CrossRef CAS.
- T. K. Chaitra, K. N. Mohana and H. C. Tandon, J. Bio. Tribo. Corros., 2018, 4, 25 CrossRef.
- A. Espinoza-Vázquez, F. J. Rodríguez-Gómez, B. I. Vergara-Arenas, L. Lomas-Romero, D. Angeles-Beltrán, G. E. Negrón-Silva and J. A. Morales-Serna, RSC Adv., 2017, 7, 24736–24746 RSC.
- S. Fetouaki, A. Elharfi and L. Belkebir, Eur. Polym. J., 2002, 38, 787–793 CrossRef CAS.
- M. El Gouri, A. El Bachiri, S. E. Hegazi, M. Rafik and A. El Harfi, Polym. Degrad. Stab., 2009, 94, 2101–2106 CrossRef CAS.
- O. Dagdag, A. El Harfi, A. Essamri, M. El Gouri, S. Chraibi, M. Assouag, B. Benzidia, O. Hamed, H. Lgaz and S. Jodeh, Int. J. Ind. Chem., 2018, 1–10, DOI:10.1007/s40090-018-0152-5.
- O. Dagdag, A. E. Harfi, A. Essamri, A. El Bachiri, N. Hajjaji, H. Erramli, O. Hamed and S. Jodeh, Arabian J. Sci. Eng., 2018, 43, 5977–5987 CrossRef CAS.
- R. Dennington, T. Keith and J. Millam, GaussView, version 5, Semichem Inc., Shawnee Mission, KS, 2009 Search PubMed.
- M. J. Frisch, G. W. Trucks, H. B. Schlegel, G. E. Scuseria, M. A. Robb, J. R. Cheeseman, G. Scalmani, V. Barone, B. Mennucci, G. A. Petersson, H. Nakatsuji, M. Caricato, X. Li, H. P. Hratchian, A. F. Izmaylov, J. Bloino, G. Zheng, J. L. Sonnenberg, M. Hada, M. Ehara, K. Toyota, R. Fukuda, J. Hasegawa, M. Ishida, T. Nakajima, Y. Honda, O. Kitao, H. Nakai, T. Vreven and J. A. Montgomery, Gaussian 09 series programs–Revision D.01, Gaussian, Inc, Wallingford, CT, USA, 2009 Search PubMed.
- A. D. Becke, J. Chem. Phys., 1992, 97, 9173–9177 CrossRef CAS.
- A. D. Becke, J. Chem. Phys., 1993, 98, 5648–5652 CrossRef CAS.
- C. Lee, W. Yang and R. G. Parr, Phys. Rev. B: Condens. Matter Mater. Phys., 1988, 37, 785–789 CrossRef CAS.
- M. J. S. Dewar and D. M. Storch, J. Am. Chem. Soc., 1985, 107, 3898–3902 CrossRef CAS.
- J. Tomasi, B. Mennucci and R. Cammi, Chem. Rev., 2005, 105, 2999–3094 CrossRef CAS PubMed.
- M. Cossi, N. Rega, G. Scalmani and V. Barone, J. Comput. Chem., 2003, 24, 669–681 CrossRef CAS PubMed.
- T. Koopmans, Physica, 1934, 1, 104–113 CrossRef.
- R. G. Parr, R. A. Donnelly, M. Levy and W. E. Palke, J. Chem. Phys., 1978, 68, 3801–3807 CrossRef CAS.
- R. G. Parr and R. G. Pearson, J. Am. Chem. Soc., 1983, 105, 7512–7516 CrossRef CAS.
- R. G. Pearson, Inorg. Chem., 1988, 27, 734–740 CrossRef CAS.
- P. Geerlings, F. De Proft and W. Langenaeker, Chem. Rev., 2003, 103, 1793–1874 CrossRef CAS PubMed.
- R. G. Pearson, Proc. Natl. Acad. Sci. U. S. A., 1986, 83, 8440–8441 CrossRef CAS.
- R. G. Pearson, J. Org. Chem., 1989, 54, 1423–1430 CrossRef CAS.
- F. Kandemirli, M. Hoscan, A. Dimoglo and S. Esen, Phosphorus, Sulfur, and Silicon and the Related Elements, 2008, vol. 183, pp. 1954–1967 Search PubMed.
- J. Fang and J. Li, J. Mol. Struct.: THEOCHEM, 2002, 593, 179–185 CrossRef CAS.
- P. Zhao, Q. Liang and Y. Li, Appl. Surf. Sci., 2005, 252, 1596–1607 CrossRef CAS.
- V. S. Sastri and J. R. Perumareddi, Corrosion, 1997, 53, 617–622 CrossRef CAS.
- I. Lukovits, E. Kálmán and F. Zucchi, Corrosion, 2001, 57, 3–8 CrossRef CAS.
- Ş. Erdoğan, Z. S. Safi, S. Kaya, D. Ö. Işın, L. Guo and C. Kaya, J. Mol. Struct., 2017, 1134, 751–761 CrossRef.
- S. Martinez, Mater. Chem. Phys., 2003, 77, 97–102 CrossRef CAS.
- Y. Tang, F. Zhang, S. Hu, Z. Cao, Z. Wu and W. Jing, Corros. Sci., 2013, 74, 271–282 CrossRef CAS.
- A. Kokalj, Chem. Phys., 2012, 393, 1–12 CrossRef CAS.
- B. Gómez, N. V. Likhanova, M. A. Domínguez-Aguilar, R. Martínez-Palou, A. Vela and J. L. Gázquez, J. Phys. Chem. B, 2006, 110, 8928–8934 CrossRef PubMed.
- L. O. Olasunkanmi, I. B. Obot and E. E. Ebenso, RSC Adv., 2016, 6, 86782–86797 RSC.
- H. Mi, G. Xiao and X. Chen, Comput. Theor. Chem., 2015, 1072, 7–14 CrossRef CAS.
- R. L. Akkermans, N. A. Spenley and S. H. Robertson, Mol. Simul., 2013, 39, 14–15 CrossRef.
- L. Guo, S. Zhu, S. Zhang, Q. He and W. Li, Corros. Sci., 2014, 87, 366–375 CrossRef CAS.
- C. Verma, L. O Olasunkanmi, E. E. Ebenso, M. A. Quraishi and I. B. Obot, J. Phys. Chem. C, 2016, 120, 11598–11611 CrossRef CAS.
- J. W. Muskopf and S. B. McCollister, in Ullmann's Encyclopedia of Industrial Chemistry, 2000, DOI:10.1002/14356007.a09_547.
- L. El Hamdaoui, M. El Bouchti and M. El Moussaouiti, Polym. Bull., 2018, 75, 769–779 CrossRef CAS.
- O. Dagdag, A. Essamri, L. El Gana, M. El Bouchti, O. Hamed, O. Cherkaoui, S. Jodeh and A. El Harfi, Polym. Bull., 2018, 1–15, DOI:10.1007/s00289-018-2607-4.
- T. Douadi, H. Hamani, D. Daoud, M. Al-Noaimi and S. Chafaa, J. Taiwan Inst. Chem. Eng., 2017, 71, 388–404 CrossRef CAS.
- A. D. Becke, J. Chem. Phys., 1993, 98(7), 5648–5652 CrossRef CAS.
- E. Alibakhshi, M. Ramezanzadeh, G. Bahlakeh, B. Ramezanzadeh, M. Mahdavian and M. Motamedi, J. Mol. Liq., 2018, 255, 185–198 CrossRef CAS.
- O. Dagdag, O. Hamed, H. Erramli and A. El Harfi, J. Bio. Tribo. Corros., 2018, 4, 52 CrossRef.
- A. O. Yüce, E. Telli, B. D. Mert, G. Kardaş and B. Yazıcı, J. Mol. Liq., 2016, 218, 384–392 CrossRef.
- M. Ali Asaad, N. N. Sarbini, A. Sulaiman, M. Ismail, G. F. Huseien, Z. Abdul Majid and P. Bothi Raja, J. Ind. Eng. Chem., 2018, 63, 139–148 CrossRef CAS.
- A. Salhi, S. Tighadouini, M. El-Massaoudi, M. Elbelghiti, A. Bouyanzer, S. Radi, S. El Barkany, F. Bentiss and A. Zarrouk, J. Mol. Liq., 2017, 248, 340–349 CrossRef CAS.
- M. El Faydy, R. Touir, M. Ebn Touhami, A. Zarrouk, C. Jama, B. Lakhrissi, L. O. Olasunkanmi, E. E. Ebenso and F. Bentiss, Phys. Chem. Chem. Phys., 2018, 20, 20167–20187 RSC.
- N. Ugin Inbaraj and G. Venkatesa Prabhu, Prog. Org. Coat., 2018, 115, 27–40 CrossRef CAS.
- S. Pareek, D. Jain, S. Hussain, A. Biswas, R. Shrivastava, S. K. Parida, H. K. Kisan, H. Lgaz, I.-M. Chung and D. Behera, Chem. Eng. J., 2019, 358, 725–742 CrossRef CAS.
- J. Haque, V. Srivastava, D. S. Chauhan, H. Lgaz and M. A. Quraishi, ACS Omega, 2018, 3, 5654–5668 CrossRef CAS.
- M. Galai, M. El Gouri, O. Dagdag, Y. El Kacimi, A. Elharfi and M. Ebn Touhamia, J. Mater. Environ. Sci., 2016, 7, 1562–1575 CAS.
- I. B. Obot, S. A. Umoren, Z. M. Gasem, R. Suleiman and B. E. Ali, J. Ind. Eng. Chem., 2015, 21, 1328–1339 CrossRef CAS.
- L. Guo, X. Ren, Y. Zhou, S. Xu, Y. Gong and S. Zhang, Arabian J. Chem., 2017, 10, 121–130 CrossRef CAS.
- A. Singh, K. R. Ansari, J. Haque, P. Dohare, H. Lgaz, R. Salghi and M. A. Quraishi, J. Taiwan Inst. Chem. Eng., 2018, 82, 233–251 CrossRef CAS.
- R. Rahmani, N. Boukabcha, A. Chouaih, F. Hamzaoui and S. Goumri-Said, J. Mol. Struct., 2018, 1155, 484–495 CrossRef CAS.
- S. Ramalingam, P. David Suresh Babu, S. Periandy and E. Fereyduni, Spectrochim. Acta, Part A, 2011, 84, 210–220 CrossRef CAS PubMed.
- S. K. Saha, A. Dutta, P. Ghosh, D. Sukul and P. Banerjee, Phys. Chem. Chem. Phys., 2016, 18, 17898–17911 RSC.
- L. Guo, Z. S. Safi, S. Kaya, W. Shi, B. Tüzün, N. Altunay and C. Kaya, Front. Chem, 2018, 6, 155 CrossRef PubMed.
- P. Singh, E. E. Ebenso, L. O. Olasunkanmi, I. B. Obot and M. A. Quraishi, J. Phys. Chem. C, 2016, 120, 3408–3419 CrossRef CAS.
- A. Kokalj, Electrochim. Acta, 2010, 56, 745–755 CrossRef CAS.
- N. Kovačević and A. Kokalj, Corros. Sci., 2011, 53, 909–921 CrossRef.
- H. Lgaz, R. Salghi, K. Subrahmanya Bhat, A. Chaouiki, Shubhalaxmi and S. Jodeh, J. Mol. Liq., 2017, 244, 154–168 CrossRef CAS.
- H. Lgaz, K. Subrahmanya Bhat, R. Salghi, Shubhalaxmi, S. Jodeh, M. Algarra, B. Hammouti, I. H. Ali and A. Essamri, J. Mol. Liq., 2017, 238, 71–83 CrossRef CAS.
- H. Zhao, X. Zhang, L. Ji, H. Hu and Q. Li, Corros. Sci., 2014, 83, 261–271 CrossRef CAS.
Footnote |
| † Electronic supplementary information (ESI) available. See DOI: 10.1039/c8ra09446b |
| This journal is © The Royal Society of Chemistry 2019 |

