 Open Access Article
Mono and dual hetero-structured M@poly-1,2 diaminoanthraquinone (M = Pt, Pd and Pt–Pd) catalysts for the electrooxidation of small organic fuels in alkaline medium†
Abla Ahmed Hathoota,
Khalid Mahmoud Hassan *b,
Asmaa Galal Alia,
Ahmed Said Shatlaac,
Helmut Baltruschatc and
Magdi Abdel-Azzema
aElectrochemistry Laboratory, Chemistry Department, Faculty of Science, Menoufia University, Shibin El-Kom 32511, Egypt
bElectrochemistry Research Laboratory, Physics and Mathematics Engineering Department, Faculty of Electronic Engineering, Menoufia University, Menouf 23952, Egypt. E-mail: drkhalidhassan73@gmail.com; Tel: +201001303945
cInstitute of Physical and Theoretical Chemistry, Bonn University, D-53117 Bonn, Germany
First published on 15th January 2019
Abstract
Oxidation of some small organic fuels such as methanol (MeOH), ethanol (EtOH) and ethylene glycol (EG) was carried out in an alkaline medium using palladium (Pd)–platinum (Pt) nanoparticles/poly1,2-diaminoanthraquinone/glassy carbon (p1,2-DAAQ/GC) catalyst electrodes. Pd and Pt were incorporated into the p1,2-DAAQ/GC electrode using the cyclic voltammetry (CV) technique. The obtained Pd/p1,2-DAAQ/GC, Pt/p1,2-DAAQ/GC, Pt/Pd/p1,2-DAAQ/GC and Pd/Pt/p1,2-DAAQ/GC nanocatalyst electrodes were characterized by scanning electron microscopy (SEM), energy dispersive X-ray spectroscopy (EDX) and CV methods. Real active surface area (Areal) achieved by carbon monoxide (CO) adsorption using differential electrochemical mass spectroscopy (DEMS) technique. The electrochemical activity was evaluated and normalized to Areal per metal loading mass. The electrocatalytic oxidation of the small organic fuels at the prepared nanocatalyst electrodes was studied in 1.0 M NaOH solutions by CV and chronoamperometric (CA) techniques. Pt/Pd/p1,2-DAAQ/GC nanocatalyst electrode exhibited enhanced catalytic activity, better durability and higher tolerance to carbon monoxide generated in the oxidation reaction when compared with the other three studied nanocatalysts. The present investigation suggests that the studied nanocatalysts can be successfully applied in direct oxidation of small organic fuels, especially MeOH.
1. Introduction
The ever-increasing energy demand to satisfy the development of modern society and the growing concerns about environmental pollution as well as climate change have rendered it imperative to seek for alternatives of fossil fuels.1 Fuel cells, which change chemical energy into electrical energy, are considered a great innovation because of their environmental friendliness and exceptional productivity. Direct fuel cells (DFCs) oxidize small organic fuels such as methanol (MeOH), ethanol (EtOH) and ethylene glycol (EG) for versatile applications.2,3 DFCs possess important research features, namely, high vitality change proficiency, no contamination release and simple operation.4,5 Although platinum (Pt) catalysts have been widely used in fuel cells, palladium (Pd)-based catalysts have become important in the recent years because they are inexpensive and have excellent catalytic activities toward different fuel molecules.6,7 Moreover, it has been discovered that Pd has better toxic substance protection during the operation of fuel cells. Alloying Pt with another metal can improve alcohol oxidation kinetics significantly.8,9 As indicated by the dual-function mechanism, blending Pt with Pd can give oxygen containing species at a lower potential and debilitate the bond quality of Pt–COads. The negatively charged Pd is more effective in catalytic oxidation of organic fuels because it facilitates the removal of intermediate products such as (CH3COO–)ads and (CO)ads and simultaneously prohibits the buildup of (CO)ads on the catalyst surface. The removal of intermediate species and simultaneous mitigation of the buildup may lead to a desirable complete oxidation of ethanol (i.e., breakage of the C–C bond)10 and advance the oxidation/expulsion of CO in the form of CO2. Electrodeposition of Pd on various supports to improve catalytic activity has been utilized to prepare different catalysts.11The activity of core–shell structured Au–PtPd/C and Au–Pt/C nanoparticles (NPs) was tested for the electrooxidation of methanol. Au–PtPd NPs showed higher activity than Au–Pt NPs due to their enhanced tolerance for methanol oxidation.12 Three-dimensional (3D) cubic superstructures of PtPd nanosheets displayed improved catalytic activity and long-term stability towards methanol oxidation compared with Pt/C, as reported by Zhou et al.13
Conducting polymers (CPs) as supporting materials not only offer high specific surface areas, but also enhance deposition possibility and impact the absorption of small organic fuels.14 The choice of an appropriate CP is an essential factor that influences the efficacy of catalysis. Current studies demonstrate that CPs have excellent potential to improve the application of modified electrodes.15 CPs have great manufacturing adaptability, stability, and ecofriendliness and can effectively act as a redox mediator.15,16 Moreover, CPs have good stability and efficient surface areas for incorporation of metal nanoparticles (NPs) and for preventing their agglomeration during metal deposition.15 The synergistic impact of metal NPs and polymer films enhances the efficacy for oxidation of fuel molecules, decreases catalyst poisoning and improves the stability of metal NPs.15,17 The electrodeposition of metal NPs in the polymer films improves their tolerance towards COads species produced during the oxidation process and is an economical and appropriate method.18
In a previous study, we prepared a number of modified catalyst electrodes.19 The aim of the present study is to prepare mono and binary catalysts composed of Pt and Pd NPs with controlled deposition order on a polymer film. Herein, we report the synthesis of poly1,2-diaminoanthraqinone (p1,2-DAAQ) as a support for the deposition of Pt and/or Pd by the cyclic voltammetry (CV) technique on glassy carbon (GC) to prepare Pt/p1,2-DAAQ/GC, Pd/p1,2-DAAQ/GC, Pd/Pt/p1,2-DAAQ/GC and Pt/Pd/p1,2-DAAQ/GC nanocatalyst electrodes. The presence of two carbonyl groups in 1,2-DAAQ monomer can provide chelating centers, helping metal incorporation on the electrode surface compared with other polyaniline derivatives.20 The resultant nanocatalyst electrodes were characterized by scanning electron microscopy (SEM), energy dispersive X-ray spectroscopy (EDX) and CV techniques. Electrochemically active surface area (ECSA) measurements were performed by the differential electrochemical mass spectroscopy (DEMS) technique. Furthermore, the stability of the prepared catalysts for alcohol oxidation in an alkaline medium was examined by chronoamperometry (CA).
2. Experimental
2.1. Materials
1,2-Diaminoanthraqinone (1,2-DAAQ) of analytical grade was obtained from Aldrich. Sulfuric acid (H2SO4 98%) (Merck), acetonitrile (99.9%) HPLC (LAB-SCAN), MeOH, EtOH, EG (ADWIC) (98%) and lithium perchlorate (LiClO4) were used without additional purification. Sodium hydroxide (NaOH), palladium chloride (PdCl2) and chloroplatinic acid hexahydrate (H2PtCl6·6H2O) were analytical grade chemicals. Diamond paste (presi) (2.0 μm) and distilled water were utilized.2.2. Instruments
Electrochemical experiments were performed using a potentiostat Model BASi EPSILON. All electrochemical experiments were performed using an electrochemical cell with a conventional three-electrode system. A GC electrode (3 mm in diameter) was used as the working electrode and a platinum wire as an auxiliary electrode. All recorded potentials were with respect to the Ag/AgCl reference electrode except for ESA measurements, which were related to reversible hydrogen electrode (RHE), whereas film formation was related to the Ag/Ag+ reference electrode. SEM images and EDX measurements were performed utilizing QUANTA FEG 250 equipped with an energy dispersive X-ray spectrometer. DEMS measurements were performed using a quadrupole mass spectrometer (Balzer QMG-422) and dual thin layer flow through cell, in which a hydrophobic Teflon membrane formed an interface between the electrolyte and vacuum.212.3. Experimental procedure
3. Results and discussion
3.1. Characterization of the prepared catalyst electrodes
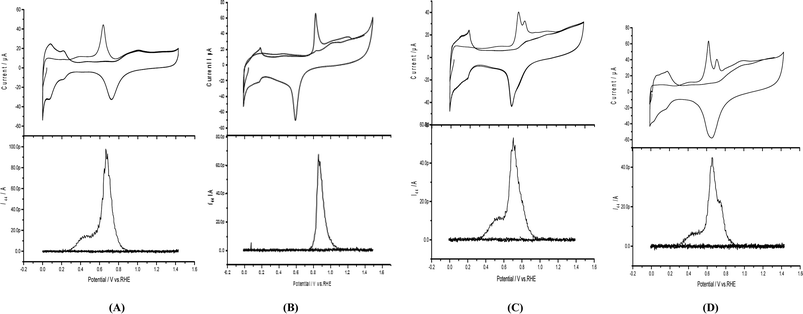
Areal measurements of Pd/p1,2-DAAQ/GC, Pt/p1,2-DAAQ/GC, Pd/Pt/p1,2-DAAQ/GC and Pt/Pd/p1,2-DAAQ/GC nanocatalyst electrodes were achieved by the DEMS technique (cf. Experimental), as demonstrated in Fig. 1(A–D) (lower parts). Anodic oxidation peaks appeared at 0.88 V for Pt/p1,2-DAAQ/GC (Fig. 1B (upper part)) and at 0.66, 0.75 and 0.6 V for the other three nanocatalyst electrodes (Fig. 1A, C and D (upper parts), respectively), which were ascribed to the combined influence of oxidation of COads and partial surface oxidation of Pt or Pd to metal oxides (PtO and PdO). Cathodic reduction peaks appeared at the reverse scan at 0.74, 0.60, 0.70 and 0.66 V for Pd/p1,2-DAAQ/GC, Pt/p1,2-DAAQ/GC, Pd/Pt/p1,2-DAAQ/GC and Pt/Pd/p1,2-DAAQ/GC catalyst electrodes, respectively, in 0.5 M H2SO4 at a sweep rate of 0.01 V s−1 (Fig. 1A–D (upper parts)), which were ascribed to metal oxide reduction. Charges associated with metal oxide reduction were deducted from the anodic charges and the charge was equivalent to COads oxidation.27,28 The ionic signal for m/z = 44 in 0.5 M H2SO4 at a sweep rate of 0.01 V s−1 and flow rate of 5.0 μL s−1 was used for Areal calculations, according to the following eqn (1):
| Areal = Aico = QMS/K × FΓM, | (1) |
The obtained Areal values of the nanocatalyst electrodes were 0.87, 0.74, 0.73 and 1.0 cm2 for Pd/p1,2-DAAQ/GC, Pt/p1,2-DAAQ/GC, Pd/Pt/p1,2-DAAQ/GC and Pt/Pd/p1,2-DAAQ/GC modified electrodes, respectively (Table 1). The results revealed that Pt/Pd/p1,2-DAAQ/GC modified electrode exhibited the largest Areal value, whereas both Pt/p1,2-DAAQ/GC and Pt/Pd/p1,2-DAAQ/GC exhibited the lowest values. These results indicated the important role of the order of metal NP electrodeposition.
| Catalysts | Areal (cm2) | Metal loading (g m−2) | ECSA (m2 g−1) |
|---|---|---|---|
| Pd/p1,2-DAAQ/GC | 0.87 | 0.63 | 4.03 |
| Pt/p1,2-DAAQ/GC | 0.74 | 1.01 | 3.95 |
| Pd/Pt/p1,2-DAAQ/GC | 0.73 | 1.66 | 4.23 |
| Pt/Pd/p1,2-DAAQ/GC | 1.00 | 1.56 | 5.28 |
Current is generally normalized by the mass of the loaded metal to study the catalyst efficiency. Therefore, electrochemically active surface area (ECSA) is an essential parameter and it explains the number of electrochemically active sites related to the mass of deposited metal29,30 according to eqn (2):
| ECSA = Q/sl | (2) |
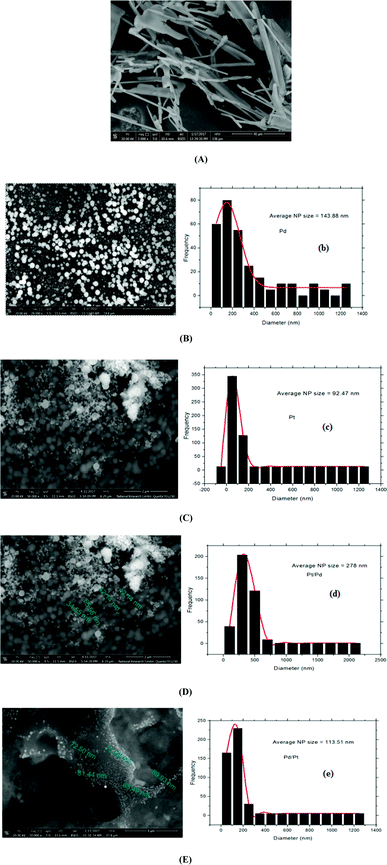
Fig. 2(D and E) show images of both Pt/Pd/p1,2-DAAQ/GC and Pd/Pt/p1,2-DAAQ/GC electrodes, respectively, where the particle sizes have average diameters of 88.0 nm and 68.0 nm, respectively. These data show that p1,2-DAAQ/GC is essentially affected by the incorporation of Pt and Pd NPs into the p1,2-DAAQ structure. This structure gives a high number of accessible active sites, acting as a valuable support for the deposition of Pt–Pd NPs. The conducting polymer surprisingly improves the active surface area and increases the catalyst activity. Moreover, the presence of Pt–Pd NPs in the polymeric film was affirmed by EDX (Fig. S2†). EDX results demonstrated that both Pd and Pt NPs were dispersed in the p1,2-DAAQ film with percentages of 13.44% and 32.54% for Pd/p1,2-DAAQ/GC and Pt/p1,2-DAAQ/GC electrodes, respectively. Furthermore, in the binary mixture of Pd and Pt NPs, EDX results revealed the presence of both dispersed metal NPs with percentages of 7.32 and 3.55% (Pd and Pt) as well as 3.54 and 1.62% (Pt and Pd) for Pd/Pt/p1,2-DAAQ/GC and Pt/Pd/p1,2-DAAQ/GC electrodes, respectively. The NP size distribution histograms of the four catalysts were manually obtained from the SEM images with more than 250 particles. The average NP sizes of Pd/p1,2-DAN/GC, Pt/p1,2-DAN/GC, Pt/Pd/p1,2-DAAQ/GC and Pd/Pt/p1,2-DAN/GC were 92.47, 143.88, 278.0 and 113.51 nm, respectively, as presented in Fig. 2(B(b), C(c), D(d) and E(e)). The difference between Fig. 2B and C originates from the broad range of NP size distributions of Pd NPs and their tendency to aggregate or to form clumps, as reported in literature.32
3.2. Catalytic activity towards electro-oxidation of alcohols
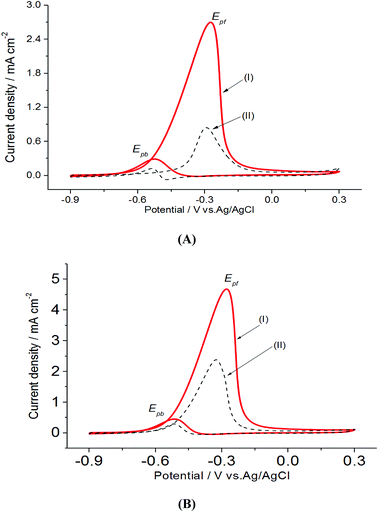
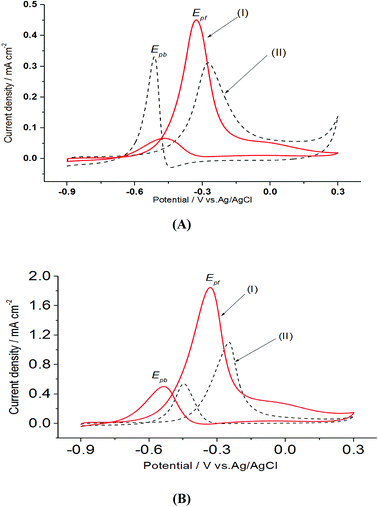
In a preliminary experiment, bare electrodes (Pt, Au and GC) were tested in 0.1 M NaOH solution containing 0.3 M MeOH, 1.0 M EtOH or 0.5 M EG. In general, no voltammetric response was observed at bare GC electrode, which is desirable to avoid any overlapping. For this reason, GC electrode was applied as the bare electrode in this study. Direct oxidation reactions of 0.3 M MeOH investigated in 1.0 M NaOH solutions at Pt/p1,2-DAAQ/GC, Pd/p1,2-DAAQ/GC, Pd/Pt/p1,2-DAAQ/GC and Pt/Pd/p1,2DAAQ/GC nanocatalyst electrodes were studied to inspect the impact of the presence of metal NPs and the deposition order of Pt and Pd on the catalytic activity of the prepared single and bimetallic nanocatalyst electrodes. As shown in Fig. 3(A and B), two oxidation peaks, i.e., a forward oxidation peak (Epf) and a backward peak (Epb) were observed. These two peaks may be ascribed to the oxidation of EtOH and the intermediate species to CO2.33 The electrochemical data are presented in Table 2.As seen in Table 2, the Jpf/Jpb ratio increased from 7.50 at Pd/p1,2-DAAQ/GC electrode to 10.35 at Pt/Pd/p1,2-DAAQ/GC electrode, indicating significant tolerance of this electrode against poisoning. This increase indicates improvement in catalytic activity. Alloying Pt with another metal improved alcohol oxidation kinetics significantly.4,8,9 Thus, in the binary system, the study of Pt in an outer core and in an inner core was performed. The presence of Pt in the outer core improved the performance of the Pt/Pd/p1,2-DAAQ/GC electrode since incorporation of a second metal in Pd has been shown to improve liquid fuel oxidation kinetics significantly.33 With respect to the dual-function and essential mechanism, a second metal can deliver oxygen-containing species at lesser potentials, reduce the bond strength of Pd–COads, and facilitate oxidation of CO to CO2 and its subsequent removal.34 Moreover, the adsorption of intermediates produced from methanol oxidation, such as (COH)ads, requires three neighboring platinum sites to be adsorbed; however, in the case of Pt/Pd/p1,2-DAAQ/GC, the presence of Pd NPs has a diluting effect and limits the presence of three adjacent Pt sites necessary for adsorption of the poisoning species.35 Therefore, CO tolerance is significant at this electrode. On the other hand, in the case of Pd/Pt/p1,2-DAAQ/GC, Pd NPs are less active36 towards methanol oxidation and therefore, their CO tolerance is small, leading to decreased CO poisoning and enhanced catalytic activity and durability toward MOR.37
Also, it was noticed that the forward peak current density at Pt/Pd/p1,2-DAAQ/GC electrode has a higher value compared with those of the other three catalysts. In general, the presence of p1,2-DAAQ film loaded with Pt, Pd or Pt/Pd (layer by layer) NPs provides catalytic enhancement for direct MeOH oxidation in terms of increasing oxidation current and favorable shift in the onset potential compared with commercial Pd/C (−0.38 V) and Pt/C (−0.52 V), as reported previously.38
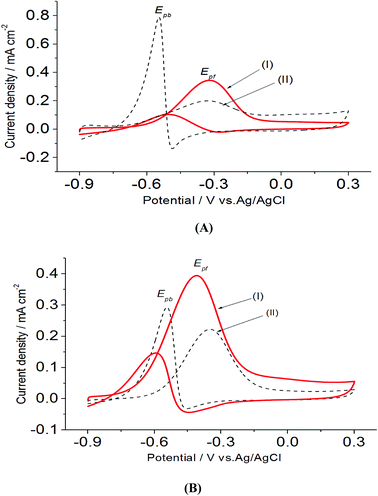
On the other hand, electrooxidation of EtOH was examined in 1.0 M NaOH solutions at Pt/p1,2-DAAQ/GC, Pd/p1,2-DAAQ/GC, Pd/Pt/p1,2-DAAQ/GC and Pt/Pd/p1,2DAAQ/GC nanocatalyst electrodes, as illustrated in Fig. 4(A and B). One oxidation peak (Epf) in the forward sweep generally ascribed to the oxidation of EtOH was observed. On the other hand, a reverse oxidation peak (Epb) was noticed due to oxidation of the intermediate species.6,23,39 The main challenge with ethanol is that the complete electrochemical oxidation per molecule involves complicated processes of 12 electrons and cleavage of a carbon–carbon (C–C) bond.40 Pt-containing metallic catalysts can facilitate C–C bond cleavage.41 It was found that electrochemical oxidation of EtOH greatly depends on the Pt content in the film matrix exposed to reaction conditions, where the percentage of Pt in case of Pt/Pd/p1,2-DAAQ/GC is higher than other catalysts; thus, the Pd/Pt/p1,2-DAAQ/GC electrode showed better tolerance. Table 3 shows the onset potential (Eonset) values, forward and backward peak potentials (Epf, Epb), anodic peak current densities for the forward and backward scans (Jpf, Jpb) and catalytic tolerances (Jpf/Jpb) for the electrooxidation of ethanol at the studied catalyst electrodes.
It is noticed that the Jpf/Jpb ratio increased from 0.27 at Pd/p1,2-DAAQ/GC to 3.3 at Pt/p1,2-DAAQ/GC, indicating significant tolerance of this electrode against poisoning. At the same time, Pt/Pd/p1,2-DAAQ/GC electrode showed the highest forward peak current density value and favorable onset potential shift, indicating catalytic enhancement towards ethanol oxidation. The values of ethanol Eonset were found to be −0.52 V and −0.51 V for Pd/C and Pt/C, respectively, as reported previously,38 giving advantage to the studied catalysts.
Furthermore, cyclic voltammograms of the oxidation of EG at Pt/p1,2-DAAQ/GC, Pd/p1,2-DAAQ/GC, Pt/Pd/p1,2-DAAQ/GC and Pd/Pt/p1,2-DAAQ/GC electrodes studied in an alkaline medium showed two well-defined current peaks (Fig. 5(A and B)). The forward and the backward peaks correspond to the electrooxidation of EG and the intermediate species.42 The onset potential, potential peak, current densities and Jpf/Jpb are listed in Table 4. Table 4 illustrates the onset potential (Eonset), forward and backward peak potentials (Epf, Epb), anodic peak currents for forward and backward scans (Jpf and Jpb) and catalytic tolerance (Jpf/Jpb) for the electrooxidation of EG at the studied catalyst electrodes.
| Catalyst | Eonset (V) | Epf (V) | Epb (V) | Jpf × 10−3 A cm−2 | Jpb × 10−3 A cm−2 | Jpf/Jpb |
|---|---|---|---|---|---|---|
| Pd/p1,2-DAAQ/GC | −0.46 | −0.27 | −0.49 | 0.31 | 0.33 | 0.94 |
| Pt/p1,2-DAAQ/GC | −0.60 | −0.31 | −0.47 | 0.45 | 0.05 | 9.00 |
| Pd/Pt/p1,2-DAAQ/GC | −0.53 | −0.25 | −0.44 | 1.10 | 0.53 | 2.07 |
| Pt/Pd/p1,2-DAAQ/GC | −0.70 | −0.34 | −0.53 | 1.84 | 0.49 | 3.67 |
Analysis of the previous data illustrated the importance of Pt and Pd NP deposition order. When we deposited Pd first, followed by the deposition of Pt, the formed Pt/Pd/p1,2-DAAAQ/GC nanocatalyst electrode showed satisfactory performance in alcohol oxidation with the highest peak current, Ipf, and a negative shift of the onset potential (around −0.7 V) (Tables 2–4) as a significant factor.43 It was concluded that the catalytic tolerance of Pt/Pd/p1,2-DAAQ/GC nanocatalyst electrode in the electrooxidation of MeOH is the best. This might be related to the fact that MeOH is C1 compound, which can easily break in the presence of a high amount of Pt, as observed in the case of Pt/Pd/p1,2-DAAQ. On the other hand, the presence of Pd in Pd/Pt/p1,2-DAAQ/GC electrode (which is less active towards EtOH oxidation and EG oxidation reactions) decreased the electroactivity of the catalyst.
Mass electrochemical activities of each nanocatalyst were calculated from the amount of metal loading and the related forward peak current densities are presented in Table 5. Therefore, Pt/Pd/p1,2-DAAAQ/GC nanocatalyst electrode was selected for the following electrochemical studies.
| Catalysts | Metal loading (g m−2) | Methanol | Ethanol | Ethylene glycol | |||
|---|---|---|---|---|---|---|---|
| Jpf (mA cm−2) | Mass electrochemical activity (A g−1) | Jpf (mA cm−2) | Mass electrochemical activity (A g−1) | Jpf (mA cm−2) | Mass electrochemical activity (A g−1) | ||
| Pd/p1,2-DAAQ/GC | 0.63 | 0.75 | 11.90 | 0.21 | 3.30 | 0.31 | 4.92 |
| Pt/p1,2-DAAQ/GC | 1.01 | 2.83 | 28.01 | 0.30 | 2.90 | 0.45 | 4.40 |
| Pd/Pt/p1,2-DAAQ/GC | 1.66 | 2.40 | 14.40 | 0.23 | 1.38 | 1.10 | 6.60 |
| Pt/Pd/p1,2-DAAQ/GC | 1.56 | 4.66 | 29.87 | 0.39 | 2.50 | 1.84 | 11.79 |
Based on the above results, the electroactivity of Pt/Pd/p1,2-DAAAQ/GC nanocatalyst electrode was examined for direct electrooxidation of MeOH, EtOH and EG by changing several parameters such as continuous cycling, scan rate, and alcohol and electrolyte concentrations.
3.3. Parameters affecting electrooxidation of the analyzed alcohols
To attain better electrocatalytic oxidation of the analyzed alcohols at Pt/Pd/p1,2-DAAAQ/GC nanocatalyst electrode, various parameters such as the effects of continuous cycling, scan rate, and alcohol and electrolyte concentrations were investigated.It was concluded that diffusion controlled the catalytic reactions of the examined alcohols.23,45 Also, cyclic voltammograms at various sweep rates demonstrated that the oxidation potential peaks in the forward sweep shifted to positive potentials with increase in scan rate. A linear correlation between Ep and log(V) indicated that the electrooxidation of the three alcohols is an irreversible electrochemical process.46 The plots of Jpf/Jpb ratio versus scan rate indicate that the Jpf/Jpb ratio increases with increasing sweep rates. A higher Jpf/Jpb ratio indicates less nanocatalyst surface contamination with intermediates and an improvement in analyte oxidation.23,47 Diffusion coefficient (D) was calculated for the studied alcohols according to the Randles–Sevcike equation,48,49 yielding values of 7.4 × 10⁻⁸, 3.34 × 10⁻⁸ and 1.7 × 10⁻⁸ for MeOH, EtOH and EG, respectively. These values are much lower than those reported earlier, indicating that the rate of the diffusion of alcohols to the electrode surface decreases at higher scan rates. The diffusion of penetrant through the polymer is greatly affected by the presence of impenetrable micro- and/or nano-particles located in the structure.50,51
The impact of different NaOH concentrations on the electrooxidation peak current densities of the studied alcohols at Pt/Pd/p-1,2DAAQ/GC nanocatalyst was examined by the CV technique. Increase in NaOH concentrations up to 1.0 M showed increase in the peak current densities, followed by a steady state in the range from 1.2 M to 1.4 M NaOH (figure not shown). Alcohol electrooxidation occurred due to higher accessibility and superior nanocatalyst surface coverage of OH−.23 Additional increment in the NaOH concentration resulted in decrease in the current density. At high NaOH concentrations, blocking of the Pt/Pd/p1,2-DAAQ/GC nanocatalyst electrode surface with OH− ions occurred, hindering the adsorption of alcohol. Therefore, this OH− blocking is extreme on metal NPs, whereas the intermediate coverage is poor, leading to decrease in current density.23,53
3.4. Possible elimination of nanocatalyst poisoning intermediates
The formation of catalyst-poisoning intermediate compounds, such as Pd or Pt–COads, is the significant contributor to the decrease in the electrocatalytic activity during the alcohol oxidation reaction.54 The development and dissolution of oxides formed on the nanocatalyst surface23 were examined by expanding the final potentials to different values (from +0.4 to +0.9 V) (Fig. S4†). Expanding the final potential limits causes increase in the peak current densities in the forward scan.42 In the reverse scan, the anodic peak current decreases.55 The anodic peak potentials and peak current densities in the backward sweep changed with increasing the final potential limits. At low potential limits, sufficient metal NP oxides were not formed to oxidize the alcohols in the backward sweep. Increase in the final potential limits produced additional metal oxides, and the backward current density increased. Thus, it is clear that the final potential limits control the peak current densities of the forward Jpf and the reverse Jpb sweeps, increasing the tolerance of the nanocatalyst to intermediate species.56 The influence of the nanocatalyst in eliminating poisonous intermediates was examined using the Jpf/Jpb ratio (Tables 1–3). It was found that the ratio increased from 10.0 to 122.0 (MeOH), 2.1 to 5.9 (EtOH) and 0.5 to 13.7 (EG) as the upper limit potential increased. It was noticed that Epf showed similarity to Epb, moving to low potential values with decrease in current densities. This demonstrates the continuing elimination of poisoning intermediates produced during the forward scan. Raising the potential limits in the forward scans increases metal oxide formation and decreases the peak potential Epf.42,57Finally, a comparison of the electrocatalytic activities of commercial Pt/C and Pt/Pd/p1,2-DAAQ/GC catalysts towards the oxidation of methanol, ethanol and ethylene glycol is displayed in Table 6. It was found that although Pt/Pd/p1,2-DAAQ/GC catalyst has lower current density compared with commercial Pt/C, it demonstrates higher tolerance and a negative onset potential shift. This can be ascribed to the role played by p1,2-DAAQ polymer film. The presence of the polymer not only offers a high specific surface area, but also enhances the deposition possibility and impacts the absorption of small organic fuels. The synergistic impact of metal NPs and polymer films enhances the efficacy of the oxidation of fuel molecules, decreases the catalyst poisoning and improves the stability of metal NPs, thus improving the tolerance against species produced during the oxidation process.
| Catalyst | Fuel | Concentration (M) | Epf (V/Ag/AgCl) | Jpf × 10−3 A cm−2 | Tolerance | Reference | |
|---|---|---|---|---|---|---|---|
| Pt/C | MeOH | 1.0 MeOH + 1.0 KOH | −0.55 | −0.18 | 39 | 4.1 | Ref. 38 |
| Pt/Pd/p1,2-DAAQ/GC | 1.0 MeOH + 1.0 NaOH | −0.70 | −0.28 | 10.98 | 10.35 | This work | |
| Pt/C | EtOH | 1.0 EtOH + 1.0 KOH | −0.55 | −0.23 | 7 | 1.75 | Ref. 38 |
| Pt/Pd//p1,2-DAAQ/GC | 1.0 EtOH + 1.0 NaOH | −0.79 | −0.28 | 0.39 | 2.8 | This work | |
| Pt/C | EG | 0.5 EG + 0.1 KOH | 0.1 | 0.90 | 100 | 2 | Ref. 58 |
| Pt/Pd//p1,2-DAAQ/GC | 0.5 EG + 0.1 NaOH | −0.70 | −0.34 | 1.84 | 3.67 | This work |
3.5. Chronoamperometry
Chronoamperometric study was carried out to better understand the electro-catalytic performance of the nanocatalyst electrode Pt/Pd/p1,2-DAAQ/GC. Fig. 6 shows the current–time transients, where the potentials are maintained at −0.28 V, −0.42 V, and −0.34 V for MeOH, EtOH and EG, respectively. By applying potential to the electrode, a steady decrease in currents was observed during the first few seconds, followed by the establishment of nearly fixed currents at longer times. The intermediate poisoning species formed during alcohol oxidation could be considered as the main factor for decreasing the current. Chronoamperometry study shows that the stability decreases in the order MeOH > EG > EtOH, which agrees with the above results.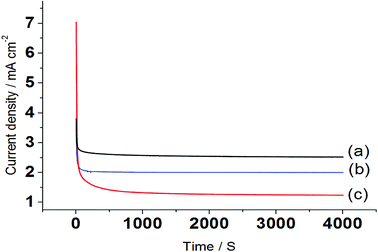 | ||
| Fig. 6 Chronoamperograms for the electrooxidation of (a) 0.3 M MeOH, (b) 1.0 M EtOH and (c) 0.5 M EG in 1.0 M NaOH at Pt/Pd/p1,2-DAAQ/GC nanocatalyst electrode. | ||
4. Conclusion
In the current study, we assessed the impact of p1,2-DAAQ/GC as a supporting material on the catalytic activity of Pd–Pt NP nanocatalyst for oxidation of MeOH, EtOH and EG. NPs were successfully deposited on p1,2-DAAQ/GC supports including Pt/p1,2-DAAQ/GC, Pd/p1,2-DAAQ/GC, Pd/Pt/p1,2-DAAQ/GC and Pt/Pd/p1,2-DAAQ/GC nanocatalyst electrodes by means of a simple and rapid process. Physicochemical characterization of the prepared nanocatalysts was performed by DEMS, SEM, EDX and electrochemical methods. Electrochemical examination demonstrated that the Pt/Pd/p1,2-DAAQ/GC nanocatalyst showed excellent catalytic activity for the oxidation of MeOH, EtOH and EG compared with other nanocatalysts. Therefore, Pt/Pd/p1,2-DAAQ/GC was chosen as the desired nanocatalyst electrode for our study. The influence of various factors on the oxidation of three alcohols was examined and improved. It was found that Pt/Pd/p1,2-DAAQ/GC electrocatalyst introduced high electroactivity and suitable and long-term cyclic stability, suggesting potential opportunities for its application as a suitable nanoelectrocatalyst. Furthermore, the catalytic tolerance of Pt/Pd/p1,2-DAAQ/GC nanocatalyst electrode in the electrooxidation of the studied alcohols decreased in the order MeOH > EG > EtOH, indicating that the Pt/Pd/p1,2-DAAQ/GC nanocatalyst electrode showed high catalytic activity in the electrooxidation of MeOH.Conflicts of interest
There are no conflicts to declare.Acknowledgements
The authors are appreciative of Alexander von Humboldt Foundation for financial funding of project no. 30260067.References
- D. D. Babu, Y. Huang, G. Anandhababu, M. A. Ghausi and Y. Wang, ACS Appl. Mater. Interfaces, 2017, 9, 38621–38628 CrossRef CAS PubMed.
- H. Zhang, C. Hu, X. He, L. Hong, G. Du and Y. Zhang, J. Power Sources, 2011, 196, 4499–4505 CrossRef CAS.
- A. Malolepszy, M. Mazurkiewicz, L. Stobinski, B. Lesiak, L. Kövér, J. Tóth, B. Mierzwa, A. Borodzinski, F. Nitze and T. Wågberg, Int. J. Hydrogen Energy, 2015, 40, 16724–16733 CrossRef CAS.
- W. Xie, F. Zhang, Z. Wang, M. Yang, J. Xia, R. Gui and Y. Xia, J. Electroanal. Chem., 2016, 761, 55–61 CrossRef CAS.
- D. D. Babu, W. Wang, Y. Huang, J. Lv, Y. Wang and M. Wu, Int. J. Hydrogen Energy, 2018, 43, 10351–10358 CrossRef.
- Sh. Cao, W. Xu, Sh. Zhu, Y. Liang, Z. Li, Z. Cui, Y. Liang, Z. Li, X. Yang and A. Inouea, J. Electrochem. Soc., 2016, 163, E263–E271 CrossRef CAS.
- A. A. Hathoot, U. S. Yousef, A. S. Shatla and M. Abdel-Azzem, Electrochim. Acta, 2012, 85, 531–537 CrossRef CAS.
- R. Ojani, J.-B. Raoof, M. Goli and R. Valiollahi, J. Power Sources, 2014, 264, 76–82 CrossRef CAS.
- A. V. Tripković, K. D. Popović, B. N. Grgur, B. Blizanac, P. N. Ross and N. M. Marković, Electrochim. Acta, 2002, 47, 3707–3714 CrossRef.
- R. Jiang, D. T. Tran, J. P. McClure and D. Chu, ACS Catal., 2014, 4, 2577–2586 CrossRef CAS.
- F. Zhang, J. Chen, X. Zhang, W. Gao, R. Jin and N. Guan, Catal. Today, 2004, 93–95, 645–650 CrossRef CAS.
- I.-S. Park, O.-H. Kim, J. W. Kim, B. Choi, Y.-H. Cho and Y.-E. Sung, New J. Chem., 2015, 39, 6034–6039 RSC.
- L. N. Zhou, X. T. Zhang, Z. H. Wang, S. Guo and Y. J. Li, Chem. Commun., 2016, 52, 12737–12740 RSC.
- G. Anandhababu, S. C. Abbas, J. Lv, K. Ding, Q. Liu, D. D. Babu, Y. Huang, J. Xie, M. Wu and Y. Wang, Dalton Trans., 2017, 46, 1803–1810 RSC.
- J.-B. Raoof, S. R. Hosseini and S. Rezaee, Electrochim. Acta, 2014, 141, 340–348 CrossRef CAS.
- E. Antolini and E. R. Gonzalez, Appl. Catal., A, 2009, 365, 1–19 CrossRef CAS.
- W. Zhou, Y. Du, F. Ren, C. Wang, J. Xu and P. Yang, Int. J. Hydrogen Energy, 2010, 35, 270–3279 Search PubMed.
- M. H. Pournaghi-Azar and B. Habibi, J. Electroanal. Chem., 2007, 601, 53–62 CrossRef CAS.
- K. M. Hassan, A. A. Hathoot, M. F. Abo oura and M. A. Azzem, RSC Adv., 2018, 8, 6346–6355 RSC.
- S. Y. Yeh and C. M. Wang, J. Electroanal. Chem., 2006, 592, 131–138 CrossRef CAS.
- A. A. Abd-El-Latif, C. J. Bondue, S. Ernst, M. Hegemann, J. K. Kaul, M. Khodayari, E. Mostafa, A. Stefanova and H. Baltruschat, TrAC, Trends Anal. Chem., 2015, 70, 4–13 CrossRef CAS.
- K. M. Hassan, S. E. Gaber, M. F. Altahan and M. A. Azzem, Electroanalysis, 2018, 30, 1155–1162 CrossRef CAS.
- B. Habibi and S. Mohammadyari, Int. J. Hydrogen Energy, 2015, 40, 10833–10846 CrossRef CAS.
- R. Kannan, A. R. Kim and D. J. Yoo, Chin. Sci. Bull., 2014, 59, 3413–3419 CrossRef CAS.
- Z.-x. Cai, C.-c. Liu, G.-h. Wu, X.-m. Chen and X. Chen, Electrochim. Acta, 2013, 112, 756–762 CrossRef CAS.
- X. Chen, G. Wu, J. Chen, X. Chen, Z. Xie and X. Wang, J. Am. Chem. Soc., 2011, 133, 3693–3695 CrossRef CAS PubMed.
- S. Dash and N. Munichandraiah, Electrochim. Acta, 2012, 80, 68–76 CrossRef CAS.
- J. Solla-Gullón, A. Rodes, V. Montiel, A. Aldaz and J. Clavilier, J. Electroanal. Chem., 2003, 554–555, 273–284 CrossRef.
- A. E. Fetohi, R. S. Amin, R. M. Abdel Hameed and K. M. El-Khatib, Electrochim. Acta, 2017, 242, 187–201 CrossRef CAS.
- R. M. Abdel Hameed, J. Colloid Interface Sci., 2017, 505, 230–240 CrossRef CAS PubMed.
- I. Kanelidis and T. Kraus, Beilstein J. Nanotechnol., 2017, 8, 2625–2639 CrossRef PubMed.
- J. Kao, K. Thorkelsson, P. Bai, B. J. Rancatore and T. Xu, Chem. Soc. Rev., 2013, 42, 2654–2678 RSC.
- K. M. Hassan, A. A. Hathoot, R. Maher and M. Abdel Azzem, RSC Adv., 2018, 8, 15417–15426 RSC.
- Y. Zhang, G. Chang, H. Shu, M. Oyama, X. Liu and Y. He, J. Power Sources, 2014, 262, 279–285 CrossRef CAS.
- G. Yang, Y. Zhou, H. B. Pan, C. Zhu, S. Fu, C. M. Wai, D. Du, J. J. Zhu and Y. Lin, Ultrason. Sonochem., 2016, 28, 192–198 CrossRef CAS PubMed.
- G. Gökag, J. M. Leger and F. Hahn, Z. Naturforsch., B: J. Chem. Sci., 2003, 58, 423–432 Search PubMed.
- L. Liu, X.-X. Lin, Si-Y. Zou, A.-J. Wang, J.-R. Chen and J.-J. Feng, Electrochim. Acta, 2016, 187, 576–583 CrossRef CAS.
- C. Xu, L. Cheng, P. Shen and Y. Liu, Electrochem. Commun., 2007, 9, 997–1001 CrossRef CAS.
- F. Jiang, Z. Yao, R. Yue, Y. Du, J. Xu, P. Yang and C. Wang, Int. J. Hydrogen Energy, 2012, 37, 14085–14093 CrossRef CAS.
- C. Lamy, E. M. Belgsir and J.-M. Leager, J. Appl. Electrochem., 2001, 31, 799–809 CrossRef CAS.
- L. L. Carvalho, F. Colmati and A. A. Tanaka, Int. J. Hydrogen Energy, 2017, 42, 16118–16126 CrossRef CAS.
- R. Kannan, A. R. Kim and D. J. Yoo, J. Appl. Electrochem., 2014, 44, 893–902 CrossRef CAS.
- X. Yang, Q. Yang, J. Xu and C.-S. Lee, J. Mater. Chem., 2012, 22, 8057–8062 RSC.
- J. D. Lović, J. Appl. Chem., 2017, 90, 2039–2045 Search PubMed.
- V. Bambagioni, C. Bianchini, A. Marchionni, J. Filippi, F. Vizza, J. Teddy, P. Serp and M. Zhiani, J. Power Sources, 2009, 190, 241–251 CrossRef CAS.
- S. Yang, X. Zhang, H. Mi and X. Ye, J. Power Sources, 2008, 175, 26–32 CrossRef CAS.
- A. Chatterjee, M. Chatterjee, S. Ghosh and I. Basumallick, Int. J. Nucl. Energy Sci. Technol., 2012, 2, 123–133 Search PubMed.
- S. M. Azab and A. M. Fekry, RSC Adv., 2017, 7, 1118–1126 RSC.
- A. M. Fekry, Biosens. Bioelectron., 2017, 87, 1065–1070 CrossRef CAS PubMed.
- L. L. Van Loon, H. C. Allen and B. E. Wyslouzil, J. Phys. Chem. A, 2008, 112, 10758–10763 CrossRef CAS PubMed.
- A. Eyvazkhani and M. Karimi, Proceedings of the International Conference on Textile Engineering, Rasht, Iran, October 27–29, 2009 Search PubMed.
- T. Lopes, E. Antolini and E. Gonzalez, Int. J. Hydrogen Energy, 2008, 33, 5563–5570 CrossRef CAS.
- Z. X. Liang, T. S. Zhao, J. B. Xu and L. D. Zhu, Electrochim. Acta, 2009, 54, 2203–2208 CrossRef CAS.
- R. Manoharan and J. Prabhuram, J. Power Sources, 2001, 96, 220–225 CrossRef CAS.
- Y. Yu, T. Wang, Y. Fu, W. Su and J. Hu, Int. J. Hydrogen Energy, 2014, 39, 17617–17621 CrossRef CAS.
- Y. Zhao, L. Zhan, J. Tian, S. Nie and Z. Ning, Electrochim. Acta, 2011, 56, 1967–1972 CrossRef CAS.
- X. Yang, X. Wang, G. Zhang, J. Zheng, T. Wang, X. Liu, C. Shu, L. Jiang and C. Wang, Int. J. Hydrogen Energy, 2012, 37, 11167–11175 CrossRef CAS.
- L. Xin, Z. Zhang, J. Qi, D. Chadderdon and W. Li, Appl. Catal., B, 2012, 125, 85–94 CrossRef CAS.
Footnote |
| † Electronic supplementary information (ESI) available. See DOI: 10.1039/c8ra09342c |
| This journal is © The Royal Society of Chemistry 2019 |

