 Open Access Article
Dielectric and photoluminescence properties of fine-grained BaTiO3 ceramics co-doped with amphoteric Sm and valence-variable Cr
Dandan Han ab,
Dayong Lu*b and
Fanling Meng*a
aKey Laboratory of Automobile Materials, Ministry of Education, College of Materials Science and Engineering, Jilin University, Changchun 130012, China. E-mail: mfl@jlu.edu.cn
bResearch Center for Materials Science and Engineering, Jilin Institute of Chemical Technology, Jilin 132022, P. R. China. E-mail: dylu@jlict.edu.cn; Tel: +86 0432 62815308
First published on 5th February 2019
Abstract
(Ba1−xSmx)(Ti1−xCrx)O3 (BSTC) and (Ba1−xSmx)(Ti1−(x−0.01)Crx−0.01)O3 (BSTC1) ceramics with a single-phase perovskite structure were prepared using a traditional solid state based method. The structure, microstructure, site occupations, valence states of Cr, photoluminescence, and dielectric properties of these ceramics were investigated using XRD, SEM, EDXS, RS, EPR, XPS, and dielectric measurements. All ceramics exhibit a fine-grained microstructure (0.7 μm). Three valence states of Cr ions were confirmed and Cr predominates as Cr3+ enter the Ti4+ sites with a stronger EPR signal (1.974). The RS bands of high-wavenumber were attributed to photoluminescence from Sm3+ ions. The formation of  defect complexes play leading roles in the removal of
  prevent the grain growth, and photoluminescence quenching. (Ba1−xSmx)(Ti1−(x−0.01)Crx−0.01)O3 (BSTC1) ceramics with amphoteric Sm3+ ions exhibit a regular diffuse phase transition behavior, rapid Tm-shifting rate of −24.3 °C/at% (Sm/Cr), higher
  lower tan
![[thin space (1/6-em)]](https://www.rsc.org/images/entities/char_2009.gif) δ and x = 0.04 and 0.05 met the EIA Y5V specification.
δ and x = 0.04 and 0.05 met the EIA Y5V specification.
1. Introduction
Barium titanate (BaTiO3) ceramics represent a materials system of fundamental importance for a wide range of technical applications in the field of ceramic capacitors, ferroelectric sensors, optoelectronic devices, actuators, and so on.1–4 During the past few decades, 3d transition metal elements with variable valence as effective acceptor dopants of BaTiO3 ceramics have been mainly applied in ceramic capacitors.4–8 The hexagonal phase can be stabilized at room temperature by doping 3d transition metal acceptors4,5 and may be attributed to Jahn–Teller distortion (such as CrTi4+ (d2) or CrTi5+ (d1)). In addition, most of these reported BaTiO3-based ceramics using doping 3d transition metal elements have one significant drawback: during sintering at high temperature oxygen vacancies and conduction electrons are easily created,6 leading to leakage conductance and making the dielectric material into a semiconductor.
The smaller rare-earth ions (e.g. La (1.36 Å), Nd (1.27 Å) and Sm (1.24 Å)) compared with Ba2+ (1.61 Å) were found to be effective in improving dielectric permittivity and suppressing the hexagonal phase, and forming a single-phase BaTiO3-based ceramic. When rare-earth ions or metal ions are simultaneous substitution on Ba2+ sites and Ti4+ sites, such as (Ba1−xNdx)(Ti1−xMnx)O3,5 (Ba1−xLax)(Ti1−xCrx)O3,7 (Ba1−xNdx)(Ti1−xFex)O3,8 (Ba1−xNax)(Ti1−xNbx)O3,9,10 (Ba1−xSrx)(Ti1−yZry)O3,11 (Ba1−xLax)(Ti1−xYbx)O3,12 (Ba1−xGdx)(Ti1−xScx)O3,13 Ba1−xLnxTi1−xMxO3 (Ln = La, Sm, Gd, Dy. M = Al, Fe, Cr),14 then it is expected that the charge compensation is maintained internally without requiring the creation of defects. These double substitutions BaTiO3-based composites have many advantages over the single substitution in inhibiting grain growth, superior long-term reliability, and high-k Y5V dielectric behavior (note: Electronic Industries Alliance (EIA) code, Y5V specification:  in a temperature range of −30 to 85 °C).
In this work, (Ba1−xSmx)(Ti1−xCrx)O3 (BSTC) and (Ba1−xSmx)(Ti1−(x−0.01)Crx−0.01)O3 (BSTC1) ceramics were prepared using a traditional solid state based method. Sm and Cr are used as co-dopants in BaTiO3 based on the following: (1) Sm ions acting as a donor, predominantly dissolves in Ba2+ sites and induces a common feature of high-k first phase transition (FPT) behavior;14–22 Sm is also known to be an amphoteric dopant in Ba2+ sites and Ti4+ sites for BaTiO3, similar to (Ce23 and Dy24) substitution. It would be interesting to investigate the site occupation of Sm ions; and (2) to investigate the photoluminescence properties of Sm ions. It is well known as good red activators in many matrices due to the 4G5/2 → 6HI/2 (I = 5, 7, 9) transitions of Sm3+ in Ba2+ sites;18–22 and (3) Cr3+ in Ti4+ sites acted as a charge compensator and the main valence state of Cr substituted on Ti4+ sites is changeable. Cr is a element with multiple valence states from +2 to +6. Cr in BaTiO3 is known to be substituted on the Ti4+ sites25–27 due to its closer ionic size {Cr3+ (3d3) (0.615 Å), Cr4+ (3d2) (0.55 Å), Cr5+ (3d1) (0.49 Å)} to Ti4+ (0.605 Å).28 Langhammer reported29 that in air-sintered ceramics chromium is incorporated with valence states 3+ and 4+ when Cr2O3 is chosen as dopant. Moreover, Cr6+ are reduced into Cr4+ and Cr5+ for oxidized sample when Cr6+ ions doped in BaTiO3. Qi indicated that when the acceptor-doped samples were prepared under air condition, due to enough oxygen existence and on the basis of charge balance, the Cr3+ (3d3) can be partly oxidized to form Cr5+ (3d1).30 Our results confirmed that mixed valence states of Cr3+/Cr5+/Cr6+ existed in BSTC and BSTC1. In addition, one encouraging note is that the reduction in Cr concentration by 1% for BSTC1 compared to BSTC induced a regular diffuse phase transition (DPT) behavior. The related works for BaTiO3 ceramics co-doped with amphoteric Sm and valence-variable Cr been rarely reported to date.
2. Experimental
2.1. Synthesis
Ceramics raw materials were reagent-grade BaCO3 (Sinopharm Chemical Reagent, 99.4%), TiO2 (Shanghai Yuejiang Powders, anatase, 99.5%), Sm2O3 (Shanghai Diyang Chemical, 99.99%) and Cr2O3 (Sinopharm Chemical Reagent, 99.0%) powders. The ceramics (Ba1−xSmx)(Ti1−xCrx)O3 (x = 0.01, 0.02, 0.03, 0.04, 0.05) (abbreviated BSTC) and (Ba1−xSmx)(Ti1−(x−0.01)Crx−0.01)O3 (x = 0.02, 0.03, 0.04, 0.05) (BSTC1) were prepared according to the nominal compositions using a traditional solid state based method.8 (Ba1−xSmx)Ti1−x/4O3 (x = 0.05) (abbreviated S5), Ba(Ti1− xCrx)O3 (x = 0.05) (abbreviated Cr5) and pure BaTiO3 ceramics were prepared under the same conditions as BSTC and BSTC1 for comparison. Accurately weighed raw material powders (weighing accuracy reaches 0.0002) were carefully dry-mixed and ground in an agate mortar and then calcined at 1100 °C for 5 h in air at a heating rate of 350 °C h−1. The calcined powders were mixed thoroughly with an aqueous PVA solution (12% by mass) and pressed uniaxially at 200 MPa into disk-like pellets (six pellets of each composition) with 12 mm diameters and 2.0 mm thickness. The final sintering conditions to form the ceramics were chosen as 1400 °C for 12 h in air at a heating rate of 100 °C h−1, a cooling rate of −200 °C h−1 to 700 °C and then furnace-cooled to room temperature.2.2. Characterization
Structural characterization of ceramics was performed by powder X-ray diffraction (XRD) using a DX-2700 X-ray diffractometer (Dandong Haoyuan). Lattice parameters were calculated by MS Modeling (Accelrys) using the Reflex Package and Cu Kα1 radiation (λ = 1.540562 Å).The microstructure was observed using an EVOMA 10 scanning electric microscope (SEM, Zeiss) operated at 15 kV. All ceramics were polished by coarse grinding using diamond grinding plate and fine grinding using diamond paste (grain size: 0.25 mm). The thermal etching at 1400 °C for 12 min was then performed with a heating rate of 6 °Cmin−1 and natural cooling. Finally, the conducting Au atoms were sputtered on the specimen surface for SEM observations. To observe the potential secondary phases, SEM investigations in BSE (backscattered electron) mode were performed. An Aztec 2.3 energy-dispersive X-ray spectrometer (EDXS) (Oxford Instruments) was attached to the SEM for compositional analyses.
The 532 and 638 nm laser was used for excitation in obtaining the Raman spectra (RS) of the ceramics and photoluminescence (PL) of Sm3+ using a LabRAM XploRA Raman spectrometer (Horiba Jobin Yvon).
Electron paramagnetic resonance (EPR) spectra were measured at room temperature using an A300 electron-spin resonance spectrometer system (Bruker BioSpin GMBH, Germany) at an X-band frequency of 9.86 GHz. The EPR cavity of the spectrometer was changed with an ER 4102ST cavity for temperature-dependent EPR measurements at −183 °C with an X-band frequency of 9.44 GHz. The gyromagnetic factor (g) was calculated by the relationship hν0 = gβH, where h is the Planck constant (h = 6.626 × 10⁻³⁴ J s), ν0 is the microwave frequency, β is the Bohr magnetron (β = 9.262 × 10⁻²⁴ J T−1), H is the magnetic field strength.
X-ray photoelectron spectra (XPS) measurements were performed at room temperature using an ESCALAB 250 X-ray photoelectron spectrometer (Thermo Electron). The XPS data raw were processed by smoothing multiply times and the background type of shirley was used for XPS fitting.
The temperature dependences of the dielectric permittivity and the dielectric loss were measured at 1 kHz from −75 to 200 °C at a heating rate of 2 °C min−1 using a Concept 41 Dielectric/Impedance Spectrometer (Novocontrol) with an applied voltage of 1 V (AC). To meet test conditions and give nice pellet surfaces, these ceramics were polished to 0.8 mm thickness by coarse grinding and fine grinding using 1200# and 2000# diamond grinding plate, respectively. The drying was then performed at 500 °C for 120 min and natural cooling. Finally, the surfaces of the polished ceramic disks were sputtered with thin Au atoms and silver paste (5 mm × 5 mm) to form the contact electrodes for the dielectric measurements.
3. Results and discussion
3.1. X-ray diffraction analysis
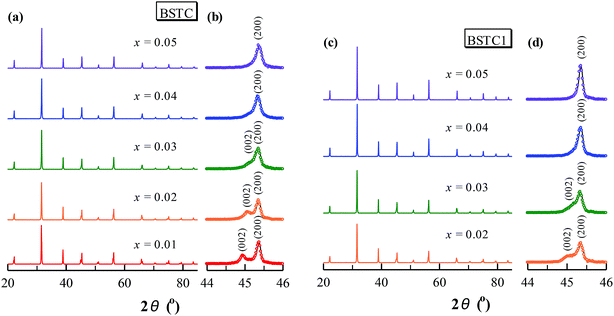
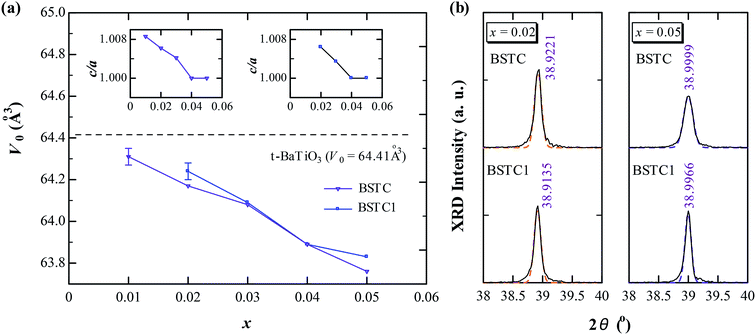
Powder XRD patterns for BSTC and BSTC1 ceramics are shown in Fig. 1. BSTC and BSTC1 exhibit single-phase perovskite structures. No impurity phases are observed within the XRD instrument limits. Tetragonal for x ≤ 0.03, characteristic of two separate (002) and (200) peaks, and cubic for x ≥ 0.04 marked by a symmetric (200) peak, i.e. that the tetragonal-cubic phase transition occurred at x = 0.04 in these two series of ceramics (Fig. 1(b) and (d)).Fig. 2(a) shows the variations in unit-cell volume (V0) as a function of x for BSTC and BSTC1. Two insets depict the tetragonality (c/a) versus x, and it shows that c/a decreases approximately linearly and c/a = 1 (cubic phase) at x = 0.04. The V0 of BSTC and BSTC1 are less than that of the tetragonal BaTiO3 (64.41 Å3, from JCPDS cards no. 05-626) and it decreases with x, approximately following Vegard's law. The V0–x curve of BSTC is lower than that of BSTC1. Meanwhile, when Sm concentration is equal for BSTC and BSTC1 (x = 0.02 and 0.05), the (111) diffraction peak in the vicinity of 39° (Fig. 2(b)) shifts towards a higher angle with the increase of Cr concentration, which suggests that there is a lattice contraction. The result is an abnormal phenomenon because Cr3+ (3d3) (0.615 Å) ion is greater than Ti4+ ion.
So, on the basis of a simple ionic size comparison, the XRD results draw two conclusions: (1) Sm ions (1.24 Å) predominant occupied the Ba2+ sites; and (2) the intermediate ionic size rare-earth ions Sm inevitably occupy the other site no matter which site is designed especially that the reduction in Cr concentration by 1% compared to Sm for BSTC1 ceramics, and Sm3+ (0.958 Å) doping at Ti4+ sites has a larger ionic radius, which is the direct reason for the contraction in V0 for BSTC with x = 0.02 and 0.05 relative to BSTC1 (Fig. 2(b)).
3.2. Microstructure
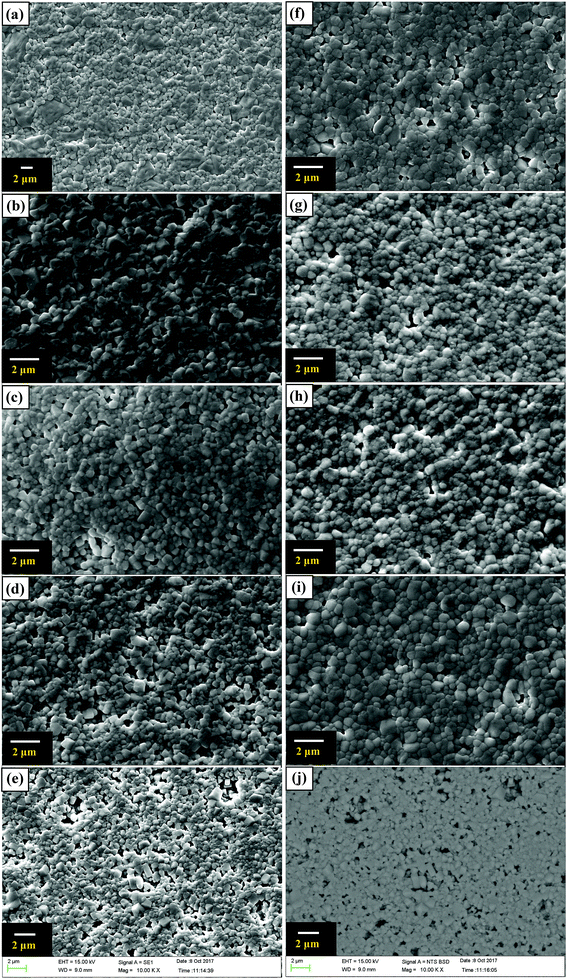
SEM images of these ceramics are shown in Fig. 3. Because of the amounts of these impurity phases may be too small to be detected by XRD, BSE image of BSTC with x = 0.05 was also performed to detect these potential impurity phases (Fig. 3). No abnormal region was observed. The result indicated that no core–shell grains and impurity phases were observed for BSTC and BSTC1 ceramics. All sintered ceramic samples except BSTC with x = 0.01 (a bimodal microstructure consisting of coarse grains (>2.5 μm) and fine grains (∼1.0 μm)) were found to exhibit a uniform grain size (∼0.7 μm), independent of x, especially the specimen BSTC1 with x = 0.05 exhibited homogeneous and dense-grained microstructure. The SEM data indicated Sm and Cr had an effect on the primary particle size. This can be explained that lattice distortion caused by the generation of defect complexes will consume some energy, this hindered the grain boundary migration and prevented the grain growth.3,31,32
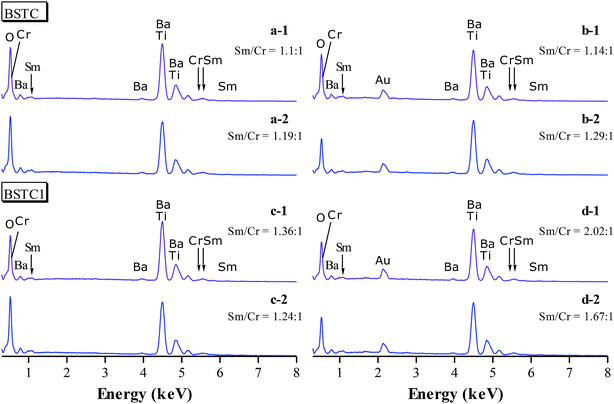
Some blue deposits on the bottom of Al2O3 crucible in the process of sintering could be because Cr6+ can combine O2− to constitute the CrO3, which volatilizes at high temperature condition.30,33 The EDXS of BSTC and BSTC1 with x = 0.05 are performed to detect the actual ratio of Sm to Cr (Fig. 4). The data collected for two samples are showed in Fig. 4 and Table 1. The average ratio of Sm to Cr at a grain and grain boundary junction was determined to be ∼1.15 and ∼1.22 in the surface (no thermally-etched) and the interior (the polished and thermally-etched) for BSTC ceramics, whereas ∼1.3 and ∼1.85 for BSTC1 ceramics, respectively. These EDXS results reveal that (1) the concentration distribution of Sm and Cr in BSTC and BSTC1 was inhomogeneous; (2) the compositions determined from EDXS along with the expected compositions. The real Cr concentration in BSTC and BSTC1 was lower than those in formulas, i.e., the concentration of Sm was higher than that of Cr and the (Ba1−xSmx)(Ti1−xCrx)O3 and (Ba1−xSmx)(Ti1−(x−0.01)Crx−0.01)O3 are not the real formula of BSTC and BSTC1.
| Ba | Ti | Sm | Cr | O | |
|---|---|---|---|---|---|
| a EDXS at a grain boundary junction [(a-2), (b-2), (c-2) and (d-2)] were not occur here. | |||||
| BSTC | |||||
| a-1 | 16.41 | 18.31 | 0.98 | 0.89 | 63.42 |
| b-1 | 17.91 | 18.36 | 0.81 | 0.71 | 62.20 |
![[thin space (1/6-em)]](https://www.rsc.org/images/entities/char_2009.gif) |
|||||
| BSTC1 | |||||
| c-1 | 18.09 | 19.00 | 0.98 | 0.72 | 61.20 |
| d-1 | 20.59 | 21.81 | 1.05 | 0.52 | 56.03 |
3.3. Raman scattering and photoluminescence associated with Sm3+ ions
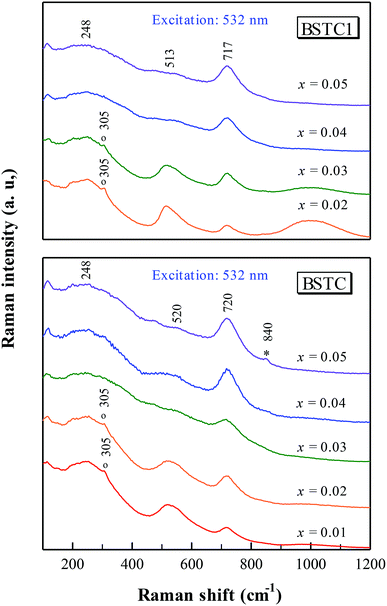
In order to obtain further information on the structure and phase composition with the incorporation of Sm and Cr ions into BaTiO3 lattice, Raman spectra measurements were performed on all samples.BSTC and BSTC1 exhibited the three common Raman bands of the cubic BaTiO3, with peaks at 248 [A1(TO2)], 520 [A1(TO3)], and 720 cm−1 [A1(LO3) + E(LO3)].34 The sharp band at 305 cm−1 (Fig. 5) [B1 + E(TO + LO)] is considered as the signature of the tetragonal phase at room temperature, and the intensity gradually weakens with increasing x, indicating a decrease in tetragonality, which corresponds with XRD results (Fig. 2 inset). In addition, although the XRD technique is a relatively rough method to determine the impurity phases, supposing that no impurity phases is present because the XRD, SEM, BSE and Raman scattering techniques did not detect any impurity phases.
The Raman charge effect at ∼840 cm−1 (Fig. 5)8,23,35 is the Raman evidence for aliovalent substitution in BaTiO3. The band at ≥1000 cm−1 (Fig. 6) which attributed to photoluminescence (PL) properties in Sm3+-doped BaTiO3 ceramics cannot be observed using 638 nm sources, which may be attributed to the inability of the 638 nm lasers to excite the Sm3+ ions, similar to our previous reports.19 Moreover, the reduction in Cr concentration by 1% for BSTC1 (x = 0.02) compared to BSTC (x = 0.02) induced strong PL properties (Fig. 5).
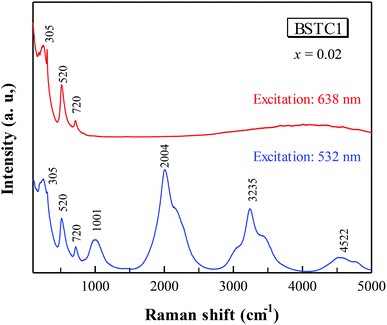 | ||
| Fig. 6 Comparison of Raman spectra for BSTC1 (x = 0.02) upon excitation with 532 and 638 nm laser lines. | ||
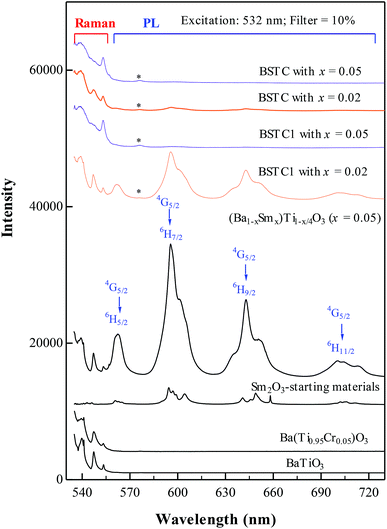
The Raman spectra in high-wavelength in BSTC and BSTC1 with x = 0.02 and 0.05 are shown in Fig. 7. The (Ba1−xSmx)Ti1−x/4O3 (x = 0.05) ceramic, Ba(Ti1−xCrx)O3 (x = 0.05) ceramic, pure BaTiO3 ceramic and Sm2O3-starting materials were prepared for comparison. This was further evidence that the band at ≥1000 cm−1 (Fig. 6) which attributed to photoluminescence properties in Sm3+-doped BaTiO3 ceramics. For the Sm2O3-starting materials, the bands at 595 and 643 nm consisted of three and two peaks, respectively (Fig. 7), whereas the 595 and 643 nm broad band of (Ba1−xSmx)Ti1−x/4O3 (x = 0.05) ceramic showed a single-peak nature. As Cr increased, the PL intensity of Sm3+ ions at Ba2+ sites decreased sharply for BSTC and BSTC1 with x = 0.05 relative to S5.
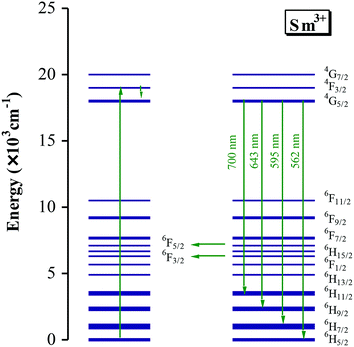
The emission mechanism of PL bands in BSTC and BSTC1 is as follows: Sm3+ ions are excited through one-photon absorption from the ground state 6H5/2 to the excited state 4F3/2 that relaxes nonradiatively to the meta-level 4G5/2 (Fig. 8). Upon 532 nm excitation, four emission peaks at approximately at 562, 595, 643 and 700 nm, corresponding to the Raman shift at 1001, 2004, 3235, and 4522 cm−1, which are attributed to 4G5/2 → 6HI/2 (I = 5, 7, 9 and 11 respectively) transitions of the PL properties of Sm3+ in Ba2+ sites.18–22 As x increased, the PL intensity of Sm3+ ions at Ba2+ sites decreased linearly and PL quenching at x = 0.05. The probable reason is that the formation of the defect cluster  for a number of Sm3+ ions at Ba2+ sites and Cr3+ in Ti4+ sites for Sm and Cr co-doped BaTiO3 relative to (Ba1−xSmx)Ti1−x/4O3 (x = 0.05) ceramics, which inducing energy and electron transfer.
Makishima15 concluded that the emission spectrum of Sm3+ in BaTiO3 is divided into parts A (composed of bands centered at 575, 585, 612, and 626 nm), which is the emission from Sm3+ ions at Ti4+ sites, and B (composed of bands centered at 565, 598, and 645 nm), which is the emission of Sm3+ ions at Ba2+ sites. Murakami16,17 have also deduced that Sm3+ ions occupy both Ba2+ and Ti4+ sites in specimens fired at lower temperatures and doped at higher levels and the emitting state of the A centers has a longer lifetime than that of the B centers. Hence, the weak PL band at ∼575 nm associated with Sm3+ at Ti4+ sites was observed and marked with an asterisk (Fig. 7), which may be attributed that Sm3+ ions is substitution on Ti4+ sites in BSTC1 specimens.
3.4. EPR and XPS associated with valence states of Cr and Ti ions
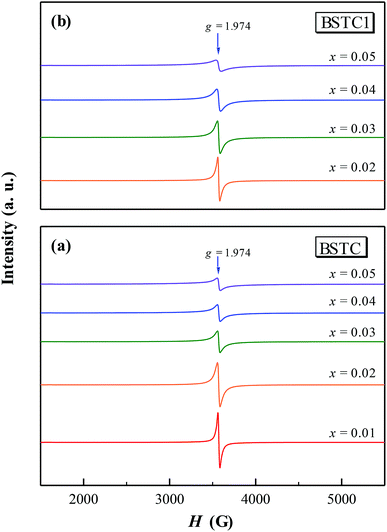
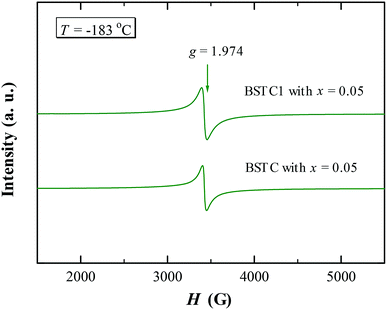
Room temperature EPR spectra of BSTC and BSTC1 ceramics are shown in Fig. 9. A stronger signal at g = ∼1.974 was observed in two samples, which is associated with Cr3+ (3d3, S = 3/2) ions incorporated into BaTiO3. It is based on the following evidences: Ba-vacancy related g = 1.974 signal generally shows a very narrow linewidth.36–38 Moreover this signal corresponds very well to measure results of Müller and Schwartz,26,29 their Cr3+ causing a frequency-independent line width of 240 G. The intensity of this signal is decreased with increasing x for BSTC and BSTC1.Temperature-dependent EPR spectra also provide more information on defects: (1) no Ti vacancies  signal (g = 2.004);37,38 (2) no oxygen vacancies
  existed below −100 °C; (3) Ti3+ (3d1) was also inexistent (g = 1.932) when T = −183 °C;37,39 and (4) the EPR spectra at −183 °C (Fig. 10) did not show any signs of Cr5+ because of the X-band powder spectra of Cr5+ (3d1) in BaTiO3 at a low temperature of 50 K (−223 °C) was reported to evolve into three intense peaks corresponding to a g tensor over a range of 1.94 to 1.99.40
XPS is a powerful probe for the determination of both valence band and core levels. Fig. 11 shows the XPS spectra of Cr 2p and Ti 2p for BSTC with x = 0.05. The spectrum line of Cr 2p shows splitting to two peaks of Cr 2p3/2 and Cr 2p1/2, and the binding energy of 2p3/2 is 576.7, 577.8, 579.1 and 582.1 eV. Binding energy of 576.7, 577.6 and 579.1 eV was responding to the Cr3+, Cr5+ and Cr6+, respectively.30,41 Two additional peaks at 582.1 eV and 591.8 eV originated from satellite peak of Cr3+.42 When the samples were prepared under air condition, due to enough oxygen existence, the Cr3+ (3d3) can be partly oxidized to form Cr5+ (3d1) or Cr6+ (3d0) (Cr4+ (3d2) is not stable and prone to be oxidized to Cr5+ or Cr6+), three valence states of Cr can together exist in the compounds of BSTC and BSTC1. The two prominent Ti 2p peaks originated from Ti 2p1/2 at 463.8 eV and Ti 2p3/2 at 457.9 eV (Fig. 11(b)), which well coincide with other researchers' work on Ti 2p XPS for BaTiO3, SrTiO3 (ref. 43) and LaNaTi2O6 (ref. 44) with Ti4+-ion profile. This reveals that no reduction of Ti4+ to Ti3+ occurs; the Ti ions maintain the stable valence state of 4+. This fact is found to be in line with the EPR results, i.e., Cr predominates as Cr3+ enter the Ti4+ sites with a stronger EPR signal (1.974), we can not detect the positional relation between molecular oxygen and titanium when acceptor like Cr3+ takes the Ti4+ sites because EPR techniques did not detect any  and Ti3+ (3d1). The XPS spectra of BSTC1 with x = 0.05 were also measured and showed similar mixed valence states to those of BSTC with x = 0.05.
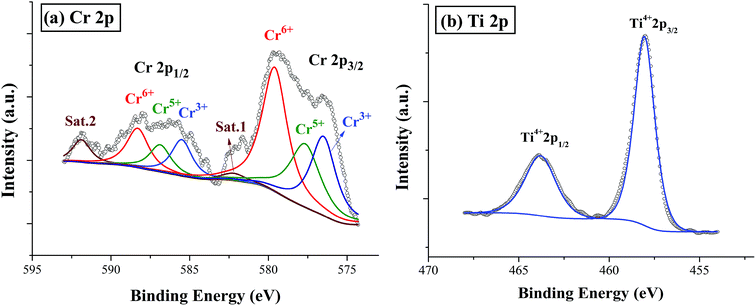 | ||
| Fig. 11 XPS spectra smoothed for BSTC with x = 0.05: (a) Cr 2p, and (b) Ti 2p. Sat. 1 and 2 represent satellite peaks of Cr3+. | ||
For BSTC, the concentrations of Sm and Cr are nearly equal (EDXS, Sm/Cr = ∼1.15 and ∼1.22) (Fig. 4) and the V0 of BSTC is lower than that of BSTC1 (Fig. 2). Sm3+ ions are therefore considered to exist predominantly at the Ba2+ sites. In addition, some Cr ions are lost during sintering at 1400 °C, so the nominal (Ba1−xSmx)(Ti1−xCrx)O3 is not the real formula of BSTC. It is inferred that the loss of Cr in BSTC results in the creation of Ti vacancies (cannot be detected by EPR), one can expect that high valence Cr ions will be formed to maintain the charge neutrality of the material. Thus, the established point defects are Ba2+ sites Sm3+  Ti4+ sites Cr3+
  Cr5+
Cr5+  or Cr6+
  Defect notation proposed by Kröger and Vink was adopted. The formation of
  defect complexes is predominant, which play a role in removal of
  caused by Cr3+.
For BSTC1, most Sm3+ ions are located on the Ba2+ sites and a small number of Sm3+ ions at Ti4+ sites, which induced the formation of a self-compensation mode of  to reduce lattice distortion and maintain the charge neutrality of the material, based on the following three points: (1) the V0–x curve of BSTC is lower than that of BSTC1 (Fig. 2), implying that the partial occupations of Ti4+ sites by Sm3+ induce more significant expansion; and (2) unlike BSTC, BSTC1 exhibits a regular DPT behavior with a higher
  and greatly lower the dielectric loss in the ε′–T curve (Fig. 12) because of Sm3+ as amphoteric dopant in BaTiO3 ceramics; and (3) based on the PL properties of Sm3+, the weak PL band at ∼575 nm (Fig. 7) associated with Sm3+ at Ti4+ sites was observed in BSTC1. The established point defects are Ba2+ sites Sm3+
  Ti4+ sites Sm3+
  Cr3+
Cr3+  Cr5+
Cr5+  or Cr6+
3.5. Dielectric properties
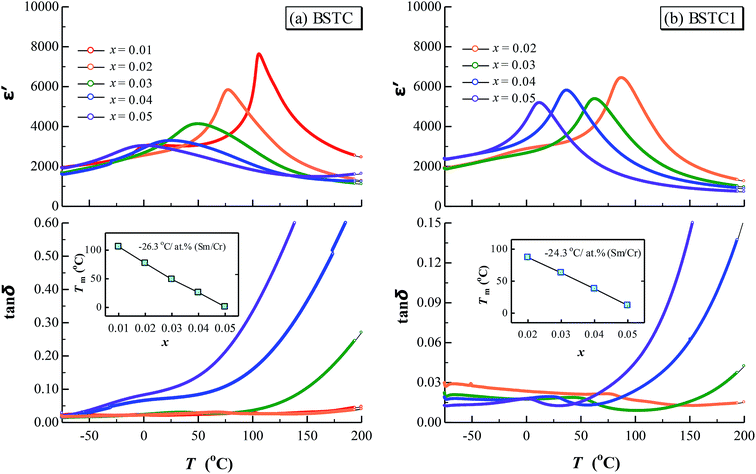
All BSTC and BSTC1 ceramics are electrical insulators at room temperature. Fig. 12 shows the temperature dependence of dielectric properties of BSTC and BSTC1 ceramics measured at 1 kHz over the temperature range from −75 °C to 200 °C. The corresponding dielectric data are given in Table 2. The dielectric-peak temperature (Tm) decreased linearly at a rate of −26.3 and −24.3 °C/at% (Sm/Cr) for BSTC and BSTC1, respectively (Fig. 12 inset), which is consistent with the continuous incorporation of Sm/Cr into the BaTiO3 lattice. The reason based on the following two evidences: (1) the substitution of Ba2+ ions by Sm ions, resulting in Ba2+ sites deficiency to maintain charge neutrality; and (2) the internal compressive stress increases as grain size reduces.3,45 In addition, internal stresses were induced in grains, leading to a broadening of phase transition in BSTC with the increase of x.3 The dielectric constant (ε′) of BSTC and BSTC1 ceramics at low doping levels were higher than BaTiO3 ceramics, which was also related to the dominant effect of the fine-grained on dielectric properties.46| Tm (°C) | tan![[thin space (1/6-em)]](https://www.rsc.org/images/entities/char_2009.gif) δ (RT) δ (RT) |
|||
|---|---|---|---|---|
a  is the maximum permittivity, is the maximum permittivity,  is the room-temperature permittivity, and tan is the room-temperature permittivity, and tan![[thin space (1/6-em)]](https://www.rsc.org/images/entities/char_2009.gif) δ is the room-temperature dielectric loss. δ is the room-temperature dielectric loss. |
||||
| BSTC | ||||
| x = 0.01 | 106 | 7612 | 3009 | 0.02 |
| x = 0.02 | 77.7 | 5817 | 2800 | 0.024 |
| x = 0.03 | 50 | 4113 | 3367 | 0.028 |
| x = 0.04 | 25.6 | 3271 | 3271 | 0.072 |
| x = 0.05 | 0.8 | 3020 | 2846 | 0.1 |
![[thin space (1/6-em)]](https://www.rsc.org/images/entities/char_2009.gif) |
||||
| BSTC1 | ||||
| x = 0.02 | 87.4 | 6424 | 3068 | 0.022 |
| x = 0.03 | 63 | 5371 | 3090 | 0.017 |
| x = 0.04 | 37.2 | 5798 | 4808 | 0.019 |
| x = 0.05 | 12.2 | 5174 | 4474 | 0.012 |
For BSTC, two different peaks are observed for different compositions in BSTC with x = 0.01 and 0.02. The first peak on the side of higher temperatures is approximately 106 and 77.7 °C, and the second peak is located at 4 °C. The dielectric peak becomes broaden and the maximum permittivity  gradually decreases with x, and it decreases from 7612 at x = 0.01 to 3020 at x = 0.05. The dielectric loss (tan
![[thin space (1/6-em)]](https://www.rsc.org/images/entities/char_2009.gif) δ < 0.03) for BSTC below 100 °C was lower at low doping levels of x ≤ 0.03. However, tan
δ < 0.03) for BSTC below 100 °C was lower at low doping levels of x ≤ 0.03. However, tan![[thin space (1/6-em)]](https://www.rsc.org/images/entities/char_2009.gif) δ at x = 0.04 and 0.05 was higher, but the reduction of the Cr concentration in BSTC1 compared to BSTC could greatly lower the dielectric loss, such as tan
δ at x = 0.04 and 0.05 was higher, but the reduction of the Cr concentration in BSTC1 compared to BSTC could greatly lower the dielectric loss, such as tan![[thin space (1/6-em)]](https://www.rsc.org/images/entities/char_2009.gif) δ at x = 0.05 was lowered from 0.1 for BSTC to 0.012 for BSTC1 (Table 2), possible explanation: (1) for BSTC1, the principle of electric neutrality inhibits the electrical conductivity because of Sm3+ as amphoteric dopant in BaTiO3 ceramics, forming a self-compensation mode of
δ at x = 0.05 was lowered from 0.1 for BSTC to 0.012 for BSTC1 (Table 2), possible explanation: (1) for BSTC1, the principle of electric neutrality inhibits the electrical conductivity because of Sm3+ as amphoteric dopant in BaTiO3 ceramics, forming a self-compensation mode of  47 and (2) Mn impurities play an important role in depressing electronic conduction48 and further dielectric loss by trapping electrons in ceramic. However, the Mn2+ sextet signal was not observed for BSTC1, so the reduction of Mn4+ to Mn3+ is predominant49 and the formation of
  defect complexes to prevent further reduction of Mn3+ to Mn2+, i.e., MnTi4+ + e → MnTi3+.
Different from BSTC, BSTC1 exhibits a regular diffusion phase transition (DPT)23 behavior with a higher ε′ and a lower tan![[thin space (1/6-em)]](https://www.rsc.org/images/entities/char_2009.gif) δ (<0.05) for T ≤ 100 °C. The partial occupations of Ti4+ sites by Sm3+ in BSTC1 is the main reason (Fig. 10). BSTC1 with x = 0.04 and 0.05 show the best dielectric performance, and satisfies high-k Y5V dielectric specification with a higher
δ (<0.05) for T ≤ 100 °C. The partial occupations of Ti4+ sites by Sm3+ in BSTC1 is the main reason (Fig. 10). BSTC1 with x = 0.04 and 0.05 show the best dielectric performance, and satisfies high-k Y5V dielectric specification with a higher 
Compare to the dielectric data of BSTC and BSTC1 ceramics, when Sm content is consistent, Cr ions coexisting in Ti4+ sites shifts the Tm to a lower temperature, decreasing the ε′ and increasing the tan![[thin space (1/6-em)]](https://www.rsc.org/images/entities/char_2009.gif) δ. It is obvious that similar to La7,14 or Ce,12,50 Sm3+ (ref. 14) doping acting as a donor, predominantly dissolves in Ba2+ sites and effectively shifts the Tm to a lower temperature, increasing the ε′ and decreasing the tan
δ. It is obvious that similar to La7,14 or Ce,12,50 Sm3+ (ref. 14) doping acting as a donor, predominantly dissolves in Ba2+ sites and effectively shifts the Tm to a lower temperature, increasing the ε′ and decreasing the tan![[thin space (1/6-em)]](https://www.rsc.org/images/entities/char_2009.gif) δ. This is supported by results of Dwivedi and Subramanian,7,14 the lowering of Tm with Sm substitution is first due to its smaller size as compared to Ba which makes tetragonal phase unstable and secondly due to the bond covalency for Sm–O which will decrease shift of Ti and hence reduce its Tm. Presence of Cr on Ti4+ sites will lead to disrupting of Ti–O–Ti links responsible for ferroelectricity,7 which will also lead to lowering of Tm with increasing x.
δ. This is supported by results of Dwivedi and Subramanian,7,14 the lowering of Tm with Sm substitution is first due to its smaller size as compared to Ba which makes tetragonal phase unstable and secondly due to the bond covalency for Sm–O which will decrease shift of Ti and hence reduce its Tm. Presence of Cr on Ti4+ sites will lead to disrupting of Ti–O–Ti links responsible for ferroelectricity,7 which will also lead to lowering of Tm with increasing x.
4. Conclusions
(Ba1−xSmx)(Ti1−xCrx)O3 (x = 0.01–0.05) (BSTC) and (Ba1−xSmx)(Ti1−(x−0.01)Crx−0.01)O3 (x = 0.02–0.05) (BSTC1) ceramics were prepared using a traditional solid state based method. BSTC and BSTC1 with a single-phase perovskite structure are tetragonal for x ≤ 0.03 and pseudo-cubic for x ≥ 0.04. Sm and Cr co-doped BaTiO3 can greatly inhibit the grain growth and form a fine-grained (0.7 μm) but an inhomogeneous dopant concentration distribution (EDXS). Four emission peaks attributed to 4G5/2 → 6HI (I = 5, 7, 9 and 11 respectively) indicates the transitions of Sm3+ at Ba2+ sites and the weak RS band at ∼575 nm associated with Sm3+ at Ti4+ sites for BSTC1. Sm ions exists predominantly as Sm3+ on the Ba2+ sites and a small number of Sm3+ ions enter the Ti4+ sites for BSTC1; no Ti3+, and
and  exists; Cr predominates as Cr3+ enter the Ti4+ sites with a stronger signal 1.974 and three valence states of Cr3+/Cr5+/Cr6+ can together exist. The formation of
  defect complexes play leading roles in removal of
  caused by Cr3+, prevent the grain growth, and PL quenching. The dielectric-peak temperature (Tm) decreased linearly, a broadening of phase transition, and the higher ε′ of BSTC and BSTC1, which were related to the dominant effect of the fine-grained. BSTC1 ceramics with amphoteric Sm3+ ions existed a regular DPT behavior, a rapid Tm-shifting rate of −24.3 °C/at% (Sm/Cr), a higher
  a lower tan
![[thin space (1/6-em)]](https://www.rsc.org/images/entities/char_2009.gif) δ. BSTC1 ceramics with x = 0.04 and 0.05 met the Y5V specification.
δ. BSTC1 ceramics with x = 0.04 and 0.05 met the Y5V specification.
Conflicts of interest
There are no conflicts to declare.Acknowledgements
This work was supported by the projects of the National Natural Science Foundations of China (Grant No. 21271084).Notes and references
- M. Budimir, D. Damjanovic and N. Setter, Appl. Phys. Lett., 2006, 88, 082903 CrossRef.
- Y. Wang, K. Miao, W. Wang and Y. Qin, J. Eur. Ceram. Soc., 2017, 37, 2385–2390 CrossRef.
- W. H. Lee and C. Y. Su, J. Am. Ceram. Soc., 2007, 90, 3345–3348 CrossRef CAS.
- R. Böttcher, H. T. Langhammer and T. Müller, J. Phys.: Condens. Matter, 2009, 21, 075904 CrossRef PubMed.
- Q. Liu, J. Liu, D. Y. Lu, W. Zheng and Ch. Hu, J. Alloys Compd., 2018, 760, 31–41 CrossRef CAS.
- F. Batllo, E. Duverger, J. C. Jules, J. C. Niepce, B. Jannot and M. Maglione, Ferroelectrics, 1990, 109(1), 113–118 CrossRef CAS.
- R. K. Dwivedi, O. Parkash, D. Kumar, K. K. Srivastava and P. Singh, J. Mater. Sci., 2007, 42, 72–79 CrossRef CAS.
- D. D. Han, D. Y. Lu and X. Y. Sun, J. Alloys Compd., 2013, 576, 24–29 CrossRef.
- F. Bahri, H. Khemakhem, M. Gargouri, A. Simon, R. Von der Mühll and J. Ravez, Solid State Sci., 2003, 5, 1229–1234 CrossRef CAS.
- M. T. Benlahrache, N. Benhamla and S. Achour, J. Eur. Ceram. Soc., 2004, 24, 1493–1496 CrossRef CAS.
- Y. Li, H. Cheng, M. Liu, Y. Zhang, P. Yan, C. Wang and J. Ouyang, J. Eur. Ceram. Soc., 2017, 37, 1421–1427 CrossRef CAS.
- A. Feteira and D. C. Sinclair, J. Mater. Chem., 2009, 19, 356–359 RSC.
- D. Yu, A. m. Jin, Q. l. Zhang, H. Yang, L. Hu and D. Cheng, Powder Technol., 2015, 283, 433–439 CrossRef CAS.
- D. Li and M. A. Subramanian, Solid State Sci., 2000, 2, 507–512 CrossRef CAS.
- S. Makishima, K. Hasegawa and S. Shionoya, J. Phys. Chem. Solids, 1962, 23, 749–757 CrossRef CAS.
- T. Murakami, M. Nakahara, T. Miyashita and S. Ueda, J. Am. Ceram. Soc., 1973, 56, 291–293 CrossRef CAS.
- T. Murakami, T. Miyashita, M. Nakahara and E. Sekine, J. Am. Ceram. Soc., 1973, 56, 294–297 CrossRef CAS.
- L. Zhang, H. Pan, H. Liu, B. Zhang, L. Jin, M. Zhu and W. Yang, J. Alloys Compd., 2015, 643, 247–252 CrossRef CAS.
- D. D. Han, Q. L. Liu, Y. D. Wang, C. H. Wang and D. Y. Lu, Ceram. Int., 2016, 42, 8815–8821 CrossRef CAS.
- D. Zhou, X. Cheng, Q. Fu, S. Gong and D. Zhao, Ceram. Int., 2012, 38, 6389–6397 CrossRef CAS.
- G. A. Kumar, J. Phys. Chem. Solids, 2001, 62, 1327–1330 CrossRef CAS.
- Q. Zhang, Y. Zhang, H. Sun, Q. Sun, X. Wang, X. Hao and S. An, J. Eur. Ceram. Soc., 2017, 37, 955–966 CrossRef CAS.
- D. Makovec and D. Kolar, J. Am. Ceram. Soc., 1997, 80, 45–52 CrossRef CAS.
- D. Y. Lu and S. Z. Cui, J. Eur. Ceram. Soc., 2014, 34, 2217–2227 CrossRef CAS.
- Y. Pu, D. Liu and X. Shi, Vacuum, 2014, 99, 38–41 CrossRef CAS.
- R. N. Schwartz and B. A. Wechsler, Phys. Rev. B: Condens. Matter Mater. Phys., 1993, 48, 7057–7069 CrossRef CAS.
- M. S. Castro, W. Salgueiro and A. Somoza, J. Phys. Chem. Solids, 2007, 68, 1315–1323 CrossRef CAS.
- R. D. Shannon, Acta Crystallogr., Sect. A: Cryst. Phys., Diffr., Theor. Gen. Crystallogr., 1976, 32, 751–767 CrossRef.
- H. T. Langhammer, T. Müller, R. Böttcher and H. P. Abicht, J. Phys.: Condens. Matter, 2008, 20, 085206 CrossRef.
- H. Qi, Y. Luan, S. Che, L. Zuo, X. Zhao and C. Hou, Inorg. Chem. Commun., 2016, 66, 33–35 CrossRef CAS.
- A. Yamaji, Y. Enomoto, K. Kinoshita and T. Murakami, J. Am. Ceram. Soc., 1997, 60, 97–101 CrossRef.
- S. K. Jo, J. S. Park and Y. H. Han, J. Alloys Compd., 2010, 501, 259–264 CrossRef CAS.
- X. Liu, W. Su and Z. Lu, J. Phys. Chem. Solids, 2001, 62, 1919–1921 CrossRef CAS.
- M. DiDomenico, S. H. Wemple, S. P. S. Porto and R. P. Bauman, Phys. Rev., 1968, 174, 522–530 CrossRef CAS.
- M. Kchikech and M. Maglione, J. Phys.: Condens. Matter, 1994, 6, 10159 CrossRef CAS.
- D. Y. Lu and Y. Liang, Ceram. Int., 2018, 44, 14717–14727 CrossRef CAS.
- T. Kolodiazhnyi and A. Petric, J. Phys. Chem. Solids, 2003, 64, 953–960 CrossRef CAS.
- T. D. Dunbar, W. L. Warren, B. A. Tuttle, C. A. Randall and Y. Tsur, J. Phys. Chem. B, 2004, 108, 908–917 CrossRef CAS.
- D. Y. Lu, L. F. Yuan, W. N. Liang and Z. B. Zhu, Jpn. J. Appl. Phys., 2016, 55, 011501 CrossRef.
- R. Böttcher, H. T. Langhammer and T. Müller, J. Phys.: Condens. Matter, 2009, 21, 435901 CrossRef PubMed.
- X. Liu, W. Su, Z. Lu, J. Liu, L. Pei, W. Liu and L. He, J. Alloys Compd., 2000, 305, 21–23 CrossRef CAS.
- A. Galtayries, R. Warocquier-Clérout, M. D. Nagel and P. Marcus, Surf. Interface Anal., 2006, 38, 186–190 CrossRef CAS.
- M. Oku, K. Wagatsuma and S. Kohiki, Phys. Chem. Chem. Phys., 1999, 1, 5327–5331 RSC.
- J. P. Miao, L. P. Li, H. J. Liu, D. P. Xu, Z. Lu, Y. B. Song, W. H. Su and Y. G. Zheng, Mater. Lett., 2000, 42, 1–6 CrossRef CAS.
- T. Badapanda, S. K. Rout, S. Panigrahi and T. P. Sinha, Curr. Appl. Phys., 2009, 9, 727–731 CrossRef.
- S. Sharma, R. K. Patel, C. Prakash and P. Kumar, Mater. Chem. Phys., 2011, 130, 191–195 CrossRef CAS.
- J. E. Sunstrom IV and S. M. Kauzlarich, Chem. Mater., 1993, 5, 1539–1544 CrossRef.
- T. R. N. Kutty, P. Murugaraj and N. S. Gajbhiye, Mater. Res. Bull., 1985, 20, 565–574 CrossRef CAS.
- F. Ren and S. Ishida, J. Ceram. Soc. Jpn., 1995, 103, 759–766 CrossRef CAS.
- D. F. K. Hennings, B. Schreinemacher and H. Schreinemacher, J. Eur. Ceram. Soc., 1994, 13, 81–88 CrossRef CAS.
| This journal is © The Royal Society of Chemistry 2019 |

