
 Open Access Article
 This Open Access Article is licensed under a Creative Commons Attribution-Non Commercial 3.0 Unported Licence
Sequential ligand- and structure-based virtual screening approach for the identification of potential G protein-coupled estrogen receptor-1 (GPER-1) modulators†
Shafi Ullah Khan a,
Nafees Ahemadab,
Lay-Hong Chuahac,
Rakesh Naidud and
Thet Thet Htar*a
a,
Nafees Ahemadab,
Lay-Hong Chuahac,
Rakesh Naidud and
Thet Thet Htar*a
aSchool of Pharmacy, Monash University Malaysia, Jalan Lagoon Selatan, Bandar Sunway, 47500 Subang Jaya, Selangor, Malaysia. E-mail: thet.thet.htar@monash.edu
bTropical Medicine and Biology Multidisciplinary Platform, Monash University Malaysia, Jalan Lagoon Selatan, Bandar Sunway, 47500 Subang Jaya, Selangor, Malaysia
cAdvanced Engineering Platform, Monash University Malaysia, Jalan Lagoon Selatan, Bandar Sunway, 47500 Subang Jaya, Selangor, Malaysia
dJeffrey Cheah School of Medicine and Health Sciences, Monash University Malaysia, Jalan Lagoon Selatan, Bandar Sunway, 47500 Subang Jaya, Selangor, Malaysia
First published on 21st January 2019
Abstract
G protein-coupled estrogen receptor-1 (GPER-1) is a seven transmembrane receptor, responsible for mediating rapid estrogen signaling in many physiological responses in reproductive, nervous, endocrine, immune and cardiovascular systems. Due to unavailability of the crystal structure of GPER-1, we have performed sequential ligand-based virtual screening (LBVS) and structure-based screening (SBVS) to identify potential GPER-1 modulators. LBVS and SBVS approaches were validated retrospectively using the Receiver Operating Curve (ROC) plot and the early Enrichment Factor (EF). LBVS was performed based on a GPER-1 agonist, G1, as a query model for screening of the eMolecules library using the Rapid Overlay of Chemical Structure (ROCS) and the electrostatic potential screening (EON) approaches. Top-scored hits from LBVS were further screened by SBVS. SBVS was based on generating homology models of GPER-1 and subsequent molecular docking studies. Using Chemguass4 score, we filtered the final hits with the higher score in comparison to G1 (Chemguass4 score = −11.575). The top-ranked hits were clustered based on similarity in their scaffolds. Prospective validation was performed by evaluating the antiproliferative activity of synthesized compounds (SK0 and SK0P) which were representative of top hits obtained from our virtual screening approach.
1 Introduction
G protein-coupled receptors (GPCRs) are the most significant cell surface receptor superfamily, composed of approximately 900 members. The structural diversity of GPCRs and their physiological functions make them primary targets for therapeutic drugs. GPCRs play a crucial role in many physiological functions as well as in multiple diseases.1 Although at least 500 GPCRs have been identified as therapeutically relevant targets, to-date only a few GPCRs are characterized in apo-form or complex with ligands.2A member of the GPCR family, named G protein-coupled estrogen receptors (GPER-1/GPR30) has been recognized as a novel membrane estrogen receptor. It mediates rapid estrogen signaling in many physiological responses in reproductive, nervous, endocrine, immune and cardiovascular systems. Furthermore, its contribution to the progression of several types of tumors has been reported.3 Due to its involvement in transactivation of the epidermal growth factor receptor (EGFR), the activation of the mitogen-activated protein kinase (MAPK), phosphoinositide3-kinase (PI3K) transduction pathways, the stimulation of adenyl cyclase and the mobilization of intracellular calcium,4 GPER-1 has attracted attention as a promising new drug target.
Computer-aided virtual screening is one of the valid approaches used in the drug discovery process. The two main strategies commonly applied in computer-aided drug discovery are structure-based virtual screening (SBVS) and ligand-based virtual screening (LBVS). SBVS depends on the structure of the target and its interactions with the ligands while LBVS depends on the structural information and molecular properties of known ligands.5,6 Both LBVS and SBVS have been proven to be cost-effective and efficient in generating the leads for further medicinal chemistry development, without requiring complex infrastructures. These methods have been used in search of new drug candidates for therapeutic targets.7
In the absence of a crystal structure of the target protein, computer-aided methodologies have become increasingly useful in identifying the atomic structure of membrane protein from the homologous structure.8 Virtual screening aims to reduce the enormous virtual space of chemical compounds to a manageable number of compounds for further screening against biological targets. In the past few years, in silico virtual screening techniques have been successfully applied in the discovery of new classes of inhibitors for several key therapeutic targets.9,10 Interestingly, the classes of compounds discovered usually differ considerably from the drugs already available.
In this study, we used a sequential application of ligand- and structure-based virtual screening for the identification of GPER-1 modulators. The LBVS process can be based on several techniques, including molecular similarity methods, pharmacophore models or machine learning methods.11 These approaches do not take the target structure directly into account but instead based on the assumption that compounds with a similar topology will present similar biological activity. They are often applied in combination with structure-based approaches to identify potential bioactive hits that can then be fed into docking experiments.12,13 Although various virtual screening procedures have been reported in the literature for different target proteins,14–16 this is the first study of ligand-based virtual screening followed by the structure-based virtual screening of large database compounds for GPER-1 modulating activity. Moreover, we validated our virtual screening model retrospectively and prospectively in order to demonstrate the robustness of the model.
2 Materials and methods
2.1 Retrospective validation of ligand- and structure-based virtual screening approach
2.2 Ligand-based virtual screening (LBVS)
We performed LBVS by using two approaches; shape-based virtual screening and electrostatic potential similarity calculation.Generated ROCS models were employed to screen chemical databases ‘eMolecules v2017.1’ (containing about 7.2 million compounds, eMolecules Inc., La Jolla, CA, USA).25 In ROCS, TanimotoCombo which quantifies both ShapeTanimoto (molecular shape overlay) and ColorTanimoto (chemical functionality overlaps), was selected as a scoring parameter. Compounds having the TanimotoCombo score higher than 1.2 were subjected to further screening.
2.3 Structure-based virtual screening (SBVS)
SBVS requires pre-requisite target protein structure, used in the process of virtual screening. Structure-based virtual screening was performed using homology modeling and molecular docking studies. | ||
| Fig. 1 Stepwise workflow for generating homology model of GPER-1 in Discovery Studio. | ||
Besides the Modeller tool, several online servers, SWISS-MODEL, I-TASSER, and GPCR-MODSIM were used for the generation of GPER-1 models.28–30 GPER-1 models were generated using default settings available both in SWISS-MODEL and I-TASSER servers. In the case of GPCR-MODSIM server, settings were customized to build homology model based on highest sequence similarity for each topological region (N-t, TM1 IL1, TM2, EL1, TM3, IL2, TM4, EL2, TM5, IL3, TM6, EL3, TM7, C-t).
After generation of GPER-1 homology model, RAMPAGE and ModRefiner server were used for assessment and refinement of GPER-1 homology models.31
 | ||
| Fig. 2 Step by step workflow for performing docking-based virtual screening. | ||
2.4 Prospective validation of ligand- and structure-based virtual screening approach
After clustering of hit compounds, two compounds containing the top hit scaffold were synthesized and tested for antiproliferative activities to validate the in silico virtual screening approach prospectively.2.4.1.1 1-((3aR,4R,9bR)-4-(6-Bromobenzo[d][1,3]dioxol-5-yl)-2,3,3a,4,5,9b-hexahydrofuro[3,2-c]quinolin-8-yl)ethan-1-one (SK0). To a solution of 6-bromopiperonal (0.343 g, 1.5 mmol) in acetonitrile (4 mL), p-aminoacetophenone (0.202 g, 1.5 mmol) was added and stirred at room temperature. Then 2,3-dihydrofuran (0.210 g, 3 mmol) and scandium(iii) trifluoromethanesulfonate (Sc(OTf)3) (0.074 g, 0.15 mmol) were added to the mixture. The reaction mixture was then irradiated at 100 °C for 20 minutes using microwave system (150 W). Upon completion of reaction, the volatiles were removed in vacuo and water was added to the mixture. The mixture was then extracted with ethyl acetate. The organic layers were pooled and dried over anhydrous magnesium sulphate (MgSO4). Purification by silica gel flash column chromatography using hexane–ethylacetate (8
![[thin space (1/6-em)]](https://www.rsc.org/images/entities/char_2009.gif) :2 v/v) gave the title compound (0.460 g, 74% yield). Further recrystallization from CH3CN–H2O (2:1 v/v) gave diastereomerically pure compound (SK0) as a white solid product, mp: 204–206 °C.
:2 v/v) gave the title compound (0.460 g, 74% yield). Further recrystallization from CH3CN–H2O (2:1 v/v) gave diastereomerically pure compound (SK0) as a white solid product, mp: 204–206 °C.1H NMR (DMSO-d6, 300 MHz): δ 7.81 (s, 1H, N–H), 7.65 (dd, J = 2.0 Hz, 8.6 Hz, 1H, H-7), 7.27 (s, 1H, H-9), 7.18 (s, 1H, H-19), 6.78 (s, 1H, H-15), 6.73 (d, J = 8.4 Hz, 1H, H-6), 6.11 (d, J = 8.4 Hz, 2H, H-17), 5.16 (d, J = 7.5 Hz, 1H, H-5), 4.94 (d, J = 3 Hz, 1H, H-3a), 3.66–3.62 (m, 2H, H-12), 2.78 (d, J = 7.5 Hz, 1H, H-4), 2.50 (s, 3H, H-11), 1.96–1.83 (m, 1H, H-13), 1.45–1.35 (m, 1H, H-13).13C NMR (DMSO-d6, 75 MHz): δ 195.79 (C![[double bond, length as m-dash]](https://www.rsc.org/images/entities/char_e001.gif) O, C-10), 150.00 (C–N, C-2), 147.94 (C–O, C-16), 147.67 (C–O, C-18), 133.48 (C-14), 131.19 (C-9), 129.20 (C-8), 127.13 (C-7), 120.96 (C-3), 114.64 (C-19), 112.91 (C-20), 112.66 (C-15), 108.80 (C-6), 102.55 (C-17), 74.57 (C-3a), 66.30 (C-12), 54.86 (C-5), 41.34 (C-4), 26.43 (C-11), 24.90 (C-13). FTIR-ATR (cm−1): ν 3343.46 (NH amine), 3299.77 (N–H str), 2875 (CH-str), 1643.80 (CO, conjugated), 1579.93, 1472.08, 1360.26, 1322.75, 1279.57, 1235.14, 1032.84. HRMS (EI-MS) m/z: calcd for C20H18BrNO4 [M + H+]: 415.0419; found: 415.0427 [M + H+].
O, C-10), 150.00 (C–N, C-2), 147.94 (C–O, C-16), 147.67 (C–O, C-18), 133.48 (C-14), 131.19 (C-9), 129.20 (C-8), 127.13 (C-7), 120.96 (C-3), 114.64 (C-19), 112.91 (C-20), 112.66 (C-15), 108.80 (C-6), 102.55 (C-17), 74.57 (C-3a), 66.30 (C-12), 54.86 (C-5), 41.34 (C-4), 26.43 (C-11), 24.90 (C-13). FTIR-ATR (cm−1): ν 3343.46 (NH amine), 3299.77 (N–H str), 2875 (CH-str), 1643.80 (CO, conjugated), 1579.93, 1472.08, 1360.26, 1322.75, 1279.57, 1235.14, 1032.84. HRMS (EI-MS) m/z: calcd for C20H18BrNO4 [M + H+]: 415.0419; found: 415.0427 [M + H+].
2.4.1.2 1-((4aR,5R,10bR)-5-(6-Bromobenzo[d][1,3]dioxol-5-yl)-3,4,4a,5,6,10b-hexahydro-2H-pyrano[3,2-c]quinolin-9-yl)ethan-1-one (SK0P). To a solution of 6-bromopiperonal (0.343 g, 1.5 mmol) in acetonitrile (4 mL), p-aminoacetophenone (0.200 g, 1.5 mmol) was added and stirred at room temperature. Then 3,4-dihydro-2H-pyran (0.252 g, 3 mmol) and scandium(iii) trifluoromethanesulfonate (Sc(OTf)3) (0.074 g, 0.15 mmol) were added to the mixture. The reaction mixture was then irradiated at 100 °C for 20 minutes using microwave system (150 W). Upon completion of reaction, the volatiles were removed in vacuo and water was added to the mixture. The mixture was then extracted with ethyl acetate. The organic layers were combined and dried over anhydrous magnesium sulphate (MgSO4). Purification by silica gel flash column chromatography using hexane–ethyl acetate (8
:2 v/v) gave the title compound (0.427 g, 66% yield). Further recrystallization from CH3CN–H2O (2:1 v/v) gave diastereomerically pure compound (SK0P) as a yellowish-white solid product, mp: 124–126 °C.1H NMR (DMSO-d6, 300 MHz): δ 7.81 (s, 1H, N–H), 7.65 (dd, 1H, J = 2.0 Hz, 8.6 Hz, H-7), 7.27 (s, 1H, H-9), 7.06 (s, 1H, H-20), 6.84 (s, 1H, H16), 6.72 (d, 1H, H-6), 6.09 (d, J = 13.8 Hz, 2H, H-18), 5.18 (d, J = 5.4 Hz, 1H, H-5), 4.88 (d, J = 3 Hz, 1H, H-3a), 3.56–3.53 (m, 1H, H-12), 2.50 (s, 3H, H-11), 2.21–2.18 (m, 1H, H-4), 1.43–1.42 (m, 1H, H-13), 1.10–1.09 (m, 1H, H-14).13C NMR (DMSO-d6, 75 MHz): δ 195.79 (CO, C-10), 150.15 (C–N, C-2), 147.38 (C–O, C-17), 146.73 (C–O, C-19), 131.39 (C-15), 128.86 (C-9), 127.80 (C-8), 126.06 (C-7), 117.48 (C-3), 113.55 (C–Br, C-21), 112.16 (C-16), 108.81 (C-6), 102.00 (C-18), 70.79 (C-3a), 59.60 (C-12), 56.88 (C-5), 34.02 (C-4), 25.87 (C-11), 24.86 (C-13), 18.27 (C-14). FTIR-ATR (cm−1): ν 3323.81 (NH amine), 3299.77 (N–H str), 1644.71 (CO, conjugated), 1598.32, 1570.70, 1503.98, 1473.46, 1356.91, 1290.78, 1231.95, 1089.35, 1036.85. HRMS (EI-MS) m/z: calcd for C21H20BrNO4 [M + H+]: 429.0576, found: 429.0473 [M + H+].
A blank medium was used as a control in the corresponding control wells of the same plate. After incubation for 72 hours, 20 μL of freshly prepared MTT solution was added in the dark into each well and incubated for additional 4 hours at 37 °C until intracellular purple formazan crystals were visible under a microscope. After that spent media, as well as MTT reagents, was removed and 100 μL DMSO as the solubilizing solution was added to dissolve the formazan crystals. The absorbance was measured at 570 nm and 650 nm as a reference wavelength using i-Tecan Infinite M200 microplate reader. All experiments were carried out in triplicate. A non-linear regression analysis of the program PRISM v 7.0 (GraphPad, San Diego, California, USA) was used to fit the dose–response curves and to calculate EC50 values.
3 Results and discussion
3.1 Retrospective validation of ligand- and structure-based virtual screening approach
In this study, we developed a sequential ligand- and structure-based virtual screening of large database in an attempt to find new GPER-1 modulators. Our virtual screening protocol was validated by retrospective statistical metrics and prospective biological assay. To date, no GPER-1 specific Decoy dataset is available in the directory of useful decoys, enhanced (DUD-E) (http://dude.docking.org/) which contains actives and decoys for 102 different targets.19 Therefore, we generated a total of 509 decoys based on the fifteen active GPER-1 ligands using DecoyFinder V 2.0. These decoys have the same physical parameters as actives, but they are chemically distinct in order to act as false positives. Full detail of decoys is shown in the ESI.†The three-dimensional structure of G1 was then generated to use as a query model. To mimics the co-crystallographic ligand, various conformers of G1 were generated using OMEGA 2.5. The best conformer which can discriminate the active GPER-1 ligands from decoy GPER-1 was selected based on the ShapeTanimoto, ColorTanimoto and TanimotoCombo parameters (Fig. 3A and S1†). The area under the curve (AUC) and the early enrichment factor (EF) at 0.5%, 1%, and 2% rate were used to evaluate the overall performance of virtual screening of query model.
Fig. 3A showed the ROC plots of conformer 1 representing the fraction of active GPER-1 ligand (true positives, TP) on the y-axis versus the fraction of decoys (false positives rate, FPR) on the x-axis for each LBVS parameter. Among all, the G1 conformer 1 presented the overall good performance having the highest AUC of 0.797 which indicated that 79.7% of the ligands in the dataset were ranked higher than the decoys. As for the enrichment factor (EF) percentiles, we evaluated our data based on EF1% or lower. The EF1% of the conformer 1 for TanimotoCombo was found to be 28.1 (see Fig. S1†). However, matrices analysis for virtual screening based on EON_ET indicated relatively lower AUC of 0.649 with EF1% of 21.4.
In the case of SBVS, the AUC was observed to reduce to 0.546 with EF1% 6.7, possibly due to the larger active site of GPER-1, thus having the ability to interact with diverse molecular structures. However, SBVS statistical matrices AUC was improved from 0.546 to 0.660 along with the improvement in enrichment factor to 7.6 at the false positive rate of 1% upon docking of only selective GPER-1 ligand (G1, G15, and G36) and their decoys (Fig. 3B).
 | ||
| Fig. 3 ROC plots. (A) The ROC–AUC virtual screening-based on TanimotoCombo, ColorTanimoto, and ShapeTanimoto of G-1. (B) Comparison of the ROC–AUC plots: TanimatoCombo score (blue), electrostatic potential (red), SBVS approach using the whole GPER-1 dataset (black) and SBVS approach using only selective GPER-1 ligands (green). | ||
Overall, the retrospective validation results have supported our approach in the sequential screening of database molecules using LBVS followed by SBVS. The approach is robust to discriminate between active and decoy GPER-1 ligands.
3.2 Ligand-based virtual screening (LBVS)
Shape-based virtual screening was carried out using ROCS. ROCS is a shape-based method for rapid similarity analysis of molecules. After a thorough literature assessment for GPER-1 ligands, G-1 (GPER-1 selective and potent agonist) was selected as the query compound for the generation of shape-based screening model. The pharmacophoric features of G-1 generated is depicted in Fig. 4. We hypothesized that screening hits with a similar molecular shape to G-1 would have an excellent GPER-1 modulation activity.41
 | ||
| Fig. 4 Ligand-based pharmacophoric features of G-1. | ||
In this analysis, ROCS color function assigned ten distinct pharmacophore features to G-1 query model, in which tetrahydro-3H-cyclopenta[c]quinoline along with benzo[d][1,3]dioxole core was well-defined by five ring features. The query model presented with three hydrogen bond acceptor features from the two oxygen atoms in benzo[d][1,3]dioxole core, and one oxygen atom of the acetophenone group. Also, the amine and bromine (Br) served as a hydrogen-bond donor and hydrophobic feature respectively.
The generated ROCS query model was then applied in the virtual screening of large database of eMolecules library. The structural complementarity between the template and the screened molecules was evaluated by TanimotoCombo score (ROCS_TC) consisting of both ShapeTanimoto (ROCS_ST) and the ColorTanimoto (ROCS_CT). After shape-based virtual screening using ROCS_TC, top 5000 hits were retained for further in silico screening. Result analysis depicted that the highest ROCS_TC score of 1.861 for the top hit compound while the lowest ROCS_TC score was 1.204 as shown in Fig. 5.
 | ||
| Fig. 5 Histogram representation of the ROCS_TanimotoCombo (ROCS_TC) score distribution for the top 5000 hits. | ||
During the screening, ROCS compares database compounds and the query by aligning the compounds and calculating the similarities including their volumes and chemical features. The similarity is evaluated and represented by a TanimotoCombo score, ranging from 0 to 2. With TanimotoCombo score close to 2, molecules will have an excellent shape and chemical-feature match, while the value close to 0 implies poor shape and chemical-feature dissimilarities.
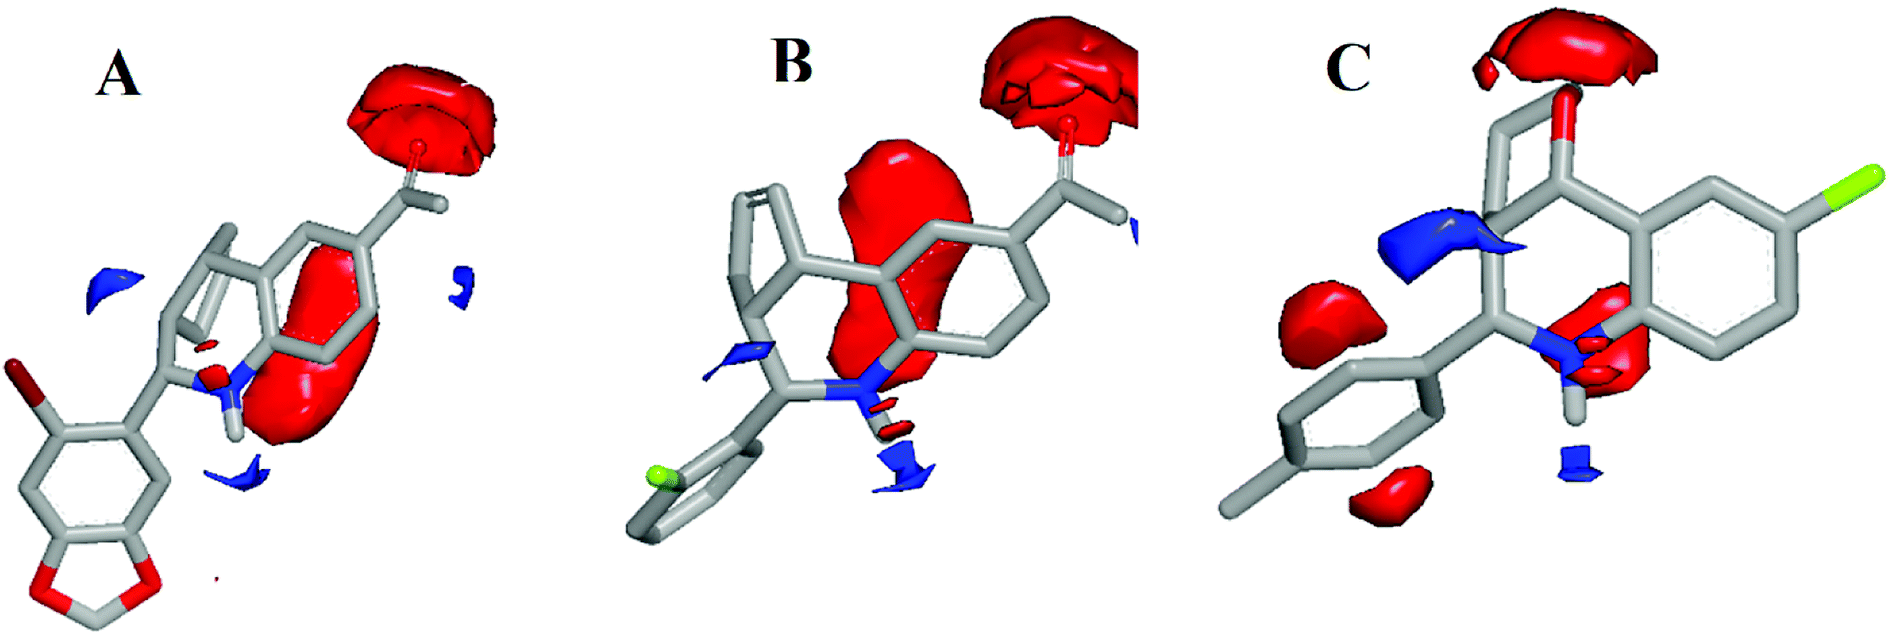 | ||
| Fig. 6 EON Combo score of hits in comparison to G1. (A) G1 at extreme left has default EON_TC score of 2, (B) the top hits (score 1.651) and (C) the lowest hits (score 1.112). Red color indicates the electronegative area while blue colour indicated the electropositive area. | ||
3.3 Structure-based virtual screening (SBVS)
3.3.1.1 Template selection. Template selection and alignment are the preliminary steps in which the intended program or server relates the sequence of query with the template structure deposited in Protein Data Bank (PDB). The most widely used server in this process is Basic Local Alignment Search Tool (BLAST) which compared the sequence of query protein to the sequence in databases. The search identified thirty-six different templates and the CXCR4 chemokine receptor (PDB ID: 3ODU) with the resolution of 2.50 Å was the best template with 46% sequence similarity. The best hit template was compared with previously reported templates based on the sequence similarity, E-value, resolutions, co-crystallized ligands as shown in Table 1.
3.3.1.2 Alignment of query and template sequence. All templates listed in Table 1 were selected and aligned with GPER-1 sequence (Q99527) using the alignment tool in Discovery studio.
3.3.1.3 Homology models generation using Modeller. After the alignment of query and template sequence, Built-in Modeller tool in Discovery Studio was used for the generation of GPER-1 homology models. Top 20 models were generated for each template. These models were then analysed based on Discrete Optimized Protein Energy (DOPE) score and a model with the lowest DOPE score for each template was selected as the best model. Table 2 illustrates DOPE scores of all best models of each template.
3.3.1.4 Homology modeling of GPER-1 using online servers. Addition to Modeller tool in Discovery studio, models were generated using online servers such as SWISS-MODEL, I-TASSER, and GPCR-MODSIM. GPER-1 models were obtained using default settings from both SWISS-MODEL and I-TASSER. Among online servers, only GPCR-MODSIM server allows the full optimization of sequence comparison for each topological region, that is, (N-terminal (N-t), transmembrane1 (TM1), intracellular1 (IL1), TM2, extracellular (EL1), TM3, IL2, TM4, EL2, TM5, IL3, TM6, EL3, TM7, C-t). GPCR-MODSIM identified 20 different templates based on sequence identity for each topological region as listed in Fig. 7. Based on the highest sequence identity percentage, five templates (4YAY, 4DJH, 3OE0, 4DKL, 3ODU) were identified as the best templates and used for generating of the GPER-1 homology model.
 | ||
| Fig. 7 The percentage of GPER-1 protein sequence identity with five selected templates (4YAY, 4DJH, 3OE0, 4DKL, 3ODU) at topological regions; N-terminal (N-t), transmembrane1 (TM1), intracellular loop (IL), extracellular loop (EL) and C-terminal (C-t). | ||
3.3.1.5 Assessment and refinement of all generated models. Ramachandran plots of models were generated by RAMPAGE, to assess all generated models. The refinement of generated models was then carried out using ModRefiner server. Table 3 presents a comparative analysis of Ramachandran plots before and after refinement. Each model displayed improvement in the stereochemistry after refinement as revealed by the comparatively smaller number of residues in the outlier region. Due to a smaller number of amino acid residues in the outlier region, the number of residues becomes comparatively higher in both favoured and allowed region.
| Template PDB ID | Before refinement | After refinement | ||||
|---|---|---|---|---|---|---|
| Number of residues in favoured region | Number of residues in allowed region | Number of residues in outlier region | Number of residues in favoured region | Number of residues in allowed region | Number of residues in outlier region | |
| 3ODU (DS) | 323 (95.3%) | 11 (3.2%) | 5 (1.5%) | 331 (97.6%) | 6 (1.8%) | 2 (0.6%) |
| 1U19 (DS) | 305 (85.4%) | 34 (9.5%) | 18 (5.0%) | 325 (91.0%) | 23 (6.4%) | 9 (2.5%) |
| 1F88 (DS) | 321 (90.2%) | 22 (6.2%) | 13 (3.7%) | 339 (95.2%) | 14 (3.9%) | 3 (0.8%) |
| Active state 3SN6 (DS) | 354 (94.9%) | 13 (3.5%) | 6 (1.6%) | 364 (97.6%) | 7 (1.9%) | 2 (0.5%) |
| Inactive state 2RH1 (DS) | 360 (96.5%) | 9 (2.4%) | 4 (1.1%) | 368 (98.7%) | 4 (1.1%) | 1 (0.3%) |
| 3ODU (SWISS-MODEL) | 258 (92.8%) | 18 (6.5%) | 2 (0.7%) | 269 (96.8%) | 7 (2.5%) | 2 (0.7%) |
| I-TASSER | 292 (78.3%) | 51 (13.7%) | 30 (8.0%) | 352 (94.4%) | 14 (3.8%) | 7 (1.9%) |
| 3ODU (GPCR MODSIM) | 348 (93.3%) | 21 (5.6%) | 4 (1.1%) | 360 (96.5%) | 10 (2.7%) | 3 (0.8%) |
| Multi template (GPCR MODSIM) | 355 (95.2%) | 14 (3.8%) | 4 (1.1%) | 361 (96.8%) | 11 (2.9%) | 1 (0.3%) |
 | ||
| Fig. 8 The 3D structure representation of the best GPER-1 model (in the middle). Ramachandran plot representation of GPER-1 model before and after refinement are shown in the left and right side respectively. | ||
| Active site | Area (SA) | Volume (SA) | Interacting amino acid residues within the active pocket of GPER-1 |
|---|---|---|---|
| 1 | 1477.1 | 1396.0 | Leu49, Ser50, His52, Gln53, Gln54, Ile57, Gly58, Leu61, Ser62, Tyr65, Phe68, Leu108, Val109, Asp111, Ser112, Ile114, Glu115, Val116, Asn118, Leu119, His120, Arg122, Tyr123, Cys130, Met133, Ser134, Leu137, Gln138, Asn140, Met141, Ser144, Val145, Pro192, Val196, His200, Asp202, Ala204, Cys205, Phe206,Cys207, Phe208, Asp210, Arg212, Glu213, Val214, Gln215, Trp216, Glu218, Val219, Gly222, Phe223, Ile224, Phe268, Phe269, Trp272, Leu273, Glu275, Asn276, Phe278, Ile279, Ser280, His282, Leu283, Arg286, Phe298, His300, Ala301, His302, Leu304, Thr305, Asn310, Leu311, Phe314, Asn316, Ser317 |
The Chemgauss4 score of the best binding pose of GPER-1 selective ligands (G1, G-36, and G-15) was −11.5754, −11.3850 and −9.1130 respectively. Docking studies of virtual hits obtained from ROCS and EON indicated that the docking score of the top 100 ROCS and EON hit compounds were higher than that of selective ligands of GPER-1. Among the top 100 compounds, 1-((3aS,4S,9bR)-4-(3-fluorophenyl)-3a,4,5,9b-tetrahydro-3H-cyclopenta[c]quinolin-8-yl)ethan-1-one (code: 6120497_SRS_10) exhibited the highest score of −14.67. Upon comparison, the best scoring poses of docked ligands were noted to have the same docking orientations as GPER-1 selective ligands.
 | ||
| Fig. 9 Binding interactions of GPER-1 ligands. (a) Superimposition of best-docked poses of G1, G-15, and G-36 displayed in blue, grey, and cyan respectively. (b) Binding interactions of G1, (c) binding orientation of G15 and (d) binding interaction of G36 with the amino acids of GPER-1 (golden). Hydrogen bonding, electrostatic and hydrophobic bonds are shown in green, yellow and pink color dotted lines respectively. Amino acid residues are shown in golden sticks. | ||
Besides, hydrogen bonding network was formed by amino acid Glu218 with NH group of G1. Moreover, the amino acid residue of Asp210 contributed in hydrogen bond network to one of the oxygens in dioxole moiety, while Glu218 and Gln138 were involved in forming pi-anion and pi-donor hydrogen bond respectively with the aromatic ring of benzodioxole moiety of G1. Additional hydrophobic interactions were formed by the amino acid residues of Ile279, Met141, Leu137. In this hydrophobic interaction Leu137, Met141 were making hydrophobic interaction with the bromine atom of G-1.
Binding analysis of G-36 depicted hydrogen bond interaction between Gln218 and NH moiety of G36, pi-anion interaction between Gln218 and the aromatic ring of benzoxazole moiety, and hydrophobic interaction between Leu137 and the bromine atom of G36. Moreover, other electrostatic and hydrophobic interactions were formed by amino acid residues Leu304, Ile279, Val219, Leu137, Met141, and Ile279.
 | ||
| Fig. 10 Binding interactions of top hits compound in each identified scaffold within the active site of GPER-1. Hydrogen bond interactions are shown in green dotted line while hydrophobic interactions are shown in pink dotted line. | ||
In the binding analysis of G-15, the orientation of G-15 was noted to be similar to that of G1 and G36. Amino acid residues involved in hydrogen bonding and hydrophobic interaction of G-15 were alike G-36, but due to the absence of isopropyl moiety in G-15, the hydrophobic interaction with this moiety was not observed in G-15.
The analysis of docking calculation resulted in about 100 top hits which had higher Chemgauss4 score compared to the GPER-1 selected ligands: G1 (query compound), G15 and G36. Based on the Chemgauss4 score, five different scaffolds (shown in Table 5) were identified in top 100 hits, namely, (3aS,4S,9bR)-4-phenyl-3a,4,5,9b-tetrahydro-3H-cyclopenta[c]quinoline (compound 6120497_SRS_10), (4aS,5S,10bS)-5-phenyl-3,4,4a,5,6,10b-hexahydro-2H-pyrano[3,2-c]quinoline (compound 27191896_S_0), (3aR,4S,11cS)-4-phenyl-3a,4,5,11c-tetrahydro-3H-benzo[f]cyclopenta[c]quinoline (compound 1275536_RSS), 3-(1-(benzo[d][1,3]dioxol-5-ylmethyl)-1H-imidazol-2-yl)-1H-pyrazole (compound 36597047_125) and (3aS,4S,9bS)-4-phenyl-2,3,3a,4,5,9b-hexahydrofuro[3,2-c]quinoline (compound 32861528_S_2) Fig. 10 shows the binding interactions of top hits compounds listed in Table 5.
| Selected compound Code | Structure | FRED Chemgauss4 score | EON_Comb score | ROCS_TC score |
|---|---|---|---|---|
| 6120497_SRS_10 |  |
−14.67 | 1.208 | 1.371 |
| 27191896_S_0 |  |
−13.84 | 1.115 | 1.298 |
| 1275536_RSS |  |
−13.03 | 1.195 | 1.303 |
| 36597047_125 |  |
−12.78 | 1.209 | 1.228 |
| 32861528_S_2 |  |
−11.87 | 1.168 | 1.355 |
Interestingly, the topmost identified scaffolds in the present study, namely (3aS,4S,9bR)-4-phenyl-3a,4,5,9b-tetrahydro-3H-cyclopenta[c]quinoline are reported in US patent in 2008 by E. R. Prossnitz et al. A comparison of the amino acid residues involved in the binding of the best hits and GPER-1 selective ligands revealed that seven different amino acid residues (Met141, Val219, Gly222, Phe223, Trp272, Ile279 and Ser280) were forming hydrophobic interaction while amino acid residue Glu218 was involved in forming hydrogen bond with amine group of hit compounds.
In agreement with our results, recently in 2018 Cao L.-Y. et al. has shown involvement of almost the same amino acid residues in the binding of GPER-1 ligands at the active site of GPER-1.5,53 Similar to their observation, in the present study binding of the best scaffold compound, (3aS,4S,9bR)-4-phenyl-3a,4,5,9b-tetrahydro-3H-cyclopenta[c]quinoline, (4aS,5S,10bS)-5-phenyl-3,4,4a,5,6,10b-hexahydro-2H-pyrano[3,2-c]quinoline, (3aR,4S,11cS)-4-phenyl-3a,4,5,11c-tetrahydro-3H-benzo[f]cyclopenta[c]quinoline, 3-(1-(benzo[d][1,3]dioxol-5-ylmethyl)-1H-imidazol-2-yl)-1H-pyrazole and (3aS,4S,9bS)-4-phenyl-2,3,3a,4,5,9b-hexahydrofuro[3,2-c]quinoline at the active site of the GPER-1 formed similar hydrophobic interactions thereby signifying the validation of our in silico virtual screening approach.
3.4 Prospective validation of virtual screening
 | ||
| Fig. 11 General scheme for the synthesis of SK0 and SK0P using microwave irradiation. | ||
| Compound codes | EC50 (μM) | Chemguass4 scores | |
|---|---|---|---|
| SK-BR-3 | MCF-7 | ||
| G-1 | 0.54 | 39.92 | −11.580 |
| SK0 | 2.77 | 6.69 | −11.690 |
| SK0P | 9.26 | 10.83 | −11.000 |
Among the compounds, G1 exhibited anti-proliferative activities against SK-BR-3 and MCF7 having EC50 value of 0.54 μM and 39.92 μM respectively. Relatively, SK0 and SK0P elicited higher antiproliferative activities in SK-BR-3 cell lines (EC50 = 2.77) than in MCF-7 cell lines. Likewise, SK0P presented EC50 value of 9.26 μM in SK-BR-3 cell lines which were higher than in MCF 7. The observation of better antiproliferative activity in SK-BR-3 breast cancer cell lines is in positive relationship with its higher expression of GPER-1 protein compared to MCF-7 cell lines. Therefore, hits identified from eMolecules using our adopted sequential ligand and structure-based virtual screening can be considered worthy for further screening of biological activity against GPER-1 protein.
4 Conclusion
In the present study, we demonstrated that the adopted in silico virtual screening protocol is an indispensable tool for hit identification in the domain of small molecule GPER-1 modulators. We reported herein the sequential ligand-based and structure-based virtual screening procedure that can be employed in the identification of new GPER-1 modulators. Retrospective metrics and the in vitro evaluation of antiproliferative activity validated the model. Starting from the retrospective validation of virtual screening procedure, followed by the virtual screening of commercial database of 7 million compounds, only 100 compounds were identified as potential GPER-1 ligands. Interestingly, the identified molecules possessing similar scaffolds which were reported as potent GPER-1 ligands in literature. The antiproliferative activity of two compounds representing the top-ranked scaffold further confirmed that the virtual screening protocol developed in this study is reliable and worthwhile.Conflicts of interest
The authors declare that they have no competing financial interests.Acknowledgements
We are grateful to the anonymous referees for their informative comments, suggestions and insights for improving this manuscript. The authors would like to thank Ministry of Higher Education (FRGS, grants no. FRGS/1/2015/ST01/MUSM/03/1) for financial support. We also thanks OpenEye Scientific Software for providing a free academic license to perform in silico studies.References
- M. O'Hayre, M. S. Degese and J. S. Gutkind, Curr. Opin. Cell Biol., 2014, 27, 126–135 CrossRef PubMed.
- A. S. Hauser, M. M. Attwood, M. Rask-Andersen, H. B. Schiöth and D. E. Gloriam, Nat. Rev. Drug Discovery, 2017, 16, 829 CrossRef CAS PubMed.
- E. R. Prossnitz and M. Barton, Nat. Rev. Endocrinol., 2011, 7, 715 CrossRef CAS PubMed.
- M. Maggiolini and D. Picard, J. Endocrinol., 2010, 204, 105–114 CAS.
- L.-Y. Cao, X.-M. Ren, Y. Yang, B. Wan, L.-H. Guo, D. Chen and Y. Fan, Environ. Health Perspect., 2018, 126, 069001 CrossRef PubMed.
- S. Vilar, G. Cozza and S. Moro, Curr. Top. Med. Chem., 2008, 8, 1555–1572 CrossRef CAS PubMed.
- L. Tan, H. Geppert, M. T. Sisay, M. Gütschow and J. Bajorath, ChemMedChem, 2008, 3, 1566–1571 CrossRef CAS PubMed.
- C. Rosano, R. Lappano, M. F Santolla, M. Ponassi, A. Donadini and M. Maggiolini, Curr. Med. Chem., 2012, 19, 6199–6206 CrossRef CAS PubMed.
- S. Sandhaus, P. P. Chapagain and Y.-C. Tse-Dinh, Sci. Rep., 2018, 8, 1437 CrossRef PubMed.
- E. D. Brown and G. D. Wright, Nature, 2016, 529, 336 CrossRef CAS PubMed.
- R. S. Ferreira, R. V. Guido, A. D. Andricopulo and G. Oliva, Expert Opin. Drug Discovery, 2011, 6, 481–489 CrossRef CAS PubMed.
- H. Eckert and J. Bajorath, Drug discovery today, 2007, 12, 225–233 CrossRef CAS PubMed.
- A. D. Andricopulo, R. V. Guido and G. Oliva, Curr. Med. Chem., 2008, 15, 37–46 CrossRef.
- P. Kolb, D. M. Rosenbaum, J. J. Irwin, J. J. Fung, B. K. Kobilka and B. K. Shoichet, Proc. Natl. Acad. Sci. U. S. A., 2009, 106, 6843–6848 CrossRef CAS PubMed.
- C. N. Cavasotto, W. Orry and J. Andrew, Curr. Top. Med. Chem., 2007, 7, 1006–1014 CrossRef CAS PubMed.
- D. R. Weiss, A. Bortolato, B. Tehan and J. S. Mason, J. Chem. Inf. Model., 2016, 56, 642–651 CrossRef CAS PubMed.
- A. Cereto-Massagué, L. Guasch, C. Valls, M. Mulero, G. Pujadas and S. Garcia-Vallvé, Bioinformatics, 2012, 28, 1661–1662 CrossRef PubMed.
- T. Sterling and J. J. Irwin, J. Chem. Inf. Model., 2015, 55, 2324–2337 CrossRef CAS PubMed.
- M. M. Mysinger, M. Carchia, J. J. Irwin and B. K. Shoichet, J. Med. Chem., 2012, 55, 6582–6594 CrossRef CAS PubMed.
- A. N. Jain and A. Nicholls, J. Comput.-Aided Mol. Des., 2008, 22, 133–139 CrossRef CAS PubMed.
- A. K. Akobeng, Acta Paediatr., 2007, 96, 644–647 CrossRef PubMed.
- S. Lätti, S. Niinivehmas and O. T. Pentikäinen, J. Cheminf., 2016, 8, 45 Search PubMed.
- P. C. Hawkins, A. G. Skillman and A. Nicholls, J. Med. Chem., 2007, 50, 74–82 CrossRef CAS PubMed.
- P. C. Hawkins, A. G. Skillman, G. L. Warren, B. A. Ellingson and M. T. Stahl, J. Chem. Inf. Model., 2010, 50, 572–584 CrossRef CAS PubMed.
- P. Thomas, Y. Pang, E. Filardo and J. Dong, Endocrinology, 2005, 146, 624–632 CrossRef CAS PubMed.
- EON. 2.2.0.5, OpenEye Scientific Software, Santa Fe, NM. http://www.eyesopen.com Search PubMed.
- M. y. Shen and A. Sali, Protein Sci., 2006, 15, 2507–2524 CrossRef CAS PubMed.
- A. Roy, A. Kucukural and Y. Zhang, Nat. Protoc., 2010, 5, 725 CrossRef CAS PubMed.
- T. Schwede, J. Kopp, N. Guex and M. C. Peitsch, Nucleic Acids Res., 2003, 31, 3381–3385 CrossRef CAS PubMed.
- M. Esguerra, A. Siretskiy, X. Bello, J. Sallander and H. Gutiérrez-de-Terán, Nucleic Acids Res., 2016, 44, W455–W462 CrossRef CAS PubMed.
- D. Xu and Y. Zhang, Biophys. J., 2011, 101, 2525–2534 CrossRef CAS PubMed.
- J. Dundas, Z. Ouyang, J. Tseng, A. Binkowski, Y. Turpaz and J. Liang, Nucleic Acids Res., 2006, 34, W116–W118 CrossRef CAS PubMed.
- M. McGann, J. Chem. Inf. Model., 2011, 51, 578–596 CrossRef CAS PubMed.
- OEDocking. 3.2.2, OpenEye Scientific Software, Santa Fe, NM, 2017, http://www.eyesopen.com Search PubMed.
- E. F. Pettersen, T. D. Goddard, C. C. Huang, G. S. Couch, D. M. Greenblatt, E. C. Meng and T. E. Ferrin, J. Comput. Chem., 2004, 25, 1605–1612 CrossRef CAS PubMed.
- R. Burai, C. Ramesh, M. Shorty, R. Curpan, C. Bologa, L. A. Sklar, T. Oprea, E. R. Prossnitz and J. B. Arterburn, Org. Biomol. Chem., 2010, 8, 2252–2259 RSC.
- C. Wang, X. Lv, C. He, G. Hua, M. Tsai and J. S. Davis, Cell Death Dis., 2013, 4, e869 CrossRef CAS PubMed.
- W. Wei, Z. Chen, K. Zhang, X. Yang, Y. Wu, X. Chen, H. Huang, H. Liu, S. Cai and J. Du, Cell Death Dis., 2014, 5, e1428 CrossRef CAS PubMed.
- D.-S. Kim, C.-M. Kim, C.-I. Won, J.-K. Kim, J. Ryu, Y. Cho, C. Lee and J. Bhak, J. Biomol. Struct. Dyn., 2011, 29, 219–242 CrossRef CAS PubMed.
- H.-P. Sun, J.-M. Jia, F. Jiang, X.-L. Xu, F. Liu, X.-K. Guo, B. Cherfaoui, H.-Z. Huang, Y. Pan and Q.-D. You, Eur. J. Med. Chem., 2014, 79, 399–412 CrossRef CAS PubMed.
- C. G. Bologa, C. M. Revankar, S. M. Young, B. S. Edwards, J. B. Arterburn, A. S. Kiselyov, M. A. Parker, S. E. Tkachenko, N. P. Savchuck and L. A. Sklar, Nat. Chem. Biol., 2006, 2, 207–212 CrossRef CAS PubMed.
- A. Bruno, F. Aiello, G. Costantino and M. Radi, Mol. Inf., 2016, 35, 333–339 CrossRef CAS PubMed.
- F. Aiello, G. Carullo, F. Giordano, E. Spina, A. Nigro, A. Garofalo, S. Tassini, G. Costantino, P. Vincetti and A. Bruno, ChemMedChem, 2017, 12, 1279–1285 CrossRef CAS PubMed.
- R. Lappano, C. Rosano, P. De Marco, E. M. De Francesco, V. Pezzi and M. Maggiolini, Mol. Cell. Endocrinol., 2010, 320, 162–170 CrossRef CAS PubMed.
- M. Pupo, A. Pisano, R. Lappano, M. F. Santolla, E. M. De Francesco, S. Abonante, C. Rosano and M. Maggiolini, Environ. Health Perspect., 2012, 120, 1177 CrossRef CAS PubMed.
- D. Méndez-Luna, M. Martínez-Archundia, R. C. Maroun, G. Ceballos-Reyes, M. Fragoso-Vázquez, D. González-Juárez and J. Correa-Basurto, J. Biomol. Struct. Dyn., 2015, 33, 2161–2172 CrossRef PubMed.
- R. Lappano, C. Rosano, A. Pisano, M. F. Santolla, E. M. De Francesco, P. De Marco, V. Dolce, M. Ponassi, L. Felli and G. Cafeo, Dis. Models Mech., 2015, 8, 1237–1246 CrossRef CAS PubMed.
- R. Lappano, M. F. Santolla, M. Pupo, M. S. Sinicropi, A. Caruso, C. Rosano and M. Maggiolini, Breast Cancer Res., 2012, 14, R12 CrossRef CAS PubMed.
- V. Sarmiento, I. Ramirez-Sanchez, A. Moreno-Ulloa, D. Romero-Perez, D. Chávez, M. Ortiz, N. Najera, J. Correa-Basurto, F. Villarreal and G. Ceballos, Bioorg. Med. Chem. Lett., 2018, 28, 658–663 CrossRef CAS PubMed.
- C. K. Arnatt and Y. Zhang, Mol. Inf., 2013, 32, 647–658 CrossRef CAS PubMed.
- H. Hu, J. Xia, D. Wang, X. S. Wang and S. Wu, Int. J. Mol. Sci., 2017, 18, 137 CrossRef PubMed.
- F. Aiello, G. Carullo, F. Giordano, E. Spina, A. Nigro, A. Garofalo, S. Tassini, G. Costantino, P. Vincetti and A. Bruno, ChemMedChem, 2017, 12, 1279–1285 CrossRef CAS.
- L.-Y. Cao, X.-M. Ren, C.-H. Li, J. Zhang, W.-P. Qin, Y. Yang, B. Wan and L.-H. Guo, Environ. Sci. Technol., 2017, 51, 11423–11430 CrossRef CAS PubMed.
Footnote |
| † Electronic supplementary information (ESI) available. See DOI: 10.1039/c8ra09318k |
| This journal is © The Royal Society of Chemistry 2019 |