 Open Access Article
Effect of metal-doped VPO catalysts for the aldol condensation of acetic acid and formaldehyde to acrylic acid
Yumeng Wang,
Yuelin Hou,
Xue Hao,
Zhenlu Wang and
Wanchun Zhu
 *
*
Key Laboratory of Surface and Interface Chemistry of Jilin Province, College of Chemistry, Jilin University, Jiefang Road 2519, Changchun, 130021, P. R. China. E-mail: wczhu@jlu.edu.cn; Fax: +86 0431 85168420; Tel: +86 0431 88964193
First published on 18th February 2019
Abstract
Mo, W, Cr, La, and Ce additives were introduced into a VPO catalyst, and the resulting catalysts were investigated for the gas-phase aldol condensation reaction of formaldehyde and acetic acid. XRD, FT-IR, SEM, NH3-TPD, Py-IR, and BET were used to characterize the structure and properties of the catalysts. After the addition of the third component, the crystal structure changed to a certain extent; the surface acidity of the catalyst changed, and the conversion of acetic acid and the selectivity of acrylic acid also showed different degrees of influence. The acidity of the catalyst was the main factor affecting the catalytic performance. When La was added to the catalyst, the selectivity for acrylic acid was the highest, and the stability of the catalyst also improved. It is presumed that B acid is the main active site of this reaction, and a moderate amount of acid is favorable to facilitate the reaction.
1 Introduction
Acrylic acid, which is an important raw material and resin monomer for organic synthesis, is widely used in the construction industry, textile industry, packaging products, sanitary materials, etc.1–5 The methods to produce acrylic acid include cyanoethanol hydrolysis (alcoholysis),6 acetylene carbonylation,7–11 acrylonitrile hydrolysis,12 and propylene oxidation.13–16 Among them, the propylene oxidation technology has long been established and is widely used by companies in various countries. However, since the 1970s, faced with the rise in oil prices and the oversupply of methanol and acetic acid in coal chemical products, a process using condensation of acetic acid and formaldehyde to produce acrylic acid has emerged. This is a non-petroleum synthetic route and has numerous potential applications.The aldol condensation reaction of acetic acid and formaldehyde produces mainly acrylic acid and water but is also accompanied by side reactions, producing acetone, carbon dioxide, methyl acetate, etc. Current research shows that the catalyst system with better activity is a vanadium phosphorus oxide catalyst.17–25 As the study progressed, it was found that the introduction of other components into the VPO catalyst significantly improved the catalytic performance. There are two methods used: one is to restore V5+ first and then introduce, and the other includes introduction of the precursor after preparation.
Mamoru Ai26 proposed the introduction of Si (V/P/Si = 1/2/2.2) and Ti (V/Ti/P = 1/2/5) into the V2O5–P2O5 system. To conduct the acrylic acid reaction, the catalyst performances are ranked as V/Ti/P > V/P > V/Si/P.
In the patent of Jianren Tai,27 organic titanium (including titanium lactate, titanium alkanolamine, and titanium acetylacetonate), which can be dissolved in water and has redox activity, is mixed with vanadium and phosphorus. By the modification of the alkali metal, the surface area of the catalyst is increased, and the acidity of the catalyst is improved. It has a high catalytic performance in the reaction of formaldehyde and acetic acid. After calculation on the basis of acetic acid, the yield of acrylic acid can reach 33.7%.
Zhang et al.28 loaded lanthanum onto a VPO catalyst for the reaction of methyl acetate and formaldehyde. The introduction of La improves the stability of the reaction, avoids changes in the vanadium valence, and improves the performance of the catalyst. A transition metal, such as molybdenum, is introduced into the VPO catalyst for the reaction of methanol with acetic acid. The yield of the target product acrylic acid can reach 80%.29 D. Nagaki30 introduced cesium salt and tungsten salt into the VPO catalyst. The obtained catalyst was used for the aldol condensation of formaldehyde and acetic acid to increase the conversion of acetic acid.
In order to further improve the activity and selectivity of the catalyst, the influence of the promoter on the structural properties of the catalyst and the performance of the catalytic reaction was examined. In our present work, MVPO (M: Mo, W, Cr, La, Ce) catalysts were prepared and used in the reaction of acetic acid and formaldehyde to prepare acrylic acid. The structures and properties of the catalyst were confirmed by XRD, FT-IR, SEM, NH3-TPD, Py-IR, BET, etc. The relationships among the compositions, structural properties and reaction performances of the catalysts were discussed.
2 Experimental
2.1 Catalyst preparation
MVPO catalysts were prepared by the organic route as described below.19,24,25 V2O5 (5 g) was refluxed for 4 h at a certain temperature (110 °C) in a mixture of benzyl and isobutyl alcohols. After the temperature of the solution decreased to 50 °C, appropriate amounts of the metal salt of component M (the M/V molar ratio was 0.06/1) and orthophosphoric acid were added. After refluxing for four hours, the obtained suspension was filtered and then dried at 100 °C overnight to yield the desired catalyst precursor. The catalyst precursor was calcined under air atmosphere at 550 °C for five hours to obtain a catalyst. The prepared catalyst was named as MVPO (M: Mo, W, Cr, La, Ce).2.2 Catalyst characterization
Powder X-ray diffraction (XRD) was carried out using a Shimadzu XRD-6000 diffractometer with Cu-Kα radiation. The catalysts were operated at 30 kv and 40 mA with a scan step of 10° min−1 in the 2θ range from 10 to 70°.Fourier transform infrared spectroscopy (FT-IR) was performed with a Nicolet Impact 410 spectrometer to record the infrared characteristic absorption peaks of the catalysts. The solid samples were prepared using KBr as a diluent and detected in the wavenumber range of 4000–400 cm−1.
Topographical information was obtained by a JSM-6700F scanning electron microscope (SEM).
The acidity of catalysts was measured by the temperature programmed desorption of NH3 (NH3-TPD). The ChemBET Pulsar TPR/TPD device was used with helium as a carrier gas and detected using a TCD detector. Also, 50 mg catalyst was thermally treated at 550 °C with flowing N2 for 30 min and then cooled to 80 °C prior to adsorption. After that, the sample was purged with He to remove physical adsorption. After the baseline was stable, the system was heated from 80 °C to 800 °C with a heating rate of 10 °C min−1. The amount of chemisorbed ammonia was detected with a TCD detector.
Pyridine adsorption infrared spectroscopy (Py-IR) was performed with a self-made pyridine adsorption infrared device. After the catalyst was pressed into a pure tablet, it was fixed in a pyridine adsorption infrared cell (the device was evacuated) and heated to 473 K for 30 minutes for pretreatment. Afterwards, the temperature was lowered to room temperature; pyridine adsorption was performed for 30 min, and vacuum desorption was performed at room temperature for 10–15 min. The catalyst was heated to 373 K or 473 K under vacuum for 30 minutes to allow desorption, and it was finally tested at room temperature.
Hydroxyl infrared spectroscopy (OH-IR) was performed with a Nicolet Impact 410 spectrometer. The catalyst was compressed and fixed in the infrared sample cell. After the device was evacuated to a high vacuum, the temperature was increased to 373 K, 473 K and 623 K for 30 minutes. After cooling to room temperature, the infrared absorption peak of the sample was tested.
The total surface area and pore structure of the catalysts were measured in a Micromeritics ASAP 2010 instrument. After the sample was dehydrated under vacuum at 473 K, it was tested at 77 K in a liquid nitrogen atmosphere. The BET method was used to calculate the specific surface area and the BJH method was used to calculate the pore distribution.
2.3 Catalytic evaluation
The activity of the condensation of acetic acid and formaldehyde to acrylic acid was evaluated in a fixed bed flow reaction system. The reaction material was triacetaldehyde dissolved in acetic acid solution. The reaction product was analyzed by gas chromatography on-line and quantified by the internal standard method. The relevant calculation formula is as follows:The conversion of acetic acid (HAc):
The selectivity of acrylic acid (AA):
The yield of acrylic acid (AA):
| YAA = CHAcSAA × 100% |
3 Results and discussion
3.1 XRD analysis
The XRD patterns of VPO and MVPO precursors are shown in Fig. 1. All of the precursors have diffraction peaks at 15.5°, 19.6°, 24.1°, 27.0°, 28.6°, 31.9°, 33.6°, 34.3°, 37.4°, 47.7°, 49.1°, and 63.4°, which are attributed to the VOHPO4·0.5H2O (JCPDS 84-0761) phases. Among them, the diffraction lines at 2θ = 15.5° and 31.9° correspond to the (001) and (220) crystal planes of VOHPO4·0.5H2O. It can be seen from the figure that the (220) planes of each precursor are preferentially grown. The intensity of the characteristic peaks of the (001) planes of the precursors to which the scandium and yttrium components are added increased relatively. It can be concluded that the crystal phase composition of precursors with different additives is consistent, and La and Ce additives have a certain role in improving the microcrystalline phase structure of the precursor.31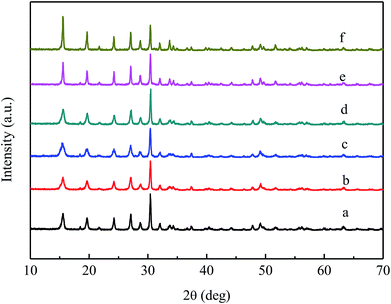 | ||
| Fig. 1 XRD patterns of VPO and MVPO precursors. (a) VPO; (b) MoVPO; (c) WVPO; (d) CrVPO; (e) LaVPO; (f) CeVPO. | ||
Fig. 2 shows the XRD patterns of the VPO and MVPO catalysts; a represents the XRD pattern of the VPO catalyst. The diffraction lines at 2θ = 11.9°, 18.6°, 23.9°, 28.7°, 31.2°, 37.8°, 41.1°, and 42.6° were typical of the VOPO4·2H2O (JCPDS 36-1472) phase.
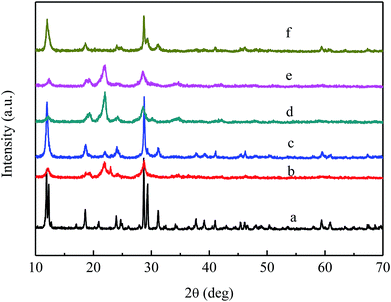 | ||
| Fig. 2 XRD patterns of VPO and MVPO catalysts. (a) VPO; (b) MoVPO; (c) WVPO; (d) CrVPO; (e) LaVPO; (f) CeVPO. | ||
The curves of (b–f) show the XRD patterns of VPO catalysts with different components. It can be seen from the figure that the addition of different components has different effects on the crystal phase of the catalyst. The diffraction peaks of (b) at 22.0°, 24.2°, 28.5°, 34.7°, and 42.0° were attributed to the characteristic peak of the δ-VOPO4 (JCPDS 47-0951) phase, and the characteristic peaks appearing at 11.9° and 28.7° were typical of the VOPO4·2H2O (JCPDS 27-0949) phase. The strong diffraction peaks of (c) and (f) at 11.9°, 18.6°, 23.9°, 28.7°, 31.2°, 37.8°, 41.1°, and 42.6° belonged to the VOPO4·2H2O (JCPDS 36-1472) phase. The diffraction lines of d at 2θ = 19.5°, 22.0°, 24.2°, 28.5°, 34.7°, and 42.0° were typical of the δ-VOPO4 (JCPDS 47-0951) phase. The diffraction peaks of (e) at 19.5°, 22.0°, 24.2°, 28.5°, 34.7° and 42.0° were attributed to the characteristic peak of the δ-VOPO4 (JCPDS 47-0951) phase, and the characteristic peaks appearing at 11.9° and 28.7° were typical of the VOPO4·2H2O (JCPDS 36-1472) phase.
In summary, the crystal phases of the VPO, CeVPO and WVPO catalysts belonged to the VOPO4·2H2O (JCPDS 36-1472) crystal phase. The crystal phase of the Cr-added catalyst belonged to the δ-VOPO4 (JCPDS 47-0951) crystal phase. The crystal phases of MoVPO and LaVPO catalysts belonged to the mixed crystal phase of δ-VOPO4 (JCPDS 47-0951) and VOPO4·2H2O (JCPDS 27-0949) crystal phases.
3.2 FT-IR analysis
Fig. 3 shows the FT-IR spectra of VPO and MVPO precursors. All precursors exhibited infrared absorption peaks at 3371 cm−1, 1646 cm−1, 1199 cm−1, 1105 cm−1, 1045 cm−1 and 641 cm−1. The band at 3371 cm−1 belongs to the stretching vibration absorption peak of O–H. The peaks appearing at 1646 cm−1 are attributed to the bending vibration absorption peaks of the coordinated water molecules. The bands at 1199 cm−1, 1105 cm−1, and 1045 cm−1 are the asymmetric stretching vibration absorption peaks of PO3. The bands at 977 cm−1 and 641 cm−1 correspond to the stretching vibration absorption peak of V![[double bond, length as m-dash]](https://www.rsc.org/images/entities/char_e001.gif) O and the bending vibration absorption peak of P–OH. This is consistent with the infrared spectrum of the VOHPO4·0.5H2O crystal phase.31
O and the bending vibration absorption peak of P–OH. This is consistent with the infrared spectrum of the VOHPO4·0.5H2O crystal phase.31
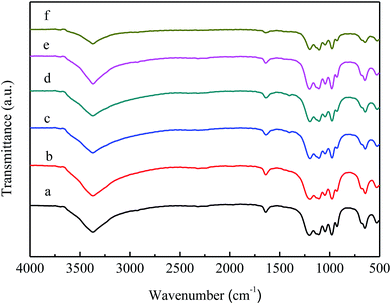 | ||
| Fig. 3 FT-IR spectra of VPO and MVPO precursors. (a) VPO; (b) MoVPO; (c) WVPO; (d) CrVPO; (e) LaVPO; (f) CeVPO. | ||
Fig. 4 shows the FT-IR spectra of VPO and MVPO catalysts. All catalysts exhibited infrared absorption peaks at 1244 cm−1, 1023 cm−1, 990 cm−1, 975 cm−1, 644 cm−1 and 606 cm−1. The peak at 1244 cm−1 belongs to the stretching vibration absorption peak of ν(PO)3. The bands at 1023 cm−1 are attributed to the stretching vibration absorption peaks of V![[double bond, length as m-dash]](https://www.rsc.org/images/entities/char_e001.gif) O. The absorption peaks at 990 cm−1, 975 cm−1, and 606 cm−1 belong to the P–O and V–O stretching vibration absorption peaks of VOPO4 and VOPO4·2H2O. The peaks appearing at 644 cm−1 are attributed to the bending vibration absorption peaks of P–OH.
O. The absorption peaks at 990 cm−1, 975 cm−1, and 606 cm−1 belong to the P–O and V–O stretching vibration absorption peaks of VOPO4 and VOPO4·2H2O. The peaks appearing at 644 cm−1 are attributed to the bending vibration absorption peaks of P–OH.
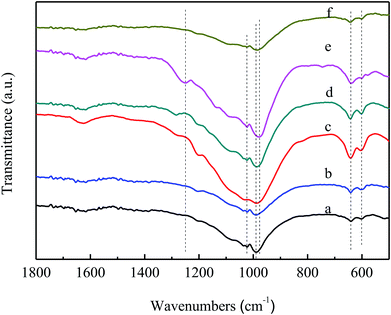 | ||
| Fig. 4 FT-IR spectra of VPO and MVPO catalysts. (a) VPO; (b) MoVPO; (c) WVPO; (d) CrVPO; (e) LaVPO; (f) CeVPO. | ||
3.3 NH3-TPD analysis
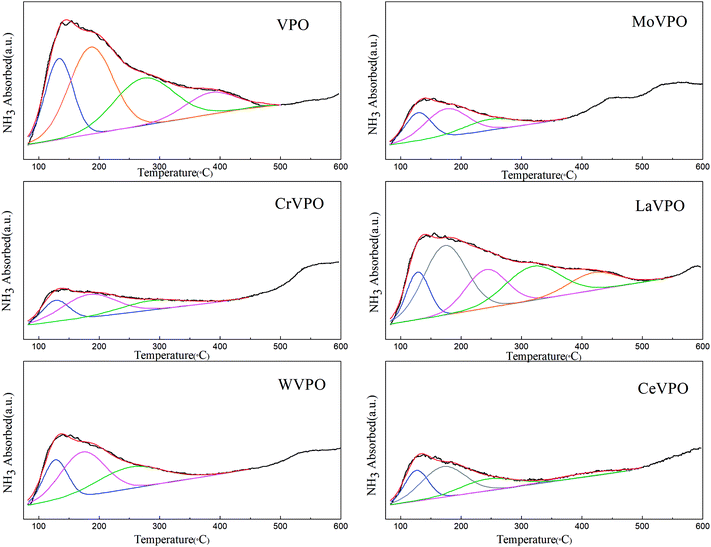
Fig. 5 shows the NH3-TPD comparison of the VPO and MVPO catalysts with desorption temperatures from 80 to 600 °C. The peak fitting results of the NH3-TPD profiles are shown in Fig. 6 and summarized in Table 1. As shown in the figure, the NH3 desorption peaks for all the catalysts appear at temperatures in the range of 80–300 °C, which correspond to the weak and middle-strong acid sites.32,33 Among them, a wide range of NH3 desorption peaks appear at 350–500 °C for (a), (b), and (c) (VPO, LaVPO, and CeVPO), which correspond to strong acid sites. For the LaVPO catalyst, the proportion of strong acid sites is the largest (32.58%). To investigate the type of acid sites of the catalysts, they were further analyzed by pyridine infrared absorption spectroscopy.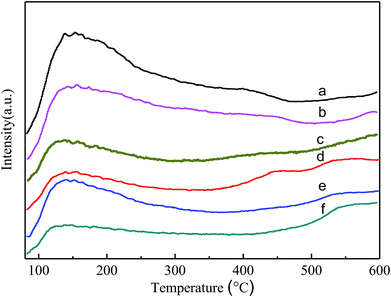 | ||
| Fig. 5 NH3-TPD patterns of VPO and MVPO catalysts. (a) VPO; (b) LaVPO; (c) CeVPO; (d) MoVPO; (e) WVPO; (f) CrVPO. | ||
| Catalyst | Peak center (°C) | Peak area | Proportion (%) |
|---|---|---|---|
| VPO | 133.8 | 81.0 | 22.50 |
| 186.5 | 137.9 | 38.32 | |
| 273.8 | 101.4 | 11.02 | |
| 384.6 | 39.7 | 28.16 | |
| CrVPO | 128.3 | 20.2 | 23.69 |
| 183.6 | 43.9 | 51.49 | |
| 287.0 | 21.2 | 24.82 | |
| LaVPO | 128.4 | 39.1 | 12.95 |
| 173.6 | 107.8 | 35.71 | |
| 241.8 | 56.6 | 18.76 | |
| 319.3 | 67.4 | 22.31 | |
| 418.8 | 31.0 | 10.27 | |
| MoVPO | 129.2 | 26.5 | 29.74 |
| 175.9 | 42.5 | 47.60 | |
| 247.6 | 20.2 | 22.66 | |
| WVPO | 127.7 | 35.5 | 22.67 |
| 173.1 | 70.6 | 45.08 | |
| 252.2 | 50.5 | 32.25 | |
| CeVPO | 126.3 | 26.1 | 24.95 |
| 171.0 | 47.5 | 45.36 | |
| 243.7 | 22.9 | 7.81 | |
| 405.1 | 8.2 | 21.88 |
3.4 Py-IR analysis
To investigate the type of acid sites on the VPO catalyst and the third component-added catalyst, we performed Py-IR characterization of VPO, MoVPO, WVPO, CrVPO, LaVPO, and CeVPO catalysts. Fig. 7 shows the pyridine infrared spectra of the VPO catalyst and the MVPO catalysts. According to the literature,34–36 the absorption peaks at 1445 cm−1, 1595 cm−1, and 1611 cm−1 belong to L acid sites, the absorption peaks at 1640 cm−1 and 1540 cm−1 are attributed to B acid sites, and the absorption peaks at 1480 cm−1 are the common adsorption sites of L acid and B acid. For the VPO catalyst, the L acid sites are provided by the coordination unsaturated V ions and the B acid sites are provided by P–OH.37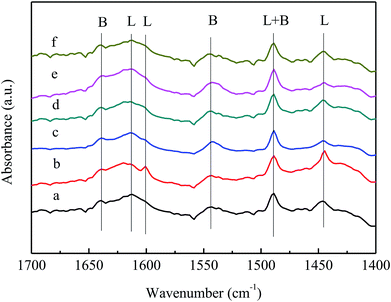 | ||
| Fig. 7 Py-IR spectra of VPO and MVPO catalysts. (a) VPO; (b) MoVPO; (c) WVPO; (d) CrVPO; (e) LaVPO; (f) CeVPO. | ||
As shown in Fig. 7, the peak position of the pyridine absorption peak of the VPO catalyst after the addition of the third component did not change, indicating that the type of catalyst acid center did not change. The peak intensities of (c) and (e) (WVPO and LaVPO) at 1445 cm−1 decreased, indicating that the introduction of W and La reduced the quantities of L acid. The intensity of (b) (MoVPO) peak is strong, indicating that the introduction of Mo increases the quantities of L acid and B acid.
Fig. 8 shows the pyridine infrared spectrum of the LaVPO catalyst at different desorption temperatures. It can be seen that as the desorption temperature increases, the peak position of the pyridine absorption peak does not change, the peak intensity slightly decreases, the number of L weak acid sites decreases, and the B acid remains stable.
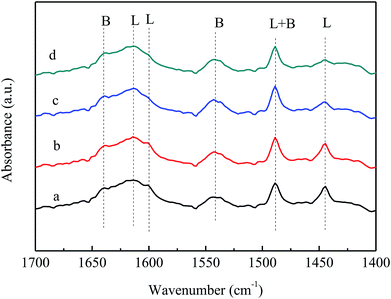 | ||
| Fig. 8 Py-IR spectra of LaVPO with different desorption temperatures. (a) LaVPO-25 °C; (b) LaVPO-100 °C; (c) LaVPO-150 °C; (d) LaVPO-200 °C. | ||
3.5 OH-IR analysis
In order to further study the acidity of the catalyst surface, the above catalysts were characterized by in situ hydroxyl infrared spectroscopy. Fig. 9 shows the OH-IR spectra of different catalysts treated at 100 °C, 200 °C and 350 °C. As the temperature increases, some hydroxyl peaks disappear and some hydroxyl peaks remain. The disappearing hydroxyl peak belongs to a hydroxyl group that adsorbs water molecules or hydrogen bonds. The steady state of the infrared hydroxyl peak is attributed to the isolated hydroxyl group on the catalyst surface.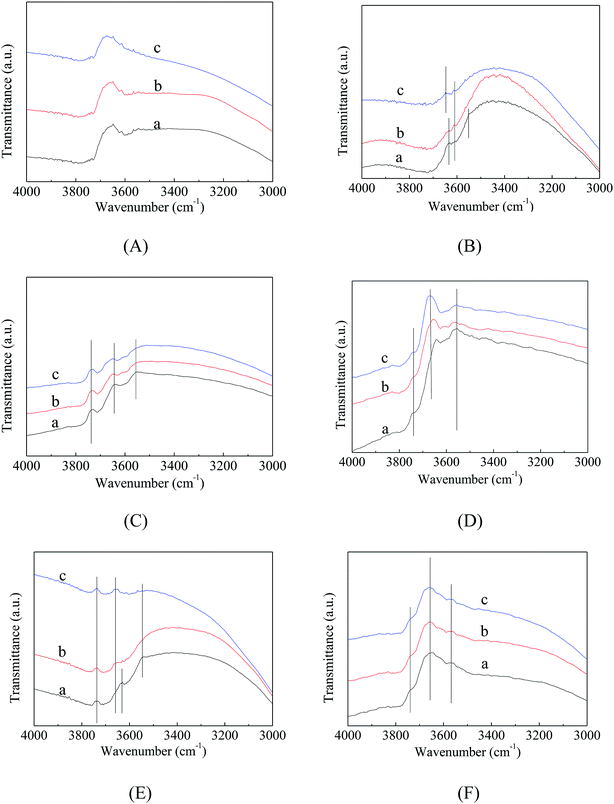 | ||
| Fig. 9 OH-IR spectra of VPO and MVPO catalysts with different processing temperatures. (A) VPO; (B) MoVPO; (C) WVPO; (D) CrVPO; (E) LaVPO; (F) CeVPO. (a) 100 °C; (b) 200 °C; (c) 350 °C. | ||
At the same time, the results also showed that the OH position on the catalyst surface significantly increased after the third component was added to the VPO catalyst. The hydroxyl peak of the catalyst was relatively stable when the temperature of VPO, WVPO, LaVPO, and CeVPO catalysts was increased from 200 °C to 350 °C. The previous determination of the pyridine infrared spectroscopy indicated that the B acid center is relatively stable because the B acid site is predominantly P–OH. The pyridine infrared results are consistent with the hydroxyl infrared results.
3.6 BET surface area analysis
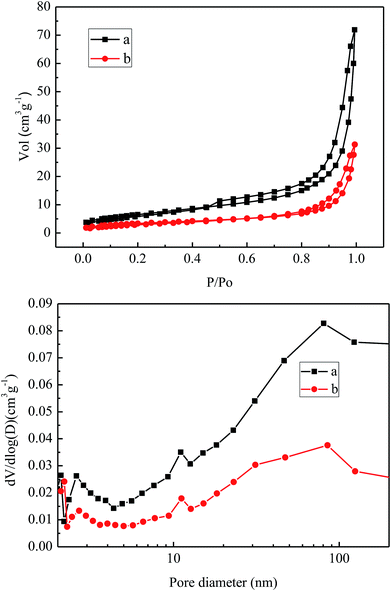
Fig. 10 shows the nitrogen adsorption and desorption isothermal curves of the VPO catalyst and LaVPO catalyst. It can be seen from the figure that the adsorption amount of a is larger. According to the literature, both are typical type IV isothermal adsorption desorption curves. The H2-type hysteresis loop, which occurs at P/Po of 0.8–0.98, consists of non-uniform nanoparticles arranged to form an “ink-bottle”-shaped hole with a wide distribution of holes. From Table 2, it can be seen that the introduction of La reduces the specific surface area of the catalyst and reduces the pore volume and the average pore size.38| Samples | BET surface area (m2 g−1) | Pore vol. (cm3 g−1) | Pore size (nm) |
|---|---|---|---|
| VPO | 21.61 | 0.0582 | 10.35 |
| LaVPO | 10.79 | 0.0277 | 9.94 |
3.7 SEM analysis
Fig. 11 shows the SEM micrographs of VPO and LaVPO catalysts. As shown in Fig. 11a and c, the VPO and LaVPO precursors exhibit a rose-like structure. The VPO catalyst after roasting in a muffle furnace showed a rose-like structure that changed to produce some particulate debris. However, the LaVPO catalyst after roasting in the muffle furnace maintained a rose-like structure. It is speculated that the introduction of La has a certain role in stabilizing the structure of the catalyst.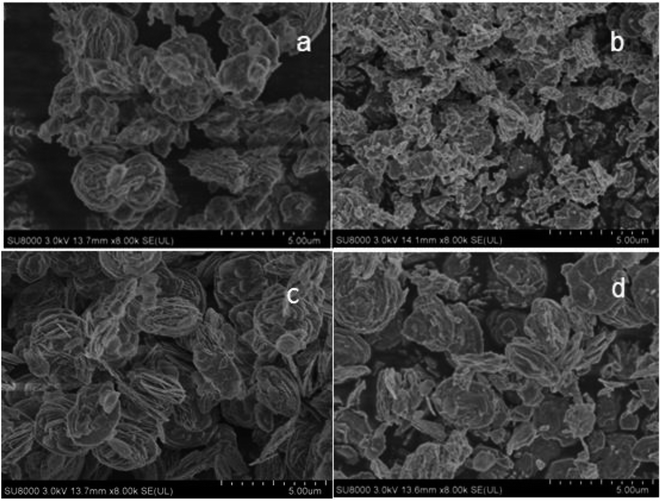 | ||
| Fig. 11 SEM photos of VPO and LaVPO catalysts. (a) VPO (precursor); (b) VPO; (c) LaVPO (precursor); (d) LaVPO. | ||
3.8 Catalytic performance evaluation
The catalytic performance of VPO and MVPO catalysts is presented in Table 3. The introduction of the third component into the VPO catalyst has a certain influence on the condensation reaction of formaldehyde and acetic acid. Compared to the observations for the VPO catalyst, the conversion of acetic acid and the selectivity of acrylic acid on the catalyst with the Cr component decreased significantly. The conversion of acetic acid on the MoVPO catalyst slightly increased, but the selectivity of acrylic acid decreased significantly. The selectivity of acrylic acid on the WVPO, LaVPO and CeVPO catalysts increased, and the LaVPO catalyst exhibited better selectivity of acrylic acid than the other catalysts.| Catalyst | Conv. of HAc (%) | Selec. of AA (%) | Yield of AA (%) |
|---|---|---|---|
| a The reaction conditions: amount of catalyst, 1 mL; calcination temperature, 550 °C; calcination atmosphere, muffle furnace; HAc/FA = 3.5/1; volume of feedstock, 1 mL h−1; the flow of N2, 20 mL min−1; the flow of O2, 3 mL min−1; space velocity, 2400 h−1; reaction temperature, 350 °C (HAc: acetic acid; AA: acrylic acid; FA: trioxymethylene). | |||
| VPO | 27.5 | 63.9 | 17.6 |
| MoVPO | 29.8 | 49.1 | 14.2 |
| WVPO | 27.0 | 72.9 | 19.7 |
| CrVPO | 12.6 | 57.5 | 7.2 |
| LaVPO | 22.4 | 76.6 | 17.2 |
| CeVPO | 28.9 | 70.5 | 20.4 |
Combining XRD results, we inferred that the crystal phases of VPO, CeVPO and WVPO catalysts belonged to the VOPO4·2H2O (JCPDS 36-1472) crystal phase. The crystal phase of the Cr-added catalyst belonged to the δ-VOPO4 (JCPDS 47-0951) crystal phase. The crystal phases of MoVPO and LaVPO catalysts belonged to the mixed crystal phase of δ-VOPO4 (JCPDS 47-0951) and VOPO4·2H2O (JCPDS 27-0949) crystal phases. It can be seen that the crystal structure changes after adding the third component, but the crystal phase structure does not have a clear relationship with the selectivity of the target product on the catalyst.
After combining the results of NH3-TPD and Py-IR, we could report the following conclusions. The VPO catalyst and the MoVPO, LaVPO, and CeVPO catalysts have weak acid, medium strong acid, and strong acid centers, while the WVPO and CrVPO catalysts have weak acid and medium strong acid centers. This shows that the introduction of different components has different effects on the acidity and the quantity of the VPO catalyst. The quantity of L acid in the LaVPO and WVPO catalysts decreased significantly, but the catalytic performance was better. It is speculated that B acid is the main active site of this reaction. The amounts of L acid and B acid in the MoVPO catalyst greatly increased, but the selectivity of the target product was poor, indicating that a moderate amount of acid is favorable for the reaction.
4 Conclusions
After adding the third component, the VPO catalyst exhibited a certain change in the crystal phase structure, but its crystal phase structure showed negligible relationship with the selectivity of the target product on the catalyst. The type of acid on the surface of the catalyst, the amount of acid, and the stability of the acid sites also changed. The conversion of acetic acid and the selectivity of acrylic acid also have different degrees of influence on the catalyst.When the La component was added to the catalyst, the selectivity of acrylic acid on the catalyst was the highest (76.6%). The LaVPO catalyst's crystal phase belonged to the mixed crystal phase of δ-VOPO4 (JCPDS 47-0951) and VOPO4·2H2O (JCPDS 27-0949) crystal phases. The specific surface area, pore volume, and average pore size of the catalysts were all reduced.
The acidity of the catalyst is a major factor affecting the catalytic performance of the catalyst. The quantity of L acid in the LaVPO and WVPO catalysts decreased significantly, but the catalytic performance was better. It is speculated that B acid is the main active site of this reaction. The amounts of L acid and B acid in the MoVPO catalyst greatly increased, but the selectivity of the target product was poor, indicating that a moderate amount of acid is favorable for the reaction.
Conflicts of interest
There are no conflicts to declare.Acknowledgements
This work was supported by Shanghai Huayi Acrylic Acid Co., Ltd.References
- Z. J. Zhang, Q. H. Wang, M. A. Jian-Xue and X. D. Chu, Guangzhou Chem. Ind., 2012, 40, 57–62 CAS.
- B. Z. Qian, Shanghai Chem. Ind., 2010, 35, 34–36 Search PubMed.
- X. Y. Guo, Y. Li, H. B. Liang, L. Liu and X. X. Liu, Mod. Chem. Ind., 2011, 31, 6–8 CAS.
- L. F. Cui and Z. Y. Hou, Chem. Ind., 2012, 30, 21–24 Search PubMed.
- Y. X. Lu, Fine Spec. Chem., 2014, 22, 1–6 Search PubMed.
- X. L. Liang, L. W. Zheng, X. Wang and W. B. Wang, Chem. Adhes., 2014, 36, 298–301 CAS.
- W. Qiu, Y. B. Wang and Z. H. Wei, J. Salt Chem. Ind., 2013, 42, 23–25 Search PubMed.
- X. M. Zhang and X. Zhou, Chin. J. Synth. Chem., 2012, 20, 399–402 Search PubMed.
- H. T. Neher, E. H. Specht and A. Neuman, Preparation of Acrylic Esters, US Pat., 2582911, 1952.
- X. X. Shi, H. S. Tian and Y. F. Zhu, Guangdong Chem. Ind., 2008, 35, 30–34 CAS.
- W. Reppe and R. Stadler, Process Producing Acrylate Acid, US Pat., 3023237, 1962.
- P. Zhang and Z. H. Wang, Evaluation and Comparison of Several Main Technological Processes for Production of Acid/Acrylic Ester Abroad and Some Superficial Views on Future Development of AA/AE in China (I), Chem. Ind. Press, 2003, vol. 8 Search PubMed.
- Z. Y. Xie, Shanghai Chem. Ind., 2006, 31, 40–44 Search PubMed.
- X. G. Yang, Z. T. Liu and J. Q. Zhang, Nat. Gas Chem. Ind., 1998, 23, 43–47 CAS.
- N. Nojiri, Y. Sakai and Y. Watanabe, Catal. Rev.: Sci. Eng., 1995, 37, 145–178 CrossRef CAS.
- A. Tenten, F. G. Martin and H. Hibst, Multimetal Oxide Masses, Eur. Pat., 668104(A1), 1995.
- R. A. Schneider, Synthesis of Acrylic Acid and Esters, US Pat., 4165438, Albany, Calif, 1979.
- R. A. Schneider, Catalyst for a n-Butane Oxidation to Maleic Anhydride, US Pat., 3864280, Berkeley, Calif, 1975.
- K. Katsumoto and D. M. Marquis, Method of Preparing Vanadium(IV) Phosphate Composition with High Intrinsic Surface Area, US Pat., 4132670, 1979.
- M. AI, J. Catal., 1987, 107, 201–208 CrossRef CAS.
- M. AI, J. Catal., 1988, 112, 194–200 CrossRef CAS.
- M. AI, J. Catal., 1987, 107, 201 CrossRef CAS.
- In Proc. 9th Intern Congress on Catalysis, ed, M. AI, Ottawa, 1988 Search PubMed.
- H. S. Horowitz, C. M. Blackstone, A. W. Sleight and G. Teufera, Appl. Catal., 1988, 38, 193–210 CrossRef CAS.
- L. M. Cornaglia, C. A. Sanchez and E. A. Lombardo, Appl. Catal., A, 1993, 95, 117–130 CrossRef CAS.
- M. AI, J. Catal., 1990, 124, 293–296 CrossRef CAS.
- J. Tai and R. J. Davis, Catal. Today, 2007, 11, 1–8 Search PubMed.
- Z. Q. Zhang and H. F. Wang, A Supported P, V, Cs, La Catalyst and Its Application, CN102652922, 2012.
- S. Herzog, S. Altwasser and K. J. Mueller-Engel, Process for Preparing Acrylic Acid from Methanol and Acetic Acid, US Pat., 2012/0071688(A1), 2012.
- D. Nagaki, T. Pan and C. J. Peterson, Catalyst for Producing Acrylic Acid and Acrylates, US Pat., 2013/0245312(A1), 2013.
- X. G. Kong, B. Hu and G. L. Zhuo, J. Mol. Catal., 2013, 27, 23–29 CAS.
- M. Turco, G. Bagnasco, C. Cammarano, P. Senese, U. Costantino and M. Sisani, Appl. Catal., B, 2007, 77, 46–57 CrossRef CAS.
- X. R. Chen and C. Y. Mou, J. Phys. Chem. C, 2007, 111, 18731–18737 CrossRef CAS.
- A. Jia, J. Li, Y. Zhang, Y. Song and S. Liu, Mater. Sci. Eng., C, 2008, 28, 1117–1226 CrossRef.
- L. F. Chen, L. E. Noreña, J. Navarrete and J. A. Wang, Mater. Chem. Phys., 2006, 97, 236–242 CrossRef CAS.
- B. Chakraborty and B. Viswanathan, Catal. Today, 1999, 48, 253–260 CrossRef.
- G. Centi, G. Golinelli and G. Busca, J. Phys. Chem., 1990, 94, 6813–6819 CrossRef CAS.
- K. S. W. Sing, Pure Appl. Chem., 1985, 57, 603–619 CAS.
| This journal is © The Royal Society of Chemistry 2019 |


