 Open Access Article
Applying rhamnolipid to enhance hydrolysis and acidogenesis of waste activated sludge: retarded methanogenic community evolution and methane production
Jiaqi Li ab,
Wenzong Liu
 *a,
Weiwei Caih,
Bo Wangade,
Fidelis Odedishemi Ajibade
 ab,
Zhaojing Zhangaf,
Xiadi Tiang and
Aijie Wang*ac
aKey Laboratory of Environmental Biotechnology, Research Centre for Eco-Environmental Sciences, Chinese Academy of Sciences, Beijing 100085, China. E-mail: wzliu@rcees.ac.cn; ajwang@rcees.ac.cn
bUniversity of Chinese Academy of Sciences, Beijing, 100049, China
cState Key Laboratory of Urban Water Resource and Environment, Harbin Institute of Technology (SKLUWRE, HIT), Harbin 150090, P. R. China
dSino-Danish College, University of Chinese Academy of Sciences, Beijing, 100049, China
eSino-Danish Centre for Education and Research, Beijing, 100190, China
fState Key Laboratory of Industrial Ecology and Environmental Engineering (Ministry of Education, China), School of Environmental Science and Technology, Dalian University of Technology, Dalian, 116024, China
gBeijing Drainage Group Co. Ltd (BDG), Beijing, China
hSchool of Civil Engineering, Beijing Jiaotong University, Beijing 100044, China
First published on 15th January 2019
Abstract
Recently, bio-surfactants, like rhamnolipid (RL), have been used as efficient pre-treatments to enhance the accumulation of short-chain fatty acids (SCFAs) from waste activated sludge (WAS). The current study found that SCFA accumulation occurred with evolutional variation in methanogen with RL (0.04 g RL g−1 TSS), resulting in a retarded methane production over a period of 20 days. However, a slow methane production was only detected before the 18th day, while the concentration of acetic acid (HAc) accumulated to a peak at 2616.94 ± 310.77 mg L−1 in the presence of RL, which was 2.58-fold higher than the control assay. During the retarded methane production, the concentration of dissolved hydrogen also increased to 49.27 ± 6.02 μmol L−1, in comparison with 22.45 μmol L−1 of control WAS without RL. According to the analysis of archaea communities induced by RL, hydrogenotrophic methanogens, like Methanobrevibacter, had been substantially promoted at the beginning of quick SCFA and hydrogen production, but their percentage decreased from 70% to 35% with time. Intrinsically, the growth of acetotrophic methanogens were postponed but they contributed most to the methane production in this research according to the correlation analysis.
Introduction
The utilization of activated sludge process for wastewater treatment around the world has produced enormous amounts of waste activated sludge (WAS).1 The disposal of sludge has become a problem of growing importance, representing a significant portion of the current operating costs of a wastewater treatment plants (WWTPs).2 Land application, landfill and incineration were the three main methods employed to deal with WAS in China, all of which impact negatively on the environment.3 However, WAS is chiefly composed of carbohydrate and protein,4,5 and could be usefully employed as a valuable resource of increasing economic benefits should it be properly treated. Today, anaerobic digestion of WAS is widely used for biological nutrient reutilization because of its characteristic low economic implication and environmental impacts.6,7Usually, there is a three-step process of WAS organics digestion namely hydrolysis, acidogenesis and methanogenesis.2 Hydrolysis is known to be the rate-limiting step during sludge anaerobic digestion when degrading complex organic material.3,8 If organic matter is not disintegrated properly, less than half of the total chemical oxygen demand (TCOD) or volatile solids would be biodegraded in a month.9,10 Therefore, the rate at which organic matters disintegrates can influence the growth and function of methanogenic archaea.11 Different kinds of pre-treatments have, to a great extent, been required to accelerate WAS disintegration and promote the activity of archaea.12 Pre-treatment methods have been proposed to enhance WAS solubilization,13 such as thermal,14,15 chemical,16–20 mechanical,21 ultrasonic,22 microbiological9,23–25 and combining methods.19,20,26–29 The pre-treatment methods employed to acclimatize fermentation and methane production towards recovering energy are better to be environmentally-friendly. Currently, bio-surfactants are used for WAS pre-treatment particularly to improve biodegradability.1,9,30 It has been reported by some researchers that the application of bio-surfactant is an efficient way to accumulate short chain fatty acids (SCFAs) as industrial products.31–35 Many research works have been implemented and proven positive with regard to solubilization of particulate organics and SCFAs accumulation,1,9,24 which could be attributed to the great reduction in surface tension of WAS.34 Kavitha et al.,20,28 Ushani et al.27 and Banu et al.26 have substantiated that the combination of surfactant with other pre-treatment methods performed favorably in anaerobic biodegradability. Zhou et al., Yi et al., Xu et al. and Huang et al. for example, investigated the effects of bio-surfactants like rhamnolipid (RL),9,34,35 surfactin,35 and saponin bio-surfactant (SB),1,33,35 on COD and SCFAs production from WAS fermentation. The results showed that bio-surfactant (RL with an optimum addition of 0.04 g g−1 TSS9) has positive effects on hydrolysis and acidogenesis, accompanied by methane inhibition in a short fermentation period, like 3–5 days.9 It was also documented that RL surfactants could enhance high abundance of acid-producing bacteria while chemosynthetic surfactants caused an evident reduction in bacterial diversity.24 Although bio-surfactant pre-treatment was confirmed to have positive influence on bacterial abundance related to hydrolysis and acidogenesis of WAS fermentation,1,9,36 methane production seems to be inhibited after bio-surfactant pre-treatment. Limited studies were made to understand methane inhibition by an environmentally-friendly system of pre-treatment and studies also of the evolution of major archaea communities in pre-treated WAS are rare.
As reported by Zhou,9 a low methane production of 2.0 mL CH4 g−1 VSS was notably detected, showing negative inhibition of methanogens compared to 58.8 mL CH4 g−1 VSS production during 96 h fermentation of raw WAS. Zhou et al.9 assumed that the promotion of cumulative SCFAs production by RL pre-treatment relate to a great degree with the inhibition of methanogen activity. However, the impacts on methanogenesis by bio-surfactant are still lacking. The purpose of this study is to illustrate the effects of RL pre-treatment on the anaerobic digestion of WAS, especially on the relationship between affected methanogen community structure and methane production. The RL pre-treatment accumulated SCFAs during WAS fermentation and therefore changed system conditions for subsequent methanogenesis. The evolution of key functional methanogens has to be response for the SCFAs accumulation, however, which is not well understood but important to evaluate bioresource recovery improvement of WAS degradation using bio-surfactant agents, like RL.
Materials and methods
Source of waste activated sludge
The WAS was collected from the secondary sedimentation tank of the Gaobeidian Water Reclamation Plant (Beijing Drainage Group Co, Ltd, Beijing City, China). The sludge was first filtered by screen of 1 mm in order to prevent clogging problems by the removal of impurities. It was then concentrated by settling it for 24 h and removing supernatant. Pre-treated WAS was directly used for anaerobic digestion. The main characteristics (average value plus standard deviation of three tests) of the concentrated WAS were displayed in Table 1.| Parameter | Value |
|---|---|
| pH | 6.86 ± 0.12 |
| TSS (total suspended solids) | 13.43 ± 0.39 g L−1 |
| VSS (volatile suspended solids) | 12.59 ± 0.31 g L−1 |
| TCOD | 11![[thin space (1/6-em)]](https://www.rsc.org/images/entities/char_2009.gif) 220 ± 121 mg L−1 220 ± 121 mg L−1 |
| SCOD | 228 ± 21 mg L−1 |
| Total SCFAs (as COD) | 130.49 ± 17 mg L−1 |
Bio-surfactant
Bio-surfactant treatment used 250 g L−1 RL solution (Victex Company, China) which was a mixture of RhaC10C10 (C26H48O9, m/z 503) and RhaRhaC10C10 (C32H58O13, m/z 649) in the experiments.4 serial dilutions of rhamnolipids in distilled water were made and the surface tension was determined by fully automatic surface tension meter (BQZY-1, Fangrui Inc.) with a Pt ring equipped under ambient temperature (28 °C). The method for surface tension determination is called the ring method. The amount of surfactant required to achieve the lowest possible surface tension is defined as the critical micelle concentration (CMC).37
Batch test
Laboratory-scale experiments on anaerobic digestion were conducted in 900 mL reactor bottles filled with 700 mL raw sludge each. 0.04 g RL g−1 TSS has been reported to be the optimum dosage based on the previous research9 and was applied to the sludge (pH 6.8–7.2) in this study. The control tests were carried out simultaneously without RL. By introducing nitrogen, the oxygen content of the system was expelled, and then all reactor bottles were capped, sealed, and stirred by magnetic stirrers (500 rpm) at 30 ± 1 °C for 72 days. Samples for basic analysis were taken from the reactors on a regular basis according to the duration time of anaerobic digestion.Analytical methods
Before the filtration of samples, some routine analyses of reactor bottles such as total suspended solids (TSS) and volatile suspended solids (VSS) were conducted according to the standard methods used by Zhou et al.9,24 The sludge pH was determined by a pH meter (FE 20, METTLER TOLEDO, Switzerland). Based on the studies conducted previously in our group, dissolved hydrogen concentrations of sludge samples were detected by a microsensor multimeter (model: pH-50-5343 Unisense Denmark) and the concentrations were detected as soon as the samples were taken out from the reactors. After the basic analytical experiments, all sludge samples used for other regular analyses were centrifuged at a speed of 8000 rpm, and were then filtered through a 0.22 μm membrane filter. The filtrate was immediately used to analyze COD, the rest of the filtrate was acidized by adding 5% H2SO4 and stored at 4 °C before SCFAs tests. 2 mL diluted filtrate was added into the COD reagent tube (20–1500 ppm, HACH, USA) heated for 2 h at 150 °C in a heater (DRB 200, HACH, USA). Absorbency was detected by spectrophotometer (DR 6000, HACH, USA). To analyze acetic acid, the acidized filtrate with a pH value less than 3 was obtained in a high-performance liquid chromatography (HPLC) vial with a volume of 1.5 mL. A HPLC (DGU 20A3R, Shimadzu, Japan) with an Animex column (300 mm × 7.8 mm, Aminex HPX-87H Ion Exclusion Column, USA) was used to quantify acetic acid. 0.5% H2SO4 (volume ratio) was the mobile phase with a flow rate of 0.6 mL min−1. The temperature of the detector was 60 °C and the injection volume was 50 μL. A gas chromatography (GC) (EWAI, 4000A) was employed to analyze the composition of gas and to calculate the sum of methane. Delin™ gas-sampling bags (500 mL) were used to collect biogas produced. The total volume of gas was measured by using a glass syringe.DNA extraction and microbial community analysis
All sediments left after centrifuged and supernatant removal were reserved at −20 °C. Subsequently, all bio-samples were collected to extract DNA for high-throughput sequencing. DNA was extracted with a FastDNA SPIN Kit for soil (MP). DNA quality and concentration were assessed based on absorbance ratio of 260/280 nm (∼1.9) detected by a NanoDrop Spectrophotometer (Nano 100, Aosheng Instrument Co Ltd.). Based on the V4 hypervariable region of archaea 16S rRNA gene, the following PCR primers were selected: 524F10extF (TGYCAGCCGCCGCGGTAA) and Arch985RmodR (YCCGGCGTTGAVTCCAATT). They have been frequently utilized in previous related studies and proven to be effective in some of our previously conducted studies.38,39 The original sequencing data were generated with a MiSeq sequencing machine in fastq format. The raw sequences are deposited in the NCBI Short Read Archive (SRA) database, under the accession number SRP136229.Statistical analysis
The correlation between microbial relative abundance and methane production rate was conducted in SPSS 22 using two-tailed Kendall's tau_b and Spearman correlation.40Results and discussion
SCFAs production improvement by RL in WAS fermentation process
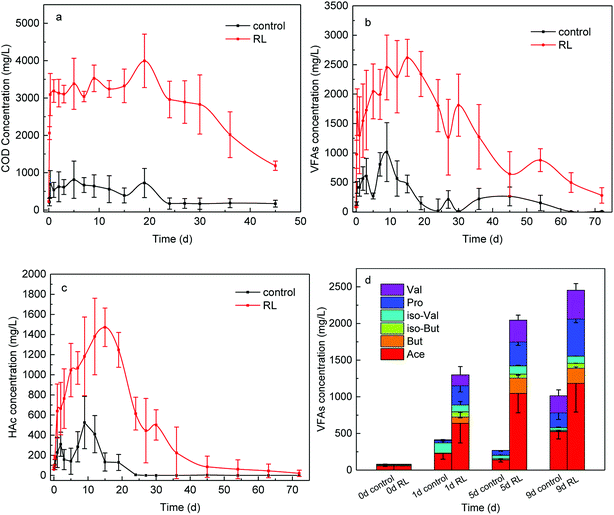
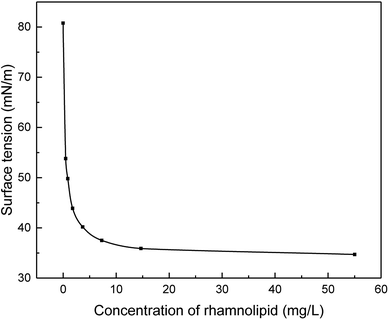
The hydrolysis process of WAS was improved by RL to a great extent with the soluble COD concentration promoted about 6 times (Fig. 1a), providing abundant substrates of acid-producing bacteria for SCFAs production. With more nutrients, acid-producing microbes are capable of producing more SCFAs. As a result, SCFAs accumulation from WAS fermentation was greatly enhanced (Fig. 1b), the yield with RL reached up to 2616.94 ± 310.77 mg L−1, while the maximum concentration was just 1013.94 mg L−1 in the control group. Acidogenesis was enhanced from WAS fermentation in the presence of RL, with maximum SCFAs concentration in experimental group having a trifold improvement and the duration time of acid production prolonged 1.7 times. Take acetic acid, for example, the concentration of HAc exceeded the control at the beginning of WAS fermentation and sharply increased to 1470 mg L−1 (Fig. 1c). The accumulation time of HAc was prolonged to 18 days in the presence of RL, while a much lower HAc concentration was below 500 mg L−1 and accumulation time to maximum level was shortened to the 9th day in WAS without RL pre-treatment. Acid-producing bacteria were able to work longer, indicating the acid-producing ability of those microbes was promoted by RL. And this could be attributed to the sufficient soluble carbon released by RL. The percentage of individual acid out of total SCFAs were analyzed in both reaction conditions (Fig. 1d), indicating that SCFAs increased notably with high acetate in components when RL existed. Acetic, propionic and valeric acids had a relatively larger increment than the control, which were beneficial for subsequent bioprocesses, such as biological nutrient removal and biogas. The initial SCFA concentration was in the following order: HAc (72.77%) > isovaleric acid (i-HVa) (13.35%) > valeric acid (HVa) (6.32%); it was HAc (49.51 ± 1.49%) > propionic acid (HPr) (18.84 ± 2.66%) > HVa (14.10 ± 2.31%) for the experimental group after 1 day.The possible reasons for enhanced acidogenesis under RL addition could be summarized. Firstly, WAS is able to be deflocculated by surfactant20 and the solubilization of substrates for acidogenesis is likely to be enhanced with the addition of surfactant. It has been proved that RL can solubilize hydrophobic compounds and effectively increase the solubility of organic compounds, which makes it easy for the cell to uptake.41 After solution preparation, RL was able to reduce the surface tension of distilled water from 81 to 35 mN m−1 with CMC at 14.7 mg RL L−1 by ring method (Fig. 2). Also, it can cause the cell surface to become more hydrophobic hence increasing the association of cell with the slightly soluble substrate.42 Secondly, RL is effective in increasing hydrolysis of WAS. The results of carbohydrates, proteins and lipids digestion are mainly HAc, HPr, butyric acid (HBu) and isobutyric acid (i-HBu) while higher-molecular-weight SCFAs such as HVa and i-HVa are associated with digestion of proteins.43 In this study, the growth of total SCFAs is a sound proof that the RL enhanced the hydrolysis. Finally, methane was not highly produced in acidogenesis period. With various RL additions, there was almost no methane production before the first 8 days,9 and little methane production means limited SCFAs consumption.
On the other hand, RL contributed to a higher proportion of HVa, which can be expected as more proteins were hydrolyzed and provided for acidogenesis. However, increased SCFAs production led to a lower pH which could impede the further SCFAs accumulation. He et al.30 combined the RL pre-treatment with the alkaline pre-treatment and found out that the combination of RL and alkaline performed better than sole RL pre-treatment and sole alkaline pre-treatment.
Hydrogen production of WAS with RL addition
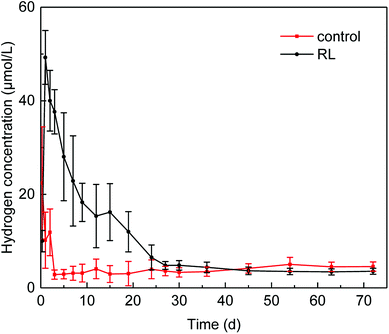
Hydrogen production occurred in acidogenesis process from complex organics to simple acids, and the presence of RL increased the dissolved hydrogen concentration (Fig. 3), which was 2.2-fold higher than that in control group without RL. Dissolved hydrogen concentration sharply increased in the first day of fermentation with the maximum of 49.27 ± 6.02 μmol L−1 and decreased to 4.83 ± 1.61 μmol L−1 in 20 days, and then it fluctuated in a very low level till 30 days afterward. In contrast, the maximum dissolved hydrogen concentration in the reactor without RL was 22.45 μmol L−1 at the beginning of the fermentation, and it decreased to 3.13 ± 0.25 μmol L−1 in 2 days. After the third day of fermentation, the dissolved hydrogen concentration of the control group was kept in a low concentration of 3.0 μmol L−1.The rise of dissolved hydrogen concentration in the presence of RL might be attributed to the enhanced organic disintegration. Higher solubilization of WAS organic matter occurred due to the addition of RL, leading to an elevated hydrolysis and acidogenesis, which can be of benefit to the hydrogen production from these processes.41,42 Enhancement of hydrogen production could lead to the change of microbial community evolution, especially methanogenesis archaea. A relatively higher reduction rate of hydrogen in the experimental group could be as a result of the boosts of hydrogenotrophic methanogenesis archaea community, which may influence the methane production.
Effects of RL on methane production
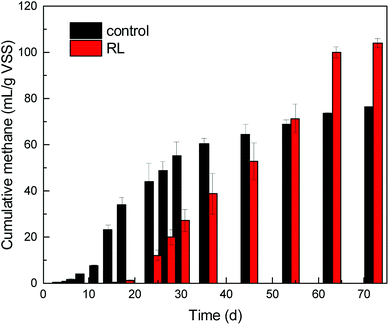
SCFAs and hydrogen, produced in the hydrolysis and acidogenesis from WAS fermentation, are the substrates for methanogenesis. However, in the first 45 days, methane production (64.31 mL g−1 VSS) of the group in the absence of RL from WAS fermentation was beyond that (52.86 mL g−1 VSS) of experimental group. Nevertheless, it was observed that cumulative methane volume of the experimental group eventually exceeded the control group without RL and eventually in the whole 72 days of fermentation (Fig. 4). The cumulative methane production was up to 104.15 mL g−1 VSS, but it was only 76.50 mL g−1 VSS in the control.Now that RL cannot be degraded by microorganisms efficiently as carbon source,9,37 the promoted acids generation may accompany high substrate loading, as well as increased protons, which may influence the growth of key community of methanogenesis archaea. It is obvious that methane started to accumulate notably from the 18th day of the fermentation in experimental reactor, when acetic acid began to decrease. Contrary to the control test, methane started to accumulate gradually from the beginning of fermentation. At the initial stage of WAS fermentation, the acid-forming bacteria were not impaired by RL pre-treatment.1 Thereafter, the concentration of SCFAs increased briskly in the experimental reactor, which could induce microbes acting on the next stage. In recent times, a series of research illustrated the function of archaea or interaction between bacteria and archaea for energy recovery in archaea-based wastewater treatment process and promoted WAS digestion.44 Archaea are one of the most important microorganisms functioning in post anaerobic digestion process, but little concern has been put on the impact of RL pre-treatment to post archaea growth when some pre-treatment methods are applied to WAS treatment.
Archaea community structure analysis
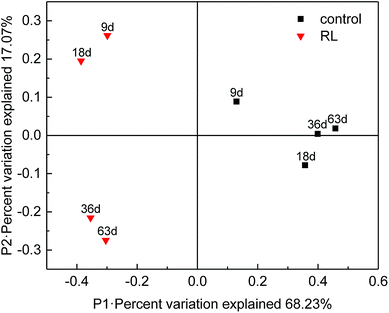
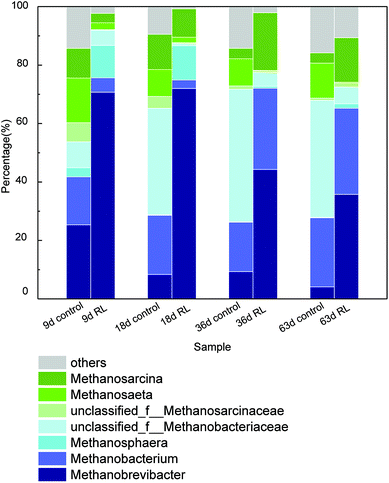
The structure and function of archaea community have been significantly affected in RL pre-treated WAS. Principal coordinates analysis (PCoA) showed that 85.3% of the total variance was explained by the first 2 coordinate axes (Fig. 5). Factor 1 explained 68.23% of the variation which correlated with the addition of RL, while factor 2 accounted for 17.07% of the variation. The PCoA analysis showed that RL addition substantially changed methanogenic communities in the initial stage (day 9 and 18) compared with the control system, whereas the communities significantly shifted (day 36 and 63) during the fermentation. It illustrated that the main contribution of methane production was based on the retardation of acetotrophic methanogen growth of original sludge by RL, but a final recovery of some methanogenic species occurred when sufficient substrates were accumulated. However, raw sludge without RL showed a relatively steady evolution process of acetotrophic methanogens.The identification of the archaea communities' phylogenetic diversity and relative abundance at the genus level as well as the statistical analysis in the two systems was investigated (Fig. 6). In overall, 24 genera were observed, while the relative abundance of the first 7 genera was above 85% in each sample, indicating that archaea communities mainly distributed in a few species. Methanobrevibacter, Methanobacterium, and Methanosphaera are the hydrogenotrophic methanogens. Methanosarcina and Methanosaeta are methanogens which utilize acetic acid, but Methanosarcina have a much higher threshold (0.2–1.2 mM) for acetate than Methanosaeta species (7–70 μM).45 It was detected that the dominant two genera were Methanobrevibacter and Methanobacterium in the control group on the 9th day. At the later stage of WAS fermentation, some portion of Methanobrevibacter decreased but an unclassified genus belonging to Methanobacteriaceae highly increased and became the predominant one, followed by Methanobacterium. However, in RL group, the predominant two genera were Methanobrevibacter and Methanosphaera on 9th and 18th day. Furthermore, though the percentage of Methanobrevibacter decreased but it was still the largest archaea community in the system. Methanobacterium increased spectacularly on 36th and 63rd day of the experimental group and became second predominant community of archaea in the system.
In the group without RL addition, the methane growth ratio was 6, 23, 3 and 1 mL d−1 in 9th, 18th, 36th and 63rd day respectively (Table 2), which is in accordance with the variation trend of the ratio of acetotrophic archaea. The methane production rate and the proportion of acetotrophic methanogens on 18th d happened to be the highest among the 4 control samples taken on the 9th, 18th, 36th and 63rd day, and similar phenomena can be observed in the experimental group. When RL exists, the methane production rates were 0 mL d−1 (9th d), 2 mL d−1 (18th d), 21 mL d−1 (36th d) and 8 mL d−1 (63rd d) (Table 2). The ratio of acetotrophic archaea, mainly Methanosarcina, in the experimental reactor increased dramatically in 36th day and 63rd day, with a boosted methane production rate as well.
| Time (d) | Methane production rate (mL d−1) | |
|---|---|---|
| Control | RL | |
| 2 | 1 | 0 |
| 4 | 1 | 0 |
| 6 | 3 | 0 |
| 7 | 5 | 0 |
| 9 | 6 | 0 |
| 12 | 8 | 0 |
| 15 | 18 | 0 |
| 18 | 23 | 2 |
| 24 | 14 | 6 |
| 27 | 8 | 7 |
| 30 | 7 | 15 |
| 36 | 3 | 21 |
| 45 | 2 | 12 |
| 54 | 2 | 12 |
| 63 | 1 | 8 |
| 72 | 1 | 1 |
It was vividly clear that the hydrogenotrophic archaea were the dominant in all the reactors which can be attributed to the increased hydrogen production. However, the final production of methane was mainly attributed to the contribution of acetotrophic methanogens.45,46 In addition, correlation analyses with methanogenesis rate, including Kendall and Spearman rank correlation, showed that Methanosarcina had a positive correlation with the methane producing rate significantly (Table 3), which can be another proof that methane production in this research was mainly driven by acetotrophic methanogens. However, boosting acids and hydrogen by RL pre-treatment had influenced the evolution of both acetotrophic and hydrogenotrophic methanogens greatly, resulting to a retarded methanogenesis process. The number of the genus Methanosarcina, which is known to use acetate as sole energy source and relates much to methane production,47 dropped at the beginning in RL pre-treated WAS. Moreover, the genus Methanobrevibacter, using hydrogen for methane production,48 were drastically increased, which may be ascribed to the elevated hydrogen production accumulated in the first two stages. The proportion of Methanosarcina was far less than that of the control group owing to the low pH caused by accumulated SCFAs. Methanosarcina prefer neutral pH,49,50 but the production of SCFAs was enhanced because of the RL pre-treatment, leading to an acidic environment which is not suitable for Methanosarcina to live. However, Methanosarcina could finally adapt to the situation in the reactors (Fig. 1b), leading to a relatively higher growth rate45,47 and methane producing rate.
| Kendall | Spearman | |||
|---|---|---|---|---|
| Control | RL | Control | RL | |
| Methanobrevibacter | 0.333 | −0.333 | 0.400 | −0.600 |
| Methanobacterium | −0.333 | 0.333 | −0.400 | 0.600 |
| Methanosaeta | −0.333 | −1.000* | −0.400 | −1.000** |
| Methanosarcina | 1.000* | 1.000* | 1.000** | 1.000** |
| Unclassified_f_Methanobacteriaceae | −0.333 | 0.000 | −0.600 | 0.000 |
| Methanospirillum | 0.000 | 0.333 | −0.200 | 0.600 |
| Unclassified_f_Methanosarcinaceae | 0.667 | 0.667 | 0.800 | 0.800 |
| Methanosphaera | 0.333 | −0.667 | 0.600 | −0.800 |
| Others | −0.667 | −0.333 | −0.800 | −0.400 |
Conclusions
The contribution of RL for the increased but postponed methane production from WAS fermentation was further understood in this study. The enhancement of hydrolysis and acidogenesis from WAS fermentation with RL was detected, and the upsurge in the production of hydrogen and HAc made an impact to methanogenesis. Correlation analyses of methane production rate showed that Methanosarcina had a positive correlation with the methanogenic rate significantly, which was postponed at the beginning of RL pre-treated WAS.Conflicts of interest
There are no conflicts to declare.Acknowledgements
This research was supported by Major Science and Technology Program for Water Pollution Control and Treatment (2017ZX07101-002-05-02), the National Natural Science Foundation of China (No. 51778607), and the Youth Innovation Promotion Association CAS (2017062).References
- A. Zhou, H. Luo, C. Varrone, Y. Wang, W. Liu, A. Wang and X. Yue, Process Biochem., 2015, 50, 1413–1421 CrossRef CAS.
- L. Appels, J. Baeyens, J. Degrève and R. Dewil, Prog. Energy Combust. Sci., 2008, 34, 755–781 CrossRef CAS.
- A. Bouskova, M. Dohanyos, J. E. Schmidt and I. Angelidaki, Water Res., 2005, 39, 1481–1488 CrossRef CAS PubMed.
- D. Banti, P. Samaras, A. Zouboulis and M. Mitrakas, Proceedings of 3rd International Workshop MBR for the Next Generation III, Istanbul, Turkey, September 17–18, 2013 Search PubMed.
- B. B. Wang, X. T. Liu, J. M. Chen, D. C. Peng and F. He, Water Res., 2018, 129, 133–142 CrossRef CAS PubMed.
- A. Kelessidis and A. S. Stasinakis, Waste Manage., 2012, 32, 1186–1195 CrossRef CAS PubMed.
- J. Hong, J. Hong, M. Otaki and O. Jolliet, Waste Manage., 2009, 29, 696–703 CrossRef CAS PubMed.
- F. Morgan-Sagastume, S. Pratt, A. Karlsson, D. Cirne, P. Lant and A. Werker, Bioresour. Technol., 2011, 102, 3089–3097 CrossRef CAS PubMed.
- A. Zhou, C. Yang, Z. Guo, Y. Hou, W. Liu and A. Wang, Biochem. Eng. J., 2013, 77, 240–245 CrossRef CAS.
- Q. Yang, K. Luo, X. M. Li, D. B. Wang, W. Zheng, G. M. Zeng and J. J. Liu, Bioresour. Technol., 2010, 101, 2924–2930 CrossRef CAS PubMed.
- A. M. Ziganshin, T. Schmidt, F. Scholwin, O. N. Il'inskaya, H. Harms and S. Kleinsteuber, Appl. Microbiol. Biotechnol., 2011, 89, 2039–2052 CrossRef CAS PubMed.
- C. Schiraldi, M. Giuliano and M. De Rosa, Archaea, 2002, 1, 75–86 CrossRef CAS PubMed.
- X. Liu, H. Liu, J. Chen, G. Du and J. Chen, Waste Manage., 2008, 28, 2614–2622 CrossRef CAS PubMed.
- C. Yang, W. Liu, Z. He, S. Thangavel, L. Wang, A. Zhou and A. Wang, Bioresour. Technol., 2015, 175, 509–516 CrossRef CAS PubMed.
- C. Adam, B. Peplinski, M. Michaelis, G. Kley and F. G. Simon, Waste Manage., 2009, 29, 1122–1128 CrossRef CAS PubMed.
- L. Wang, W. Liu, L. Kang, C. Yang, A. Zhou and A. Wang, Int. J. Hydrogen Energy, 2014, 39, 11913–11919 CrossRef CAS.
- G. C. Heng, M. H. Isa, J. W. Lim, Y. C. Ho and A. A. L. Zinatizadeh, Environ. Sci. Pollut. Res. Int., 2017, 24, 27113–27124 CrossRef PubMed.
- T. Wang, Y. Qin, Y. Cao, B. Han and J. Ren, Environ. Sci. Pollut. Res. Int., 2017, 24, 22371–22381 CrossRef CAS PubMed.
- W. Fang, P. Zhang, G. Zhang, S. Jin, D. Li, M. Zhang and X. Xu, Bioresour. Technol., 2014, 168, 167–172 CrossRef CAS PubMed.
- S. Kavitha, C. Jayashree, S. A. Kumar, I. T. Yeom and J. R. J. B. t. Banu, Bioresour. Technol., 2014, 168, 159–166 CrossRef CAS PubMed.
- K.-Y. Hwang, E.-B. Shin and H.-B. Choi, Water Sci. Technol., 1997, 36, 111–116 CrossRef CAS.
- H. Bao, L. Jiang, C. Chen, C. Yang, Z. He, Y. Feng, W. Cai, W. Liu and A. Wang, RSC Adv., 2015, 5, 48468–48473 RSC.
- Y. Chen, S. Jiang, H. Yuan, Q. Zhou and G. Gu, Water Res., 2007, 41, 683–689 CrossRef CAS PubMed.
- A. Zhou, W. Liu, C. Varrone, Y. Wang, A. Wang and X. Yue, Bioresour. Technol., 2015, 192, 835–840 CrossRef CAS PubMed.
- W. Fang, P. Zhang, X. Zhang, X. Zhu, J. B. van Lier and H. Spanjers, Energy, 2018, 162, 534–541 CrossRef CAS.
- J. R. Banu, R. Y. Kannah, S. Kavitha, M. Gunasekaran and G. J. B. t. Kumar, Bioresour. Technol., 2018, 267, 281–290 CrossRef PubMed.
- U. Ushani, J. R. Banu, K. Tamilarasan, S. Kavitha and I. T. J. B. t. Yeom, Bioresour. Technol., 2017, 241, 710–719 CrossRef CAS PubMed.
- S. Kavitha, S. S. Pray, K. Yogalakshmi, S. A. Kumar, I.-T. J. E. S. Yeom and P. Rajesh, Environ. Sci. Pollut. Res., 2016, 23, 2402–2414 CrossRef CAS PubMed.
- W. Fang, P. Zhang, R. Shang, J. Ye, Y. Wu, H. Zhang, J. Liu, X. Gou, G. Zeng and S. Zhou, Desalin. Water Treat., 2017, 62, 168–174 CrossRef CAS.
- Z.-W. He, C.-X. Yang, L. Wang, Z.-C. Guo, A.-J. Wang and W.-Z. Liu, Chem. Eng. J., 2016, 290, 125–135 CrossRef CAS.
- Y. Liu, J. Zhao, X. Li, D. Wang, Q. Yang and G. Zeng, Waste Manage., 2018, 78, 310–317 CrossRef CAS.
- X. Huang, T. Mu, C. Shen, L. Lu and J. Liu, Int. Biodeterior. Biodegrad., 2016, 114, 24–30 CrossRef CAS.
- Q. Xu, X. Liu, J. Zhao, D. Wang, Q. Wang, X. Li, Q. Yang and G. Zeng, Bioresour. Technol., 2018, 254, 194–202 CrossRef CAS PubMed.
- X. Yi, K. Luo, Q. Yang, X. M. Li, W. G. Deng, H. B. Cheng, Z. L. Wang and G. M. Zeng, Appl. Biochem. Biotechnol., 2013, 171, 1416–1428 CrossRef CAS PubMed.
- X. Huang, C. Shen, J. Liu and L. Lu, Chem. Eng. J., 2015, 264, 280–290 CrossRef CAS.
- A. Zhou, J. Zhang, W. Cai, R. Sun, G. Wang, W. Liu, A. Wang and X. Yue, Int. J. Hydrogen Energy, 2017, 42, 9044–9050 CrossRef CAS.
- Y. Zhang and R. M. Miller, Appl. Environ. Microbiol., 1992, 58, 3276–3282 CAS.
- B. Li, H. Chen, N. Li, Z. Wu, Z. Wen, S. Xie and Y. Liu, Sci. Total Environ., 2017, 605–606, 269–275 CrossRef CAS PubMed.
- Z. Yang, W. Wang, Y. He, R. Zhang and G. Liu, Renewable Energy, 2018, 125, 915–925 CrossRef CAS.
- Z. Zhang, Y. Qu, S. Li, K. Feng, S. Wang, W. Cai, Y. Liang, H. Li, M. Xu, H. Yin and Y. Deng, Sci. Rep., 2017, 7, 4837 CrossRef PubMed.
- R. A. Al-Tahhan, T. R. Sandrin, A. A. Bodour and R. M. Maier, Appl. Environ. Microbiol., 2000, 66, 3262–3268 CrossRef CAS PubMed.
- Y. Zhang and R. M. Miller, Appl. Environ. Microbiol., 1994, 60, 2101–2106 CAS.
- K. Luo, Q. Ye, X. Yi, Q. Yang, X. M. Li, H. B. Chen, X. Liu and G. M. Zeng, Appl. Microbiol. Biotechnol., 2013, 97, 5597–5604 CrossRef CAS PubMed.
- W. Cai, W. Liu, C. Yang, L. Wang, B. Liang, S. Thangavel, Z. Guo and A. Wang, ACS Sustainable Chem. Eng., 2016, 4, 4913–4921 CrossRef CAS.
- R. Conrad, FEMS Microbiol. Ecol., 1999, 28, 193–202 CrossRef CAS.
- C. Welte and U. Deppenmeier, Biochim. Biophys. Acta, 2014, 1837, 1130–1147 CrossRef CAS PubMed.
- M. S. Jetten, A. J. Stams and A. J. Zehnder, FEMS Microbiol. Lett., 1992, 88, 181–197 CrossRef CAS.
- A. Oren, in The Prokaryotes, Springer, 2014, pp. 165–193 Search PubMed.
- A. Oren, in The Prokaryotes, Springer, 2014, pp. 259–281 Search PubMed.
- S. Ni, C. R. Woese, H. C. Aldrich and D. R. Boone, Int. J. Syst. Evol. Microbiol., 1994, 44, 357–359 CAS.
| This journal is © The Royal Society of Chemistry 2019 |

