 Open Access Article
Hierarchical structured Mn2O3 nanomaterials with excellent electrochemical properties for lithium ion batteries†
Su Mengac,
Wenchao Yan*ab,
Xiaodi Maa,
Deye Suna,
Yongcheng Jin *a and
Kuang He*d
aCenter of Materials Science and Optoelectronics Engineering, University of Chinese Academy of Sciences, Beijing 100049, China. E-mail: jinyc@qibebt.ac.cn
bSchool of Materials Science & Engineering, Linyi University, Linyi 276000, China
cUniversity of Chinese Academy of Science, 19A Yuquanlu Road, Bejing 100049, P. R. China
dInstitute of Metal Research, Chinese Academy of Sciences, Wenhua Road 72, Shenhe District, Shenyang 110016, China
First published on 10th January 2019
Abstract
A series of Mn2O3 nanomaterials with hierarchical porous structures was synthesized using three types of leaves as templates. In addition to their different morphologies, different porous nanostructures were achieved by choosing different leaves. The Mn2O3 nanomaterial prepared by using gingko leaves as a template provides a larger pore volume and a higher Brunauer–Emmett–Teller (BET) surface area. At the same time, this material also displays excellent electrochemical performance, that is, the specific capacities are 1274.6 mA h g−1 after 300 cycles and 381.5 mA h g−1 at current densities of 300 and 3000 mA g−1, respectively.
Introduction
Rechargeable Li-ion batteries (LIBs) are one of the most promising power sources for portable devices, next-generation transportation devices, and electric vehicles due to their superior electrochemical performance, such as high energy density, environmental friendliness, and low cost.1,2 In the last few decades, extensive studies were focused on improving the electrochemical performance of LIBs, and searching for new electrode materials with unique nanostructures. For example, transition metal oxides have been extensively studied as anode materials. It was found that these materials have high theoretical capacity and excellent electrochemical performance, the reason is mainly attributed to their unique nanostructure.3 Among them, manganese oxide (MnO, Mn2O3, MnO2) has been studied because of its diverse structure, compositional flexibility, and novel physicochemical properties.3–5 Meanwhile, Mn2O3 is abundant, inexpensive, and environmentally benign, and it can provide a high energy density. Therefore, Mn2O3 is deemed to be a suitable next-generation anode material for LIBs.6To date, Mn2O3 as an anode material had been adopted in many studies; however, it also has many disadvantages, such as volume expansion and aggregation in the charge/discharge cycles, resulting in rapid capacity fading.7 As an efficient strategy for reducing the influence of volume expansion, preparing a material with a porous nanostructure is considered to be more beneficial than other methods.8–11 For example, Chen et al. synthesized and evaluated porous double-shelled Mn2O3 with hollow microspheres, they found that the Mn2O3 as an anode material provided a discharge capacity of 471 mA h g−1 at 3.2C rate after 100 cycles.12 Tang et al. reported the synthesis of porous Mn2O3 nanomaterials by controlling the volume ratio of ethylene glycol and water using the hydrothermal method. After optimization, the prepared Mn2O3 electrode with a porous architecture and thin thickness, it showed a stable capacity of 521 mA h g−1 after 100 cycles.13 Previous research results clearly showed that electrode materials with unique nanoscale pore structures can provide excellent electrochemical performance for Li-ion batteries, and these materials need unique synthesis method.
The template method is a simple and convenient route to synthesize porous nanomaterials. Nature offers us a wide variety of biomaterials, such as green plants, flowering plants, proteins, diatoms, and bacteria, all of these materials have different morphologies and porous structures.14–16 Among them, leaves showed outstanding light-harvesting efficiency owing to the three-dimensional (3D) architecture and porous framework of veins.17,18 These interesting nanostructures and characteristics have inspired many researchers to synthesize leaf-templated metal oxides, which have been applied as electrode materials and photocatalysts.17,19–23 For example, porous Co3O4 with a three-dimensional (3D) hierarchical structure showed higher sensing performance between glucose and H2O2 than Co3O4 prepared by using a classical method.19 Meanwhile, leaves are universal, inexpensive, reproducible, and widely accessible, which can be applied as abundant biotemplated materials.19
In this paper, Mn2O3 nanomaterials were successfully synthesized via a facile bio-templated method using three kinds of leaves as templates. The results showed that as-prepared materials reflected the porous nanostructure and characteristics of the original leaves. The detailed characterization and evaluation of the three kinds of Mn2O3 nanomaterials showed that the G-Mn2O3 material as anode material delivers a remarkable improved electrochemical performance.
Results and discussions
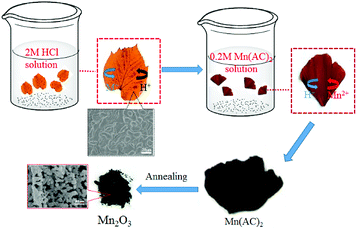
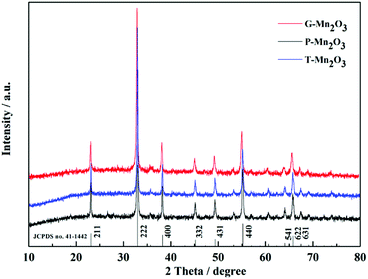
A simple synthesis strategy to obtain leaf-templated Mn2O3 materials is shown in Fig. 1. In order to remove impure elements of leaves, these leaves were pretreated with HCl solution. What we can see after this process is that the colour of Gingko leaves changed from yellow to brown, indicated that metal ions in the porphyrins were replaced by H+ ions. Then, the treated leaves were soaked in the manganese acetate solution (0.2 M) to absorb Mn2+ ions and then exchange Mn2+ ions for H+ ions, resulting in the formation of active sites of Mn(CH3COO)2 in the leaves. Lastly, according to the TG curves as shown in the Fig. S1,† the leaves were calcined at 600 °C to remove the original substances and obtain the target material Mn2O3.In order to analyze the phase composition of the prepared materials, the XRD patterns are shown in Fig. 2. Diffraction peaks matching with pure cubic phase of Mn2O3 (JCPDS no. 41-1442). The diffraction peaks matched well with the diffraction peaks at 2θ values of 23.1°, 32.9°, 38.2°, 45.2°, 49.3°, 55.2°, 64.1°, 65.8°, and 67.5°, which coincided with the (211), (222), (400), (332), (431), (440), (541), (622), and (631) crystal planes, respectively. No other impurity phase were detected in the spectrum.
The SEM images of different leaves and relative Mn2O3 materials are displayed in Fig. 3. Morphologies of Mn2O3 materials prepared by different templates, observing at low magnification, were very similar to those of the epidermis layers of leaves, as shown in Fig. 3. These indicated that the prepared Mn2O3 materials successfully maintained the morphology of their respective leaves templates. A deeper study of the microstructure of as-prepared Mn2O3 materials, all samples displayed a hierarchical structure, as shown in the SEM images (Fig. 4a, c and e). Compared to the prepared products, G-Mn2O3 and T-Mn2O3 materials with hierarchical structures were composed of some interconnected Mn2O3 nanoparticles about 30–100 nm in size (Fig. 4b and f), the P-Mn2O3 nanoparticles are rod-like shape and particle sizes are approximately 100–300 nm (Fig. 4d). In addition, G-Mn2O3 and P-Mn2O3 had porous framework structures, whereas T-Mn2O3 comprised tightly bound nanoparticles.
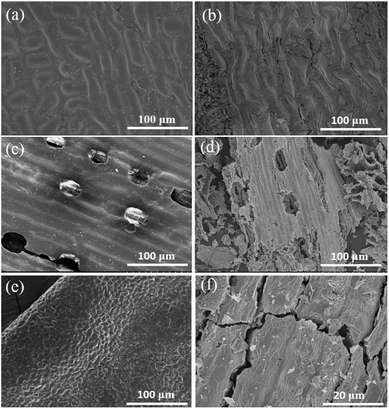 | ||
| Fig. 3 SEM images of the original gingko leaves (a), pine needles (c), tea leaves (e) and Mn2O3 prepared by gingko leaves (b), pine needles (d), tea leaves (f) templates. | ||
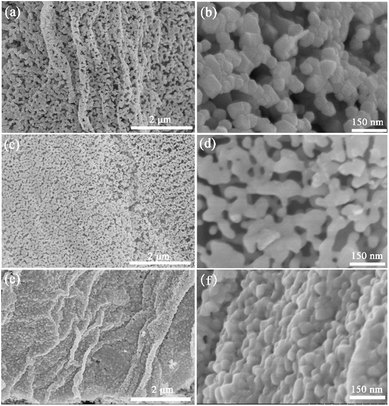 | ||
| Fig. 4 SEM images of Mn2O3 prepared by gingko leaves (a and b), pine needles (c and d) and tea leaves (e and f) template. | ||
As shown in Fig. S2,† the TEM images further illustrated detailed structures of prepared materials. TEM images of Mn2O3 materials showed hierarchical structures, where irregular shapes of nanoparticles were connected to each other to form a multilayer network structures. And these images also proved that the formation of porous structures with broad pore-size distributions. The HR-TEM images also showed well-ordered atomic columns, which indicate that the prepared materials had good crystal structures.
To further investigate the pore structures and inner architectures of as-prepared Mn2O3 materials, N2 adsorption–desorption cryosorption are used and relative results are shown in Fig. 5. All of the isotherms exhibited combined characteristics of types I/IV with distinct hysteresis loops, predicting a wide range of pore structures, which was proven by the pore-width distribution (Fig. 5b, d and f).24 In addition, the G-Mn2O3 material showed the highest BET surface area (59.445 m2 g−1) and largest pore volume (0.067 cm3 g−1) (as shown in Table 1). This larger pore volume and higher BET surface area allow better accessibility of the electrolyte, and it would be propitious to the transport of Li+ during the cycling process. The BET surface area of T-Mn2O3 higher than that of P-Mn2O3, but the SEM image showed that the latter had a more abundant pore structure. These contradictory results mainly due to the T-Mn2O3 material had smaller particles, which formed a raised surface between particles and then achieved higher specific surface area.
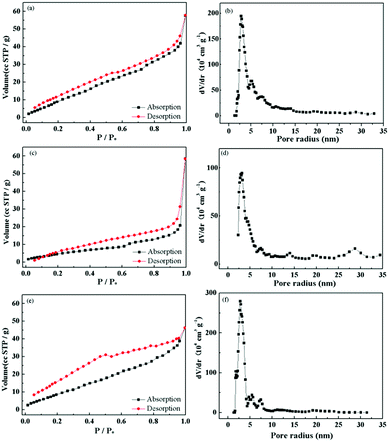 | ||
| Fig. 5 N2 adsorption–desorption isotherms of G-Mn2O3 (a), P-Mn2O3 (c) and T-Mn2O3 (e) and the inserted pore size distributions of G-Mn2O3 (b), P-Mn2O3 (d) and T-Mn2O3 (f). | ||
| Materials | SBET (m2 g−1) | Pore vol. (cm3 g−1) | Pore size (nm) |
|---|---|---|---|
| G-Mn2O3 | 59.445 | 0.067 | 2.769 |
| P-Mn2O3 | 21.701 | 0.045 | 3.169 |
| T-Mn2O3 | 45.696 | 0.059 | 2.769 |
Fig. 6a–c shows the typical discharge–charge profiles of G-Mn2O3, P-Mn2O3, and T-Mn2O3 at a rate of 0.3C. In the first discharge profile, the voltage dropped from 3.0 V to 0.25 V, which was mainly due to the reduction from Mn2O3 to MnO (Fig. S3a and b†). By degrees then the potential decreased to 0.01 V, which corresponds to the formation of metal Mn and phase transformation reaction with amorphous Li2O formed (Fig. S3c†).6,25 The theoretical value of Mn2O3 is 1018 mA h g−1, however, the first discharge capacity is 1215.7 mA h g−1, the improved capacity may be attributed to the decomposition of the electrolyte and a gel-like film formed on the surface of materials.26,27 As shown in Fig. 6d, the discharge capacities of as-prepared Mn2O3 electrodes showed rapid decrease before 25 cycles, the reason due to irreversible structure transformation and/or side reaction at electrode and electrolyte interface.6,27 After 25 cycles, the as-prepared materials presented an upward trend at a rate of 0.3C, which ascribed to the slow activation of internal pore structure during cycling, this phenomenon often observes in transition metal oxides.28–30 However, the discharge capacity of P-Mn2O3 electrode decreases after 150 cycles, which caused by the poor crystallinity, the result is consistent with SEM and TEM images.
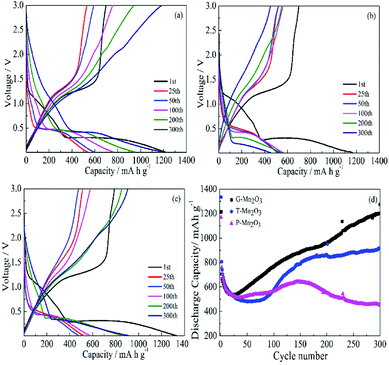 | ||
| Fig. 6 Typical discharge–charge profiles of G-Mn2O3 (a), P-Mn2O3 (b) and T-Mn2O3 (c) and (d) cycling performance of G-Mn2O3, P-Mn2O3 and T-Mn2O3 at a current density of 0.3 A g−1. | ||
Fig. 7a shows representative charge–discharge profiles of the three prepared samples at various current densities. Remarkably, the charge–discharge potential of G-Mn2O3 has a longer plateau, indicating a longer Li ion diffusion path even at high rates. Fig. 7b exhibits the rate capabilities of G-Mn2O3, P-Mn2O3, and T-Mn2O3 materials at various current densities. With increasing the current densities, the internal polarization of the battery is increased and the interface features also had effect on the discharge capacity. The G-Mn2O3 showed the best electrochemical performance, even at the rate of 3C, the specific capacity can reach 381.5 mA h g−1. The reason may be ascribed to the G-Mn2O3 electrode has higher surface area and larger pore volume, which led to an increased effective electrode/electrolyte interface area, thus increasing the rate of Li+ transport. At the same time, this material has smaller particles with abundant porosity, which not only reduces the diffusion distance of lithium ions but also serves as a electrolyte reservoir to ensure Li+ diffusion at high rates, resulting in superior rate performance.
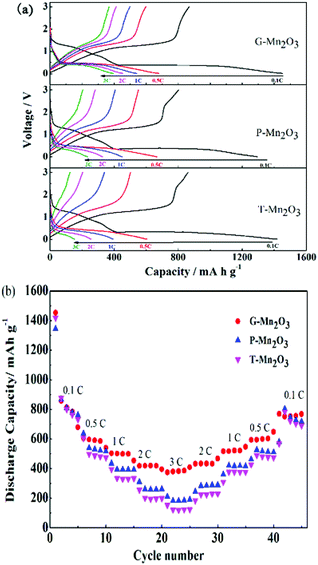 | ||
| Fig. 7 Typical discharge–charge profiles (a) and (b) rate performance of G-Mn2O3, P-Mn2O3 and T-Mn2O3 at different current densities. | ||
For comparison, non-templated Mn(CH3COO)2 was also heated in air at 600 °C for 3 h to obtain powder Mn2O3 with larger nanoparticles (Fig. S4†). Its electrochemical performance is not as good as that of G-Mn2O3 anode material, which was synthesized by the leaf-templated method. The discharge capacity was 427.6 mA h g−1 after 100 cycle at 0.3C and 220.7 mA h g−1 at rate of 3C (Fig. S5†). The obvious difference demonstrated leaf-templated method can keep the morphology of the leaf and control the growth of primary particles. The electrochemical properties of Mn2O3 anode material in this work and published literature are compared in Table S1,† the results showed that the material prepared in this work have superior properties.
In order to study the interface characteristics of G-Mn2O3, the EIS tests were also applied. Fig. 8 shows the Nyquist plot of G-Mn2O3 at the discharge state (0.01 V) after cycling at 0.3C in the 1st, 100th, 200th, and 300th cycles, the related parameters as shown in Table S2.† All curves of G-Mn2O3 electrode showed a semicircle and a straight line, which are corresponding to high and low frequency regions. The diameter of the semicircle represents the charge transfer resistance (Rct). Upon cycling, the charge-transfer resistance decreased gradually, which could partially explain the observed capacity increasing on cycling.31,32
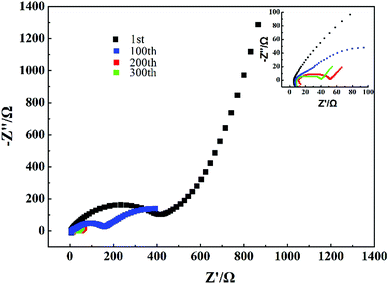 | ||
| Fig. 8 Nyquist plots of G-Mn2O3 were performed after cycling at 0.3C in the 1st, 100th, 200th and 300th. | ||
In addition, the diameter of the semicircle obtained in the Nyquist plot for the G-Mn2O3 electrode was clearly smaller than that of the other electrodes when measured at a discharge potential of 0.01 V in the 300th cycle, as shown in Fig. S6.† This low impedance of G-Mn2O3 electrode owing to large surface area and abundant porous structure, which shortened the Li+ diffusion distance and enhanced the reaction kinetics, resulted in superior rate capability and cycle performance.33
Conclusions
Mn2O3 materials with porous hierarchical structure were synthesized via a facile leaf-templated method and calcination process. The obtained Mn2O3 materials with different morphologies were studied as anode materials for LIBs. Among as-prepared Mn2O3 materials, the G-Mn2O3 exhibited better cycling retention and higher discharge capacity of 1274.6 mA h g−1 at 0.3C after 300 cycles. The G-Mn2O3 electrode also showed the best rate performance: a specific discharge capacity of 381.5 mA h g−1 at 3C. We believe that porous hierarchical structure with a large surface area and abundant pore structure may provide more active sites, which shortened the Li+ diffusion distance and decreased interfacial contact resistance, resulting in superior electrochemical properties.Experimental
Materials synthesis
Gingko leaves, pine needles, and tea leaves were immersed with a 2 M hydrochloric acid solution for 24 h. Then the leaves were washed for several times and subsequently dried at 80 °C for 5 h. The leaves (0.5 g) were then immersed in a Mn(CH3COO)2 solution (0.2 M, 50 mL) with stirring for 24 h at 25 °C. After being filtered and then dried at 100 °C, the leaves were calcined at 600 °C for 3 h in air and cooled naturally to 25 °C. The prepared powders using gingko leaves, pine needles, and tea leaves as templates were labelled as G-Mn2O3, P-Mn2O3, and T-Mn2O3, respectively. For comparison, Mn2O3 nanoparticles was synthesized at the same starting materials by non-templated method.Structure characterization
The Bruker AXS D8 X-ray diffractometer with Cu Kα radiation was used to study the crystal structure of Mn2O3 materials. The morphology and nanostructure of Mn2O3 materials were evaluated by Hitachi S-4800 field emission scanning electron microscope (FE-SEM) and transmission electron microscopy (TEM). In order to evaluate the pore structure and surface areas of Mn2O3 materials, nitrogen adsorption–desorption isotherms at 77 K via the Brunauer–Emmett–Teller (BET) method.Electrochemical evaluation
Mixed anode electrodes with copper foil as current collector were mixed using the prepared materials as the active material, conductive carbon (super-P), and polyvinylidene fluoride (PVDF) binder (60![[thin space (1/6-em)]](https://www.rsc.org/images/entities/char_2009.gif) :
:![[thin space (1/6-em)]](https://www.rsc.org/images/entities/char_2009.gif) 30
30![[thin space (1/6-em)]](https://www.rsc.org/images/entities/char_2009.gif) :
:![[thin space (1/6-em)]](https://www.rsc.org/images/entities/char_2009.gif) 10 wt%) in N-methyl-2-pyrrolidone (NMP). The average areal density of Mn2O3 electrodes is 1.8 mg cm−2 for each cell. Li metal as counter electrode, Celgard 2500 as separator, and 1 M LiPF6 dissolved in mixture of EC/DEC/DMC (1
10 wt%) in N-methyl-2-pyrrolidone (NMP). The average areal density of Mn2O3 electrodes is 1.8 mg cm−2 for each cell. Li metal as counter electrode, Celgard 2500 as separator, and 1 M LiPF6 dissolved in mixture of EC/DEC/DMC (1![[thin space (1/6-em)]](https://www.rsc.org/images/entities/char_2009.gif) :
:![[thin space (1/6-em)]](https://www.rsc.org/images/entities/char_2009.gif) 1
1![[thin space (1/6-em)]](https://www.rsc.org/images/entities/char_2009.gif) :
:![[thin space (1/6-em)]](https://www.rsc.org/images/entities/char_2009.gif) 1 vol%) as the electrolyte.
1 vol%) as the electrolyte.
The LAND-2010 automatic battery tester was used to evaluate the electrochemical performance at different current densities from 0.1C to 3C (1C = 1000 mA g−1) between 0.01–3.0 V. The cyclic voltammograms (CV) were carried on a CHI660E electrochemical workstation at the scan rate of 0.2 mV s−1 in the voltage range of 0.01 to 3.0 V. Electrochemical impedance spectroscopy (EIS) was studied by an electrochemical station (CHI 660) in the frequency between 100 kHz and 0.1 Hz with 5 mV amplitude.
Conflicts of interest
There are no conflicts to declare.Acknowledgements
The authors appreciate the financial support of “YZ201641” and “ZR2017BEM044”.Notes and references
- P. G. Bruce, B. Scrosati and J. M. Tarascon, Angew. Chem., Int. Ed., 2008, 47, 2930–2946 CrossRef CAS PubMed
.
- G. Ceder, Y. M. Chiang, D. R. Sadoway, M. K. Aydinol, Y. I. Jang and B. Huang, Nature, 1998, 392, 694–696 CrossRef CAS
.
- Y. Dai, H. Jiang, Y. Hu and C. Li, RSC Adv., 2013, 3, 19778–19781 RSC
.
- Y. J. Zhang, Y. Yan, X. Y. Wang, G. Li, D. R. Deng, L. Jiang, C. Y. Shu and C. R. Wang, Chem. - Eur. J., 2014, 20, 6126–6130 CrossRef CAS PubMed
.
- M. W. Xu, Y. B. Niu, S. J. Bao and C. M. Li, J. Mater. Chem. A, 2014, 2, 3749 RSC
.
- Y. Qiu, G. L. Xu, K. Yan, H. Sun, J. Xiao, S. Yang, S. G. Sun, L. Jin and H. Deng, J. Mater. Chem., 2011, 21, 6346–6353 RSC
.
- C. X. Guo, M. Wang, T. Chen, X. W. Lou and C. M. Li, Adv. Energy Mater., 2011, 1, 736–741 CrossRef CAS
.
- Y. C. Zhang, J. T. Li, Z. G. Wu, L. Huang and S. G. Sun, J. Alloys Compd., 2017, 721, 229–235 CrossRef CAS
.
- J. Xu, Y. Sun, M. Lu, L. Wang, J. Zhang, J. Qian and E. J. Kim, J. Alloys Compd., 2017, 717, 108–115 CrossRef CAS
.
- P. Wu, D. Wang, J. Ning, J. Zhang, X. Feng, J. Dong and Y. Hao, J. Alloys Compd., 2018, 731, 1063–1068 CrossRef CAS
.
- M. Pudukudy, Z. Yaakob and R. Rajendran, Mater. Lett., 2014, 136, 85–89 CrossRef CAS
.
- Y. Qiao, Y. Yu, Y. Jin, Y. B. Guan and C. H. Chen, Electrochim. Acta, 2014, 132, 323–331 CrossRef CAS
.
- X. Zhang, Y. T. Qian, Y. C. Zhu and K. B. Tang, Nanoscale, 2014, 6, 1725–1731 RSC
.
- E. Katz and I. Willner, Angew. Chem., Int. Ed., 2004, 43, 6042–6108 CrossRef CAS PubMed
.
- L. Berti and G. A. Burley, Nat. Nanotechnol., 2008, 3, 81–87 CrossRef CAS PubMed
.
- S. Sotiropoulou, Y. S. Sastre, S. S. Mark and C. A. Batt, Chem. Mater., 2008, 20, 821–834 CrossRef CAS
.
- H. Zhou, X. Li, T. Fan, F. E. Osterloh, J. Ding, E. M. Sabio, D. Zhang and Q. Guo, Adv. Mater., 2010, 22, 951–956 CrossRef CAS PubMed
.
- E. Shimoni, O. R. Hon, I. Ohad, V. Brumfeld and Z. Reich, Plant Cell, 2005, 17, 2580–2586 CrossRef CAS PubMed
.
- L. Han, D. P. Yang and A. Liu, Biosens. Bioelectron., 2015, 63, 145–152 CrossRef CAS PubMed
.
- X. Li, T. Fan, H. Zhou, S. K. Chow, W. Zhang, D. Zhang, Q. Guo and H. Ogawa, Adv. Funct. Mater., 2009, 19, 45–56 CrossRef CAS
.
- Z. Schnepp, W. Yang, M. Antonietti and C. Giordano, Angew. Chem., Int. Ed., 2010, 122, 6714–6716 CrossRef
.
- S. Zhu, D. Zhang, Z. Chen, G. Zhou, H. Jiang and J. Li, J. Nanopart. Res., 2010, 12, 2445–2456 CrossRef CAS
.
- X. Li, T. Fan, Z. Liu, J. Ding, Q. Guo and D. Zhang, J. Eur. Ceram. Soc., 2006, 26, 3657–3664 CrossRef CAS
.
- C. Zhao, C. Yu, M. Zhang, J. Yang, S. Liu, M. Li, X. Han, Y. Dong and J. Qiu, J. Mater. Chem. A, 2015, 3, 21842–21848 RSC
.
- Y. Deng, Z. Li, Z. Shi, H. Xu, F. Peng and G. Chen, RSC Adv., 2012, 2, 4645–4647 RSC
.
- Y. Ren, A. R. Armstrong, F. Jiao and P. G. Bruce, J. Am. Chem. Soc., 2010, 132, 996–1004 CrossRef CAS PubMed
.
- L. Zhou, H. B. Wu, T. Zhu and X. W. Lou, J. Mater. Chem., 2012, 22, 827–829 RSC
.
- R. Liu, S. Zhao, M. Zhang, F. Feng and Q. Shen, Chem. Commun., 2015, 51, 5728 RSC
.
- K. Li, F. Shua, X. Guo and D. Xue, CrystEngComm, 2015, 17, 5094–5100 RSC
.
- H. B. Lin, H. B. Rong, W. Z. Huang, Y. H. Liao, L. D. Xing, M. Q. Xu, X. P. Li and W. S. Li, J. Mater. Chem. A, 2014, 2, 14189 RSC
.
- W. Duan, W. Yan, X. Yan, H. Munakata, Y. Jin and K. Kanamura, J. Power Sources, 2015, 293, 706–711 CrossRef CAS
.
- D. Li, X. Li, X. Hou, X. Sun, B. Liu and D. He, Chem. Commun., 2014, 50, 9361–9364 RSC
.
- X. Xu, R. Cao, S. Jeong and J. Cho, Nano Lett., 2012, 12, 4988–4991 CrossRef CAS PubMed
.
Footnote |
| † Electronic supplementary information (ESI) available. See DOI: 10.1039/c8ra08985j |
| This journal is © The Royal Society of Chemistry 2019 |

