DOI:
10.1039/C8RA08871C
(Paper)
RSC Adv., 2019,
9, 7922-7931
Petroleum hydrocarbon release behavior study in oil-sediment aggregates: turbulence intensity and chemical dispersion effect†
Received
25th October 2018
, Accepted 19th February 2019
First published on 11th March 2019
Abstract
This study investigated the effects of turbulence and oil dispersants on release of petroleum hydrocarbons in oil-sediment aggregates. A kinetic study showed that the static oil release process could be fitted to the first-order kinetics model. The oil concentration increased with increasing temperature and salinity, while remaining independent of pH. The dispersant desorption ability of petroleum hydrocarbons followed the sequence of: Tween 80 > Tween 85 > Span 80 > DOSS. In the presence of turbulence, the maximum release ratio was 40.28%. However, the combination of dispersants and turbulence had a smaller effect than turbulence alone. Furthermore, residual n-alkanes and PAHs in the sediments were analyzed. The results showed higher proportions of C15–C35 and 2–3 ring PAHs in residual oil. These results can help assess the fate and distribution of oil spills in marine environments.
1. Introduction
Due to recent human activities, such as the extraction, storage and transportation of petroleum, more and more oil is being released into marine ecosystems. The Deepwater Horizon blowout released more than 4 million barrels of crude oil into the Gulf of Mexico1 and the Exxon Valdez spilled over 250 thousand barrels of crude oil into Alaskan waters.2 Crude oil contains aliphatic and aromatic hydrocarbons, heavy metals, polar compounds, and volatile organic compounds.3 Even today, continued cases of oil leakages have brought great harm to aquatic ecosystems and caused huge economic losses.
Various methods have been implemented to treat oil spills, such as mechanical skimming, use of chemical dispersants and physical cleanup of shorelines.4,5 Dispersants have been used extensively for mitigating oil spill impacts since the 1950s6 and have become the primary measure to deal with the impacts of marine oil spills. Nearly 8 million liters of dispersants were applied to the marine surface in the Deepwater Horizon oil spill.7 Dispersants can decrease the interfacial tension and accelerate the movement of oil from the marine surface. Oil dispersants are comprised of a mixture of solvents and anionic, nonionic surfactants.8 Corexit 9500A and Corexit 9527A are often used in large-scale cleanup of oil spills at sea.9 Frequently-used compounds include a mixture of sorbitan monooleate (Span 80) and ethoxylated sorbitan monooleate (Tween 80), as well as anionic surfactants Dioctyl Sulfosuccinate (DOSS).10,11 Corexit 9500A contains the same ingredients as Corexit 9527A, but does not contain 2-butoxy ethanol.
However, the extensive use of dispersants to remove oil spills poses a number of problems. It can make the dispersed oil droplets interact with the sediment particles in the water column, including organic matter or clay minerals, forming oil-suspended particulate material (SPM) aggregates (OSA) or oil-mineral aggregates (OMA).12,13 Oil droplets in seawater undergo a variety of weathering processes, including: dissolution of selected monoaromatics and PAHs, microbial degradation, interactions with SPM, and eventually sedimentation. Surface oil can be driven by winds and currents to end up stranded on shorelines where longer-term impacts can occur.14 A significant amount of crude oil remained at 8–20 cm below the surface of the sediment about 40 years after the Bay Jimmy accident.15,16 However, it is noteworthy that the distribution of oil in natural sediments may be released back into seawater, as demonstrated in laboratory simulation experiments.17,18 However, environmental factors such as sediment load, salinity and temperature play an important role in this release process. In addition, it is very important that oil droplets interact with SPM or minerals in a turbulent aqueous environment,19 as Kenneth Lee demonstrated that water turbulence greatly enhances OMA formation.20 High-energy mixing helps to break oil into droplets, suspend sediment particles, and enhance the collision between oil droplets and sediments.21 Therefore, turbulence is a key and indispensable factor in the study of marine oil spills. There is currently a gap in our understanding of how turbulence and dispersant interactions will affect the oil release process over time.
Many studies have focused on the effects of oil properties, sediment size, salinity, temperature and other parameters on oil-sedimentary interactions.22,23 Some researchers24 built hydrodynamic models to calculate the transformation and migration of oil contaminants into the water-sediment system. The oil release onto sediments under the presence of biosurfactants and chemical dispersants has been studied with batch experiments.25–27 Many studies have suggested that turbulent energy, type of mineral and what dispersant used could have an impact on the amount of oil incorporated during the mineral phase.28,29 Turbulent energy is required to disperse oil and mineral particles, and some researchers30 have demonstrated that turbulent mixing promotes PAHs desorption due to disruption of sediment particle aggregates. However, these studies incompletely evaluate the process of oil release in a seawater-sediment system. Little is known about oil under the presence of dispersants. In addition, detailed information on how turbulence affects oil release and how these factors alter the transportation and fate of persistent oil components in the marine environment need further exploration.
The overall goal of this study is to measure the interactions between oil, sediments, dispersants and turbulence. Specifically, the manuscript aims to: (i) schematically examine the kinetics of petroleum hydrocarbon release from sediments in a static environment, (ii) investigate the effects of environmental factors, four dispersants (Tween 80, Tween 85, Span 80 and DOSS) and turbulence on oil release process, and (iii) characterize oil components in seawater and on suspended and settled sediments by GC-MS. Quantifying turbulence and dispersant effects on the oil release can help develop guidelines for the treatment of oil spills and can improve risk assessments for environments where there is possibility of oil leakages.
2. Materials and methods
2.1. Chemicals and materials
2.1.1 Crude oil sample. The crude oil sample was obtained from Shengli Oilfield (Dongying, China). The properties of the crude oil were as follows: viscosity of 22.5 mPa s (determined at 50 °C in 50 rpm), condensation point of 23 °C and density of 0.8552 g cm−3 at 20 °C. The saturates, aromatics, resins and asphaltenes components of the crude oil are shown in Table S1 (in ESI†). The components of n-alkanes and PAHs of the test crude oil are shown in Fig. S1 and Table S2.†
2.1.2 Seawater and sediments sample. The natural seawater (pH 7.2, salinity 3.4 wt% and density 1.01 g cm−3) and sediments were collected from the Qingdao Shilaoren bathing beach (the coordinates of the site are 36°05′34.61′′N and 120°28′13.40′′E). The natural seawater samples were filtered through a membrane (0.45 μm, polyamide) and then sterilized by autoclave (ZealWay instrument INC, DE, USA) at 120 °C. The aim of the pretreatment process was to remove microorganisms and suspended solids. After that, the sediments (the main component is silt and sand) were sterilized, air-dried, and passed through a 70-mesh sieve.
2.1.3 Chemical reagents. Petroleum ether and Tween 80 were purchased from Sinopharm Chemical Reagent Co., Ltd, China. Hexane and dichloromethane were obtained from Merck Chemicals Co., Ltd, Germany. Tween 85, Span 80 and DOSS were purchased from Shanghai Macklin Biochemical Co., Ltd, China. All the dispersants were used as received upon proper dilution.
2.2. The contaminated samples
Contaminated samples was prepared according to the procedure described by Yuan research group.17 In brief, first, mixtures of 100 g of the pretreated sediments and 1, 2 and 3 g crude oil dissolved in petroleum ether were combined. Second, the oil/sediments/solvent were mixed thoroughly with a stirrer (200 rpm) at 25 °C until the solvent evaporated completely to form a contaminated sample. Finally, the contaminated samples were aged in the dark at room temperature for 96 hours.
2.3. Effects of environmental factors
The effects of environmental factors on the release of the oil was assessed at various solution temperatures, salinities and pH. Seawater is weakly alkaline due to the hydrolysis of weak acidic anions. Although seawater has a natural buffering capacity, factors such as large-scale carbon dioxide dissolution in the ocean, which changes the pH.31 Based on this, the pH of the seawater was adjusted using 1 M HCl and NaOH solution from the initial 7.2 to the final values of 6.0, 7.0 and 8.0. The salinity effects were tested at various salinity levels (2 wt%, 3 wt%, and 4 wt%). The reaction temperatures used were 15, 25, and 35 °C. Design Expert software was used to obtain the regression and graphical analysis of the experimental data.
2.4. Effects of turbulence and dispersants
The ratio of dispersants to crude oil was 1![[thin space (1/6-em)]](https://www.rsc.org/images/entities/char_2009.gif) :
:![[thin space (1/6-em)]](https://www.rsc.org/images/entities/char_2009.gif) 20 (v/v) for the tests. This ratio is often a target for dispersant effectiveness testing. The solutions used for releasing petroleum hydrocarbons in the contaminated samples were as follows: seawater used as a control; Tween 80, Tween 85, Span 80 and DOSS used as surfactant. The experiments of turbulence were carried out on an oscillator (IS-RDS3, Crystal Technology & Industries, Inc, TX, USA) and the rotating speed was set at 60, 90 and 120 rpm. This rotating speed was used to simulate the different energy mixing conditions in marine environments.21 In this case, simulation of these interactions in laboratory experiments was possible because the turbulence in the flask was similar to those found in marine environments.32,33 To simulate the marine environment as much as possible, environmental factors had a salinity of 3.4 wt%, pH 7.2, and temperature of 15 ± 2 °C. We acknowledged that there was a certain gap between the laboratory environment and a real-world oil spill. However, understanding these factors is crucial to extrapolating the results from idealized laboratory experiments.
20 (v/v) for the tests. This ratio is often a target for dispersant effectiveness testing. The solutions used for releasing petroleum hydrocarbons in the contaminated samples were as follows: seawater used as a control; Tween 80, Tween 85, Span 80 and DOSS used as surfactant. The experiments of turbulence were carried out on an oscillator (IS-RDS3, Crystal Technology & Industries, Inc, TX, USA) and the rotating speed was set at 60, 90 and 120 rpm. This rotating speed was used to simulate the different energy mixing conditions in marine environments.21 In this case, simulation of these interactions in laboratory experiments was possible because the turbulence in the flask was similar to those found in marine environments.32,33 To simulate the marine environment as much as possible, environmental factors had a salinity of 3.4 wt%, pH 7.2, and temperature of 15 ± 2 °C. We acknowledged that there was a certain gap between the laboratory environment and a real-world oil spill. However, understanding these factors is crucial to extrapolating the results from idealized laboratory experiments.
2.5. Oil release experiment
The 2 g contaminated samples (contamination levels of 9.46, 18.21 and 29.12 mg g−1) and 40 mL seawater were placed at the bottom of 250 mL baffled Erlenmeyer flasks. In the effect factor test, these parameters were adjusted with the contamination level setting at 18.21 mg g−1 20 mL seawater samples were taken from the baffled Erlenmeyer flask and sampling depth was just below the seawater surface. All the contaminated samples were taken from the baffled Erlenmeyer flask. The baffled Erlenmeyer flask was sampled at times: 3, 6, 12, 24, 48, 72 and 96 hours. All seawater samples and contaminated samples were immediately stored at 4 °C. For petroleum hydrocarbon in seawaters, all samples were extracted by n-hexane and the absorbance measured. For contaminated samples, all samples were extracted by n-hexane and stored immediately at 4 °C in order to calculate the release ratio. For the determination of n-alkanes, PAHs and biomarkers in contaminated samples, a 20 μL n-alkane internal standard, 20 μL sterane and terpane internal standard and 20 μL PAHs internal standard was added to a 940 μL sample solution for analysis.
2.6. Analysis
The oil concentration was determined by ultraviolet spectrophotometry (Alpha-1860s, China) at 225 nm.23 The positive correlation between the oil concentration and its absorbance was shown in Fig. S2.† The zeta potential were measured by using a Zeta Nanosizer instrument (Malvern Istruments, UK). The sediment and contaminant samples were imaged by optical microscopy (Leica DM1000 LED, Leica, Germany). Fluorescent images were obtained by a confocal laser scanning microscope (CLSM, Fluo View FV1000, Olympus Corporation, Japan). Petroleum hydrocarbon components in the extracts were analyzed using GC-FID (Agilent 7890A Series GC System, USA) and GC-MS (Shimadzu Kyoto, Japan). Parameters of GC-FID and GC-MS analysis are given in ESI.†
3. Results and discussion
3.1. Static release experiments
Prior to crude oil release experiments using dispersants, the process of static release (without dispersants and turbulence) at different contamination levels was studied. The release kinetics curve are shown in Fig. 1. The rate of release was rapid at the beginning and gradually decreased with increasing contact time until equilibrium was attained. This result indicated that petroleum hydrocarbons could easily be released into seawater. In this stage, petroleum hydrocarbons desorbed mainly from low energy binding sites on the particle surface. The maximum concentration of petroleum hydrocarbons in the different seawater contamination levels reached 8.60, 9.62 and 13.71 mg L−1. Three widely used kinetic models, first-order, Elovich and second-order kinetic models, were employed to explain the kinetics results. The formulas are as follows:| |
Qt = a + b![[thin space (1/6-em)]](https://www.rsc.org/images/entities/char_2009.gif) ln ln![[thin space (1/6-em)]](https://www.rsc.org/images/entities/char_2009.gif) t t
| (1) |
| |
 | (3) |
where Qt (mg g−1) is the amount of release from the sediment at time t (h), Qd (mg g−1) is the equilibrium concentration level and a or b is a model parameter. Respectively, k1 and k2 are the release rate constants.
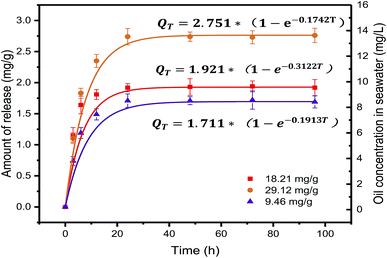 |
| | Fig. 1 The petroleum hydrocarbon concentration in seawater and first-order kinetic model fitting curves at the different contamination levels. | |
The parameters obtained using the three kinetic model fitting methods are given in Table 1. The first-order kinetic model correlation coefficient was high regression (R2 > 0.9980), and the calculated Qd value was in good agreement with the experimental value. This suggests that the first-order kinetic model was appropriate to represent kinetics data. Results showed that the higher the level of contamination, the greater the concentration of petroleum hydrocarbons in seawater. Our results demonstrate that the oil adsorbed onto contaminated sediment would not be released completely. The kinetic modeling revealed that the rate-limiting step in the oil release process was desorption in agreement with previous studies.17 Additionally, these results also looks at the pollution intensity and rate by which the secondary pollution of the overlying water column occurs under different contamination levels. This results can be used to assess the effects of static release of petroleum hydrocarbons on the seawater quality.
Table 1 Kinetic fits to the oil release equation of different contamination level
| Contamination level (mg g−1) |
Elovich kinetic model |
First-order kinetic model |
Second-order kinetic model |
| a, mg g−1 |
b, mg g−1 |
R2 |
k1, h−1 |
Qd, mg g−1 |
R2 |
k2, g (mg h)−1 |
Qd, mg g−1 |
R2 |
| 9.46 |
0.69 |
0.26 |
0.8091 |
0.19 |
1.71 |
0.9981 |
0.16 |
1.84 |
0.9840 |
| 18.21 |
1.19 |
0.19 |
0.7392 |
0.31 |
1.92 |
0.9984 |
0.28 |
2.02 |
0.9904 |
| 29.12 |
0.97 |
0.45 |
0.8323 |
0.17 |
2.75 |
0.9987 |
1.32 |
2.33 |
0.6025 |
3.2. The static release ratio between petroleum hydrocarbons in sediment
Petroleum hydrocarbons undergo complex behaviors in seawater, such as emulsification, volatilization and dissolution.34 The release process is highly complicated. By exploring changes of the release ratio, the loss of petroleum hydrocarbons by weathering in the release processes can be further calculated. The oil release percentage φ is given by formula (4).| |
 | (4) |
where φ (%) is the release ratio from the sediment at time t and C0 (mg g−1) is the initial oil concentration. Ct (mg g−1) is the oil concentration in sediment at time t.
Fig. 2 shows the release ratio as a function of time at different contamination levels. The petroleum hydrocarbon release ratio in the initial stage grew rapidly, which led to a rapid increase in the concentration of petroleum hydrocarbons in the seawater. This can be easily explained because the driving force for release was much higher with a larger initial oil concentration. However, the release ratio at later stages (the 24 –96 hours range) only presented a slow increase. One main reason was that the petroleum hydrocarbons in seawater had reached an interim saturation level. The release ratio proved highest at the lowest initial oil loading, and then lower with the middle initial oil concentration loading. This was attributed to greater relative loss at the lowest initial oil loading. In addition, the interaction of oil, seawater and sediment reached a dynamic equilibrium, and a stable thermodynamic system was gradually formed. The theoretical value of petroleum hydrocarbon concentration calculated from the release ratio was greater than the experimental value. The loss of oil concentration was showed in Fig. 2 (inset picture of Fig. 2). This means that during the release process, most of the petroleum hydrocarbons enter the water body and the rest evaporates into the atmosphere.
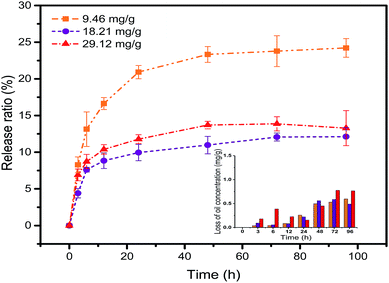 |
| | Fig. 2 The petroleum hydrocarbon release ratio in the different contamination levels. | |
3.3. Temperature, salinity and pH effects
The influence of temperature, salinity and pH on the release of oil from the sediment is shown in Fig. 3. In general, the effect of environmental factors on oil release followed the sequence of: temperature > salinity > pH (Fig. 3 and S9†). The oil and sediment in seawater were influenced by a series of interaction forces, such as double-layer repulsion, steric interaction and van der Waals attraction. The effect was more significant when the temperature increased from 15 to 35 °C. The release of petroleum hydrocarbons from sediment into seawater was closely related to temperature.27 An increase in temperature would promote disruption between the oil molecule and the surface of the sediment particle. At higher temperatures, the oil viscosity would also be slightly lower and enhance the shearing effect introduced by turbulence. It is also possible that at higher temperatures the solubilities of individual PAHs are increased. For salinity, results revealed that the sediment desorbed more petroleum hydrocarbons with lower salinity, indicating that salinity has a destructive effect on the release process. However, based on the Derjaguin–Landau–Verwey–Overbeek theory, higher salinity compressed the diffuse double layer, causing a decrease in the repulsive electrostatic double-layer forces and promotes intimate contact between oil molecules and sediments.35 In addition, the solubility of petroleum hydrocarbons decreased with increasing ionic strength, which inhibited the release of petroleum hydrocarbons. For pH, the data suggests that the equilibrium oil concentration was not influenced significantly by the pH. These results are useful for better understanding the fate of petroleum hydrocarbons in contaminated sediments under different environmental conditions.
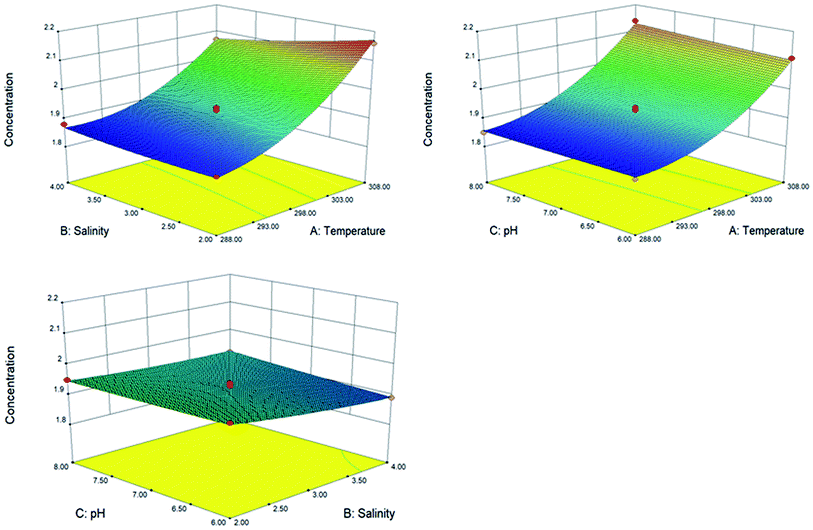 |
| | Fig. 3 Effect of temperature, salinity and pH on the release of petroleum hydrocarbon. | |
3.4. Effects of dispersants on release of petroleum hydrocarbons in sediment
Fig. 4a shows the petroleum hydrocarbon concentration in the absence or presence of four dispersants. In all cases, faster release was observed in the first 6 hours, then became slightly lower in the 6–24 hour range, and finally reached a plateau. Fig. 4b shows the release ratio of petroleum hydrocarbons from the contaminated sediment. The amount of desorbed oil in seawater followed the sequence of: Tween 80 > Span 80 > Tween 85 > DOSS > no dispersant. The results revealed that dispersants could promote the release of oil from the sediment, on which the nonionic dispersants had a greater role than the ionic dispersants. The dispersant could break the oil slick into smaller droplets by reducing the interfacial tension, thereby lowering the interfacial adsorption of oil making it more soluble in seawater, and increased tendency for release of oil-containing particles, including colloids, from sediments. The final concentrations of desorbed petroleum hydrocarbons increased by 10.15 mg L−1 and 4.65 mg L−1 for Tween 80 and Tween 85. However, Span 80 and DOSS were less effective, which only increased by 4.36 mg L−1 and 2.99 mg L−1, respectively. Tween 80's effective effects was attributed to three hydrophilic oxyethylene chains extending into the water and single-tailed packing closely in the oil phase. DOSS is a water-soluble anionic surfactant which has rapid and transient features compared to the other three nonionic surfactants. In addition, sorption of DOSS was not favored due to electrostatic repulsion between the anionic head groups and the negatively charged sediment surface. Also, it is typically important to avoid the formation of stable water-in-oil emulsions during an oil spill response. Combined with our results, DOSS proved more suitable for mixing with three nonionic dispersants, such as Corexit-EC9527A.
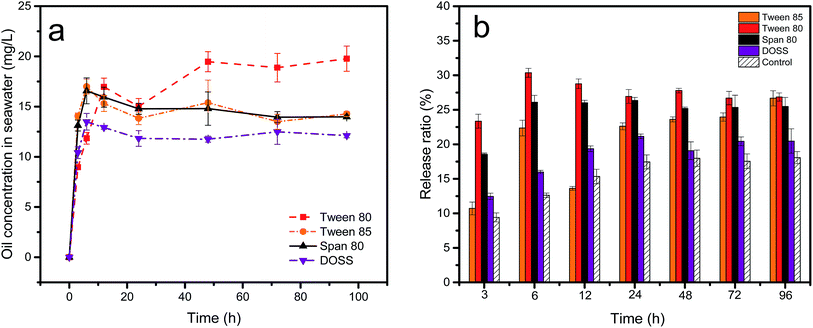 |
| | Fig. 4 Effect of dispersants on petroleum hydrocarbon concentration (a) and release ratio (b) at the 18.21 mg g−1 contamination levels. Dispersant: Tween 80, Tween 85, Span 80 and DOSS. | |
3.5. Effects of turbulence on release of petroleum hydrocarbons in sediment
Fig. 5a shows the effect of different turbulence levels on the release of petroleum hydrocarbons. At the beginning, the seawater continually scoured the sediment and the soluble petroleum hydrocarbons spread to the sediment, where they were partially adsorbed onto the sediment and some amount was transferred into the seawater. Then, the release of oil gradually slowed down and achieved dynamic equilibrium. The oil concentration in the water column increased sharply from 16.01 to 28.80 mg L−1 when the turbulence increased from 60 to 120 rpm, which demonstrated that higher turbulent energy could improve the interaction between oil and minerals. This was consistent with the experiment results reported by Ma et al.36 Fig. 5b shows the change of release ratio. As turbulence levels increased, more petroleum components appeared in the seawater phase. Compared with Fig. 4b, the release ratio at 60 rpm was almost the same as only adding dispersant. However, when the turbulence was increased to 120 rpm, the effect of turbulence on the release ratio greatly exceeded the dispersant. This means that physicochemical factors could easily lead to release of petroleum hydrocarbons. Fig. S3† shows a gas chromatogram of the seawater extracts of oil in different turbulence conditions. This chart showed multiple peaks exist in the presence of turbulence. There was a growing concentration of saturated hydrocarbons in the aqueous extract when the mixture was stirred vigorously. The data suggests that the change of petroleum hydrocarbon concentration was due to the hydrodynamic disturbance generated by mechanical forces that increased the mixing power of the entire reaction system. The mixing power led to breaking up of aggregates and physical stripping or tearing of oil droplets from sediment particles. In addition, in the case of intense turbulence, the dynamic equilibrium between different particle aggregates was broken and the interparticle petroleum hydrocarbons were released again. Microscopic results confirmed the presence of oil droplets and suspended OMA in seawater (Fig. 7), which also proved our speculation.
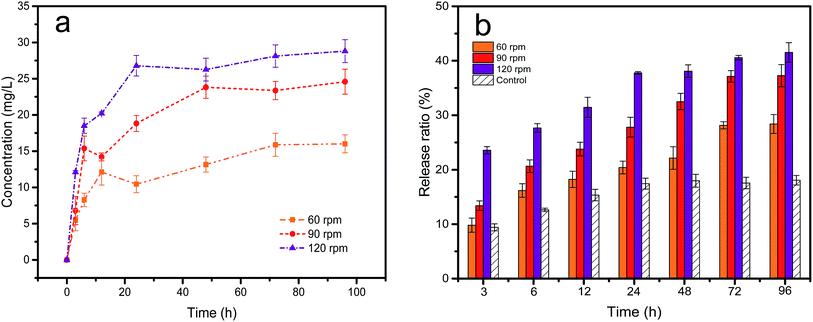 |
| | Fig. 5 Effect of turbulence on petroleum hydrocarbon concentration (a) and release ratio (b) at the 60, 90, 120 rpm in 18.21 mg g−1 contamination levels. | |
3.6. Effect of turbulence and dispersants on the release of petroleum hydrocarbons in sediment
The use of chemical dispersants is still controversial, as the effectiveness of dispersants on different oils in different environmental conditions has not been completely resolved. Dispersant effectiveness is usually affected by several factors, including the nature of the crude oil, turbulence, temperature and salinity. At present, many studies have been reported about the effects of salinity and temperature on the performance of dispersants.37,38 However, there has rarely been any research for the release performance of dispersant under different turbulence levels. The loss of kinetic energy occurs due to turbulent shears and laminar flow within seawater. The shear is directly proportional to velocity gradients, which plays a crucial role in the mixing of oil and dispersants.
Turbulence was selected to be 120 rpm because this speed was most similar to real-world marine environments.39,40 Also, at this turbulence level the release effect was higher than that of all dispersants, which helped to better explore the interaction between dispersants and turbulence. As showed in Fig. 6a, for cases where dispersants coexist with turbulence, with increasing reaction time the concentrations of the petroleum hydrocarbons all increased at first and then decreased. All interactions between the four dispersants and turbulence on the release ratio were summarized in Fig. 6b–e. In the early stage of release, the addition of Tween 80 and Tween 85 significantly promoted release of petroleum hydrocarbons, and the dispersant played a synergistic role with turbulence. However, with increasing reaction time, the release ratio declined sharply compared to the only turbulence condition. The results showed that the addition of these two dispersants is less than ideal for oil release in turbulent conditions. However, turbulence is inherent to marine environments, and is a driving force in increasing the encounter rates between oil droplets, dispersants and sediment.39 This illustrates that the combined effect of both dispersants and turbulence made oil more likely to form aggregates with suspended minerals. As showed in Fig. 7, after the addition of the dispersant, we could clearly see that the shape of the oil droplets was more irregular, and more mineral was adsorbed around the oil droplets. Adsorption of more mineral increased the gravity of the oil droplets, which were then repositioned in the system. Zhang et al.29 investigated the interactions between dispersants and turbulence on sizes of OMA, and the results suggested that the chemically dispersed oil droplets were more stable than physically dispersed oil droplets. The zeta potential is a key indicator for the stability of dispersion systems. Fig. S4† showed the zeta potential under various experimental conditions. The zeta potentials of oil droplets, sediments and oil/sediments in seawater were −7.1, −22.3 and −41.7 mV, respectively. The lower potential values of oil droplets and particles indicated that they tended to form higher zeta potential aggregates, because the higher the zeta potential, the more stable the system. These aggregates could then re-settle into sediments due to the change in gravity. Therefore, we believe that large fluctuations of oil concentrations in seawater is caused by re-suspension and re-sedimentation of oil and sediment.
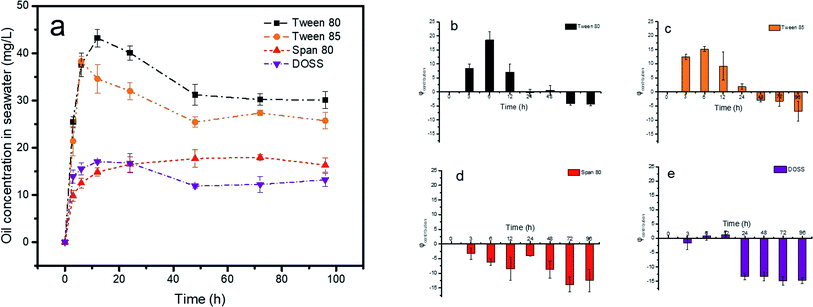 |
| | Fig. 6 Effect of dispersants and turbulence on petroleum hydrocarbon concentration (a) and the contribution amount (φcontribution) of Tween 80 on release ratio (b), Tween 85 (c), Span 80 (d) and DOSS (e) in the presence of turbulence at 120 rpm in 18.21 mg g−1 contamination levels. | |
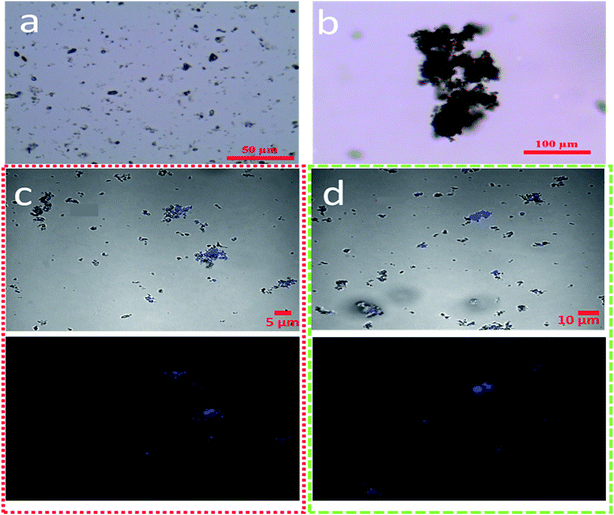 |
| | Fig. 7 Images of sediment and OMA in the bottom and middle portion of the baffled flask imaged by optical microscopy and CLSM, (gray: mineral particles; blue: oil droplets): suspended sediment (a), contaminated sediment morphology (b), suspension OMA, with Tween 80, 120 rpm (c) and suspension OMA, no dispersant, 120 rpm (d). | |
3.7. Residual petroleum hydrocarbon components in sediment
The concentrations and components (n-alkanes and PAHs) of residual oil in the sediment were determined. Duan et al.41 reported that the concentration of petroleum hydrocarbons in the sediment after 5 years was determined to be 2.310 mg g−1. However, the concentration of total petroleum hydrocarbons in the sediment after only 1.5 years from the same area reached up to 77 mg g−1.15 This indicated a strong resistance of residual oil components in sediment under natural conditions. Some scholars have also observed that n-alkanes and PAHs in sediments could be photodegraded under sunlight.25 In addition, biodegradation is also a non-negligible,42 and the effect of dispersants and turbulence on the release of petroleum components should be quantified. The purpose was to quantitatively analyze residual petroleum hydrocarbon components.
3.7.1 Residual n-alkanes in sediment. Fig. 8 showed the change of hydrocarbon components in the presence of turbulence (8a) or dispersants (8b). Table 2 showed the loss rate of n-alkanes, aromatics and biomarkers. Chemical analysis of all samples yielded comparable results and revealed that un-desorbed components (Table 2) are predominately composed of n-alkanes, approximately 70–90%. Fig. 8a and S6† showed that the release of hydrocarbon components C17–C26 was larger than that of other n-alkanes. Boylan and Tripp18 reported that the concentration of saturated hydrocarbons was increased in the aqueous extract when the mixture was stirred turbulently. In addition, continued turbulence is more likely to accelerate oil weathering. Fig. 8b showed that the dispersant influences release, but not to great effect. Tween 80 had a stronger effect of release compared to the other three dispersants, especially on C9–C26 n-alkanes (67.92%) (Fig. 8b and S5†). However, Span 80 seemed to have a greater effect on C27–C38 alkanes, whose release rate reached 23.10%. This showed that Span 80 had a larger impact on high molecular weight hydrocarbons. This was because Span 80 could easily form inverse micelles with water or water-soluble monomers.43 In the presence of the four dispersants, C17–C30 had a higher residual concentration than other alkane components.
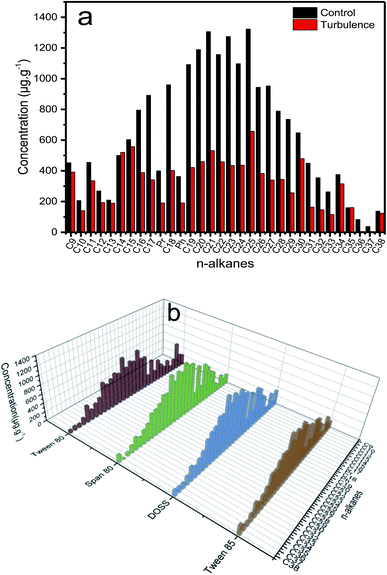 |
| | Fig. 8 Distributions of n-alkanes in the sediment 96 hours prepared with turbulence in 120 rpm (a) and four dispersant (b), respectively, at a fixed DOR of 1![[thin space (1/6-em)]](https://www.rsc.org/images/entities/char_2009.gif) : :![[thin space (1/6-em)]](https://www.rsc.org/images/entities/char_2009.gif) 20. 20. | |
Table 2 The related parameters of petroleum hydrocarbons (μg g−1)
| Number |
Group |
n-alkanes |
Aromatic |
Biomarker |
Pr/Ph |
| 1 |
Tween 80 |
14![[thin space (1/6-em)]](https://www.rsc.org/images/entities/char_2009.gif) 530 530 |
502 |
490 |
1.05 |
| 2 |
Tween 85 |
16![[thin space (1/6-em)]](https://www.rsc.org/images/entities/char_2009.gif) 321 321 |
546 |
614 |
1.20 |
| 3 |
Span 80 |
17![[thin space (1/6-em)]](https://www.rsc.org/images/entities/char_2009.gif) 518 518 |
587 |
612 |
1.21 |
| 4 |
DOSS |
18![[thin space (1/6-em)]](https://www.rsc.org/images/entities/char_2009.gif) 186 186 |
511 |
544 |
1.29 |
| 5 |
Turbulence |
12![[thin space (1/6-em)]](https://www.rsc.org/images/entities/char_2009.gif) 082 082 |
319 |
205 |
1.10 |
| 6 |
Control |
20![[thin space (1/6-em)]](https://www.rsc.org/images/entities/char_2009.gif) 471 471 |
608 |
710 |
1.00 |
3.7.2 Residual PAHs in sediment. In each oil samples study, significant differences in relative amounts of 2–6 rings compounds were observed (Fig. 9 and S7†), especially, 2–3 rings compounds. Fig. 9a showed that naphthalene and phenanthrene proved strongly influenced by turbulence. The loss rate of phenanthrene was the largest and reached 61.45%, while naphthalene reached 37.23%. This indicated that the 2–3 rings compounds were more sensitive than other compounds to the presence of turbulence. This may be because of the higher solubility of lower molecular weight PAHs. Fig. 9b showed that dispersants had little effect on the aromatic hydrocarbon components. This is because the structure of the aromatics are more complex and stable than that of n-alkanes. The concentration of desorbed naphthalene was the largest and reached 31.51%. The relevant literature showed that Tween 80 facilitates the removal of crude oil by about 35% in contaminated soil.44 This further validates our conclusion. However, the concentration of desorbed PAHs reduced after using dispersants, compared with the turbulence conditions. This can be attributed to the added PAHs affinity and capacity due to sorption of the dispersant on the sediments. This experiment is important for understanding the roles of oil dispersants and turbulence on the distribution, transport and persistent components of petroleum hydrocarbons in seawater-sediments.
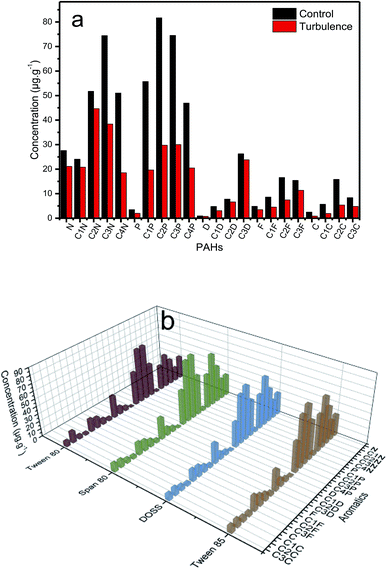 |
| | Fig. 9 Distributions of PAHs in the sediment 96 hours prepared with turbulence in 120 rpm (a) and four dispersant (b), respectively, at a fixed DOR of 1![[thin space (1/6-em)]](https://www.rsc.org/images/entities/char_2009.gif) : :![[thin space (1/6-em)]](https://www.rsc.org/images/entities/char_2009.gif) 20. 20. | |
4. Conclusion
This study investigated the role of environmental and physicochemical factors in the release of petroleum hydrocarbons in seawater-sediment systems. The kinetic study showed that static oil release reached equilibration after 24 h and the oil release process was fitted to the first-order kinetics model. Among the environmental factors, temperature had the greatest influence on oil release, followed by salinity and pH. For the four dispersants, Tween 80 showed the greatest performance on the release of petroleum hydrocarbons from sediment, with the highest oil release ratio of 26.85%. In addition, the release ratio of the oil increased to 40.28% at 120 rpm, the highest turbulence level. However, the combination of dispersants and turbulence had smaller effect than turbulence alone. The dispersant was more selective for C9–C26 n-alkanes or 2 rings PAHs of naphthalene. Moreover, the turbulence significantly enhances release of the C17–C26 n-alkane component and the PAHs of naphthalene and phenanthrene. However, the residual oil still contained a higher proportion of C15–C35 n-alkanes and 2–3 rings PAHs. These results are useful for a complete understanding of the persistent residual oil in sediments and estimating the long-term release rate of contaminated sediments in marine ecosystems.
Conflicts of interest
There are no conflicts to declare.
Acknowledgements
This research was supported by the Shandong Provincial Natural Science Foundation, China (ZR2018MD017); Natural attenuation and trajectory forecasting of marine spilled dilbit in Chinese/Canadian waters DFO MPRI 5.08; the Fundamental Research Funds for the Central Universities (201822009); the National Key Research and Development Program (2016YFC1402301); the Open Foundation of Key Laboratory of Marine Spill Oil Identification and Damage Assessment Technology of SOA (201702); the Program for Innovative Research Team in University (IRT1289). This is MCTL Contribution No. 201.
References
- S. C. Bagby, C. M. Reddy, C. Aeppli, G. B. Fisher and D. L. Valentine, Proc. Natl. Acad. Sci. U. S. A., 2017, 114, E9–E18 CrossRef CAS PubMed.
- J. R. Bragg, R. C. Prince, E. J. Harner and R. M. Atlas, Nature, 1994, 368, 413 CrossRef CAS.
- M. S. Sim, I. J. Jo and H. G. Song, Mar. Pollut. Bull., 2010, 60, 51–57 CrossRef CAS PubMed.
- D. P. Prendergast and P. M. Gschwend, J. Cleaner Prod., 2014, 78, 233–242 CrossRef CAS.
- J. F. Carriger and M. G. Barron, Environ. Sci. Technol., 2011, 45, 7631–7639 CrossRef CAS PubMed.
- S. D. Ramachandran, P. V. Hodson, C. W. Khan and K. Lee, Ecotoxicol. Environ. Saf., 2004, 59, 300–308 CrossRef CAS PubMed.
- E. B. Kujawinski, M. C. Kido Soule, D. L. Valentine, A. K. Boysen, K. Longnecker and M. C. Redmond, Environ. Sci. Technol., 2011, 45, 1298–1306 CrossRef CAS PubMed.
- B. J. Place, M. J. Perkins, E. Sinclair, A. L. Barsamian, P. R. Blakemore and J. A. Field, Deep Sea Res., Part II, 2016, 129, 273–281 CrossRef CAS PubMed.
- J. Gros, S. A. Socolofsky, A. L. Dissanayake, I. Jun, L. Zhao, M. C. Boufadel, C. M. Reddy and J. S. Arey, Proc. Natl. Acad. Sci. U. S. A., 2017, 114, 10065–10070 CrossRef CAS PubMed.
- D. A. Riehm, D. J. Rokke and A. V. McCormick, Langmuir, 2016, 32, 3954–3962 CrossRef CAS PubMed.
- L. J. Thibodeaux, K. T. Valsaraj, V. T. John, K. D. Papadopoulos, L. R. Pratt and N. S. Pesika, Environ. Eng. Sci., 2011, 28, 87–93 CrossRef CAS.
- J. R. Payne, J. R. Clayton and B. E. Kirstein, Spill Sci. Technol. Bull., 2003, 8, 201–221 CrossRef CAS.
- A. Khelifa, P. Stoffyn-Egli, P. S. Hill and K. Lee, Mar. Environ. Res., 2005, 59, 235–254 CrossRef CAS PubMed.
- R. E. Turner, E. B. Overton, B. M. Meyer, M. S. Miles, G. McClenachan, L. Hooper-Bui, A. S. Engel, E. M. Swenson, J. M. Lee, C. S. Milan and H. Gao, Mar. Pollut. Bull., 2014, 87, 57–67 CrossRef CAS PubMed.
- Z. Dincer Kırman, J. L. Sericano, T. L. Wade, T. S. Bianchi, F. Marcantonio and A. S. Kolker, Environ. Pollut., 2016, 214, 101–113 CrossRef PubMed.
- J. B. Culbertson, I. Valiela, E. E. Peacock, C. M. Reddy, A. Carter and R. VanderKruik, Mar. Pollut. Bull., 2007, 54, 955–962 CrossRef CAS PubMed.
- L. Yuan, L. Han, W. Bo, H. Chen, W. Gao and B. Chen, Mar. Pollut. Bull., 2017, 118, 79–84 CrossRef CAS PubMed.
- D. B. Boylan and B. W. Tripp, Nature, 1971, 230, 44 CrossRef CAS PubMed.
- M. C. Rios, Í. T. A. Moreira, O. M. C. Oliveira, T. S. Pereira, M. de Almeida, M. C. L. F. Trindade, L. Menezes and A. S. Caldas, Mar. Pollut. Bull., 2017, 114, 364–371 CrossRef CAS PubMed.
- P. Stoffyn-Egli and K. Lee, Spill Sci. Technol. Bull., 2002, 8, 31–44 CrossRef.
- Y. Hua, F. S. Mirnaghi, Z. Yang, B. P. Hollebone and C. E. Brown, Chemosphere, 2018, 191, 1038–1047 CrossRef CAS PubMed.
- Z. Yang, Y. Hua, F. Mirnaghi, B. P. Hollebone, P. Jackman, C. E. Brown, C. Yang, K. Shah, M. Landriault and B. Chan, Chemosphere, 2018, 191, 145–155 CrossRef CAS PubMed.
- Y. Gong, X. Zhao, Z. Cai, S. E. O'Reilly, X. Hao and D. Zhao, Mar. Pollut. Bull., 2014, 79, 16–33 CrossRef CAS PubMed.
- F. Pan, J. Ma, Y. Wang, Y. Zhang, L. Chen and W. M. Edmunds, Environ. Monit. Assess., 2013, 185, 8023–8034 CrossRef CAS PubMed.
- X. Zhao, W. Liu, J. Fu, Z. Cai, S. E. O'Reilly and D. Zhao, Mar. Pollut. Bull., 2016, 109, 526–538 CrossRef CAS PubMed.
- Q. F. Wei, R. R. Mather and A. F. Fotheringham, Bioresour. Technol., 2005, 96, 331–334 CrossRef CAS PubMed.
- Y. Gong, X. Zhao, S. E. O'Reilly, T. Qian and D. Zhao, Environ. Pollut., 2014, 185, 240–249 CrossRef CAS PubMed.
- L. O. Ajijolaiya, P. S. Hill, A. Khelifa, R. M. Islam and K. Lee, Mar. Pollut. Bull., 2006, 52, 920–927 CrossRef CAS PubMed.
- H. Zhang, M. Khatibi, Y. Zheng, K. Lee, Z. Li and J. V. Mullin, Mar. Pollut. Bull., 2010, 60, 1433–1441 CrossRef CAS PubMed.
- M. I. Rakowska, M. P. J. Smit, D. Kupryianchyk, J. Qin, A. A. Koelmans, H. H. M. Rijnaarts and T. Grotenhuis, J. Soils Sediments, 2017, 17, 277–285 CrossRef CAS.
- K. Caldeira and M. E. Wickett, Nature, 2003, 425, 365 CrossRef CAS PubMed.
- V. J. Kaku, M. C. Boufadel and A. D. Venosa, J. Environ. Eng., 2006, 132, 93–101 CrossRef CAS.
- X. Zhuang, Y. Pi, M. Bao, Y. Li and X. Zheng, RSC Adv., 2015, 5, 98990–98998 RSC.
- J. Gros, D. Nabi, B. Würz, L. Y. Wick, C. P. D. Brussaard, J. Huisman, J. R. van der Meer, C. M. Reddy and J. S. Arey, Environ. Sci. Technol., 2014, 48, 9400–9411 CrossRef CAS PubMed.
- X.-Y. Cao, H. Han, G.-P. Yang, H.-B. Ding and H.-H. Zhang, Water, Air, Soil Pollut., 2013, 224, 1611 CrossRef.
- X. Ma, A. Cogswell, Z. Li and K. Lee, Environ. Technol., 2008, 29, 739–748 CrossRef CAS PubMed.
- S. Chandrasekar, G. A. Sorial and J. W. Weaver, ICES J. Mar. Sci., 2006, 63, 1418–1430 CrossRef CAS.
- R. C. Belore, K. Trudel, J. V. Mullin and A. Guarino, Mar. Pollut. Bull., 2009, 58, 118–128 CrossRef CAS PubMed.
- B. J. Rothschild and T. R. Osborn, J. Plankton Res., 1988, 10, 465–474 CrossRef.
- B. G. Kwon, K. Koizumi, S.-Y. Chung, Y. Kodera, J.-O. Kim and K. Saido, J. Hazard. Mater., 2015, 300, 359–367 CrossRef CAS PubMed.
- J. Duan, W. Liu, X. Zhao, Y. Han, S. E. O'Reilly and D. Zhao, Sci. Total Environ., 2018, 618, 1244–1253 CrossRef CAS PubMed.
- D. M. Jones, I. M. Head, N. D. Gray, J. J. Adams, A. K. Rowan, C. M. Aitken, B. Bennett, H. Huang, A. Brown, B. F. J. Bowler, T. Oldenburg, M. Erdmann and S. R. Larter, Nature, 2007, 451, 176 CrossRef PubMed.
- H. Cong, B. Yu, L. Gao, B. Yang, F. Gao, H. Zhang and Y. Liu, RSC Adv., 2018, 8, 2593–2598 RSC.
- C.-C. Lai, Y.-C. Huang, Y.-H. Wei and J.-S. Chang, J. Hazard. Mater., 2009, 167, 609–614 CrossRef CAS PubMed.
Footnote |
| † Electronic supplementary information (ESI) available. See DOI: 10.1039/c8ra08871c |
|
| This journal is © The Royal Society of Chemistry 2019 |
Click here to see how this site uses Cookies. View our privacy policy here.  Open Access Article
 *ab and
Ximing Lid
![[thin space (1/6-em)]](https://www.rsc.org/images/entities/char_2009.gif) :
:![[thin space (1/6-em)]](https://www.rsc.org/images/entities/char_2009.gif) 20 (v/v) for the tests. This ratio is often a target for dispersant effectiveness testing. The solutions used for releasing petroleum hydrocarbons in the contaminated samples were as follows: seawater used as a control; Tween 80, Tween 85, Span 80 and DOSS used as surfactant. The experiments of turbulence were carried out on an oscillator (IS-RDS3, Crystal Technology & Industries, Inc, TX, USA) and the rotating speed was set at 60, 90 and 120 rpm. This rotating speed was used to simulate the different energy mixing conditions in marine environments.21 In this case, simulation of these interactions in laboratory experiments was possible because the turbulence in the flask was similar to those found in marine environments.32,33 To simulate the marine environment as much as possible, environmental factors had a salinity of 3.4 wt%, pH 7.2, and temperature of 15 ± 2 °C. We acknowledged that there was a certain gap between the laboratory environment and a real-world oil spill. However, understanding these factors is crucial to extrapolating the results from idealized laboratory experiments.
20 (v/v) for the tests. This ratio is often a target for dispersant effectiveness testing. The solutions used for releasing petroleum hydrocarbons in the contaminated samples were as follows: seawater used as a control; Tween 80, Tween 85, Span 80 and DOSS used as surfactant. The experiments of turbulence were carried out on an oscillator (IS-RDS3, Crystal Technology & Industries, Inc, TX, USA) and the rotating speed was set at 60, 90 and 120 rpm. This rotating speed was used to simulate the different energy mixing conditions in marine environments.21 In this case, simulation of these interactions in laboratory experiments was possible because the turbulence in the flask was similar to those found in marine environments.32,33 To simulate the marine environment as much as possible, environmental factors had a salinity of 3.4 wt%, pH 7.2, and temperature of 15 ± 2 °C. We acknowledged that there was a certain gap between the laboratory environment and a real-world oil spill. However, understanding these factors is crucial to extrapolating the results from idealized laboratory experiments.
![[thin space (1/6-em)]](https://www.rsc.org/images/entities/char_2009.gif) ln
ln![[thin space (1/6-em)]](https://www.rsc.org/images/entities/char_2009.gif) t
t


![[thin space (1/6-em)]](https://www.rsc.org/images/entities/char_2009.gif) :
:![[thin space (1/6-em)]](https://www.rsc.org/images/entities/char_2009.gif) 20.
20.![[thin space (1/6-em)]](https://www.rsc.org/images/entities/char_2009.gif) 530
530![[thin space (1/6-em)]](https://www.rsc.org/images/entities/char_2009.gif) 321
321![[thin space (1/6-em)]](https://www.rsc.org/images/entities/char_2009.gif) 518
518![[thin space (1/6-em)]](https://www.rsc.org/images/entities/char_2009.gif) 186
186![[thin space (1/6-em)]](https://www.rsc.org/images/entities/char_2009.gif) 082
082![[thin space (1/6-em)]](https://www.rsc.org/images/entities/char_2009.gif) 471
471


