
 Open Access Article
 This Open Access Article is licensed under a Creative Commons Attribution-Non Commercial 3.0 Unported Licence
Influence of the head group on dynamics in surfactant intercalated graphite oxide†
Xiaoqian Aia,
Minmin Zhanga,
Ye Yana,
Xiaoming Zhanga,
Xiaoxiao Caoa,
Qiong Wanga and
Ligang Ma *b
*b
aCollege of Physics and Electronic Engineering, Jiangsu Second Normal University, 210013, China
bSchool of Electronic Engineering, Nanjing Xiaozhuang University, 211171, Nanjing, China. E-mail: maligang186@163.com
First published on 17th January 2019
Abstract
The influence of the headgroup on the dynamics of three different alkylammonium cations confined in graphite oxide (GO) was studied by temperature-dependent impedance spectroscopy. X-ray diffraction, X-ray photoelectron spectroscopy, Fourier-transform infrared spectroscopy, thermogravimetry and elemental analysis served to characterize the composites. The alkylammonium cations were connected to the C–O− group of GO via ionic interactions, and the backbone of the confined molecule was distributed as a flat monolayer with the long axis parallel to the GO layer. Ngai's correlated-state model was used, with asymmetry at low temperature in the loss peaks. The calculated true activation energy of 114 meV ± 6% meV is almost the same as the internal rotation barrier of the alkyl macromolecule. We conclude that the relaxation process is definitely attributed to the wobbling around the long molecular axes of the confined ions, an intrinsic motion, not the reorientation of C–H at the headgroup, and it is also due to geometric structural symmetry at the headgroup of the alkylammonium molecules with the interaction of their backbones and the skeletons of GO resulting in the difference in the apparent activation energy.
1. Introduction
Recently, organic-intercalated layered solids have been studied in different fields as their new physical and chemical properties are dramatically different from their bulk counterparts such as their electrical properties,1 mechanical properties,2 thermal behavior,3 surface and interfacial properties,4 and so on. Surfactants are well known for their amphipathic organic molecular structure, which can be used to modify the surface properties of hydrophilic materials, such as layered double hydroxides,5 layered metal phosphate6 and two-dimensional layered materials,4 to mix with the hydrophobic polymer chains to obtain wonderful nanocomposites. Their thermodynamics have significant practical and theoretical interest, as a result of their configurational complexity, which can be impacted by their concentration, chain length or chemical environment.Alkylammonium halides are more common in terms of surfactants. n-alkylammonium halides form tetragonal crystals around room temperature belonging to space group P4/nmm.7–9 They have a two-dimensional (2D) lamellar-type structure with rod-like cations and halides anions stacked alternately along the crystallographic C4 axis. The cations are dynamically disordered and packed between the layers of anions keeping their long axis perpendicular to the layers. As the arrangement and the motion of the alkyl chains in this phase are quite similar to those in the rotator phase of the n-paraffins10 below their melting point in the temperature region, this phase is called the rotator phase. Ikeda's group have proved that the rotator phase of n-alkylammnonium chlorides (C6–C10) has uniaxial rotation of the long rod-like cations,7 and also C3 reorientation of the CH3 and NH3+ was observed by nuclear magnetic resonance (NMR).8,9 The dynamical behaviors of alkylammonium cations confined in layered materials have been investigated by computational and experimental techniques, for example molecular simulation,11 solid state NMR,12,13 Fourier-transform infrared spectroscopy (FTIR),14 and so on. There have been some common conclusions that the confined alkylammonium cations assume an all-trans conformation at low temperatures and change to the gauche conformation upon heating, then leading to a phase transition at relatively elevated temperatures.
Recently, a new dynamic behavior of confined hexadecyltrimethylammonium ions in a layer was observed by Boris and coworkers15 using NMR measurements. Below room temperature, there is restricted mobility of the molecules, an essentially all-trans conformation by the chains, which has a rotator-type molecular motion around the long molecular axes of the chains. Then with increasing temperature, dynamic transformation takes place, and the confined chains undergo rotation about the molecular axis. Graphite oxide (GO), a typical pseudo-two-dimensional solid, possesses C–OH and –COOH groups and epoxide functional groups.16 These groups make GO easily absorb polar molecules and polar polymer by different means, and react with them to form GO intercalated nanocomposites or exfoliated nanocomposites.17 These kinds of organic-graphite oxide nano-scale hybrid materials often exhibit interesting electrochemical properties.18 What is more, Gaetano Guerra et al.19 through X-ray diffraction (XRD) and differential scanning calorimetry proved that there was a hexagonal rotator order in GO intercalation compounds at high temperatures for organic cations containing two long hydrocarbon tails. Now, we choose three different surfactants, which are hexadecyltrimethylammonium chloride (C16H33N(CH3)3Cl, C16TMACl) with three methyls on the headgroup, ethylhexadecyldimethylammonium bromide (C16H33N(CH3)2(C2H5)Br, C16DMEABr) with one ethyl and two methyls on the headgroup and hexadecylpyridinium monohydrate chloride (C16H33C5H5NCl·H2O, C16PyCl·H2O) with a benzene ring on its headgroup, to research whether there is C3 reorientation of the CH3 or reorientation along the molecular long axis through impedance spectroscopy. These three different surfactants have the same chain length but different headgroups, and on the basis of Ngai's correlated-state model it can be very suitable to study the nature of surfactant motion. Combining temperature-dependent dielectric relaxation spectroscopy with structural characterization, molecular level information was presented to determine the influence of headgroup on the dynamics of confined alkylammonium ions inside a GO layer.
2. Experimental details
2.1 Preparation of GO
GO was synthesized from natural graphite powder using the Hummers method20 with some modification in this paper. Graphite powder (6 g), NaNO3 (6 g) and 98% H2SO4 (132 mL) were added into a beaker in an ice bath and stirred for 30 min, followed by the gradual addition of KMnO4 powder (24 g). After another 30 min, distilled water (276 mL) dropped slowly into the constantly stirred mixture of reactants, with its temperature kept below 35 °C. Then the beaker was transferred to an oil bath and stirred at 95 °C for 1 hour. Lastly, distilled water and 30% H2O2 were used to remove unreacted KMnO4. GO powder was obtained after the residue was washed, centrifuged, dialyzed, filtered and dried.2.2 Preparation of the nanocomposites
GO powder (100 mg) was dissolved and exfoliated for 30 min in 0.05 M NaOH solution (24 mL) inside a GA92-IID ultrasonicator (Wuxi, China), followed by the addition of 100 mL aqueous solutions of 48 mg C16TMACl, 57 mg C16DMEABr and 54 mg C16PyCl·H2O, respectively, which is in analogy with the procedure reported by Matsuo et al.21 and Gaetano Guerra et al.19 Then the as-prepared nanocomposites were filtrated repeatedly and dried in a vacuum drying oven at 50 °C for 12 h, which were labelled as C16TMA-GO, C16DMEA-GO and C16Py-GO, respectively.2.3 Experimental techniques
Small-angle X-ray diffraction (SAXD) patterns were performed directly on GO and nanocomposite samples using a Bruker D8 Advance diffractometer (40 kV, 40 mA) with nickel filtered Cu-Kα radiation (λ = 0.15406 nm) at a scanning speed of 2° min−1 in the 2θ ranges of 0.5–30°.X-ray photoelectron spectroscopy (XPS) proceeded in a Thermo Scientific K-alpha that provided Al-Kα radiation as the photon source. Survey spectra were measured with a pass energy of 200.0 eV in 1.0 eV steps, followed by high-resolution scans of the C 1s signals in 0.10 eV steps with a pass energy of 50.0 eV.
FTIR absorption was measured in a Nicolet Nexus 870 spectrometer on pressed KBr pellets under ambient conditions, over the range of 4000 to 400 cm−1. Thermogravimetric analysis (TGA) experiments proceeded under N2 atmosphere between room temperature and 1073 K at 20 K min−1, in a Perkin Elmer Pyris-1 calorimeter. Elemental chemical analysis was performed on a (C, H, N, S, O) Vario MICRO Elementar analyzer produced in Germany.
After these characterizations, impedance spectroscopy was conducted using an Agilent E4980A meter in a three-terminal configuration under computer control. The powders were pressed into pellets of 8 mm diameter and 0.4 mm thickness at 6.0 Mpa, and then were placed on a gold-plated copper block under vacuum inside a steel chamber, with heating at a constant rate of 1 K min−1 and measurements by a Cu–CuNi thermocouple with an accuracy of 0.1 K. Preliminary runs on pellets previously dried in situ under a dynamic vacuum of 30 Pa, for 24 h at 50 °C, prevented water effects.
3. Results
In order to determine the effect of surfactants on GO layer spacing, SAXD was used. Fig. 1 shows the SAXD patterns of GO and surfactant-intercalated in GO (SIGO) nanocomposites starting from about 2.5°. The diffraction peak at 2θ = 11.69°, corresponding to an interlayer spacing of 0.76 nm, shifted to a lower angle after intercalation of surfactants with the same alkyl chain length but a different alkylammonium headgroup, which are 1.13, 1.17 and 1.16 nm for C16TMA-GO, C16Py-GO and C16DMEA-GO, respectively. Their interlayer spacings are similar, and the enlarged interlayer spacing confirms that the surfactant was successfully inserted into the GO layer. From ref. 22, the length of hexadecylamine molecules with all-trans conformations is similar to 2.2 nm, and the interatomic distance between the farthest two hydrogen atoms of it is 0.31 ± 0.12 nm. Thus, the alkyl chains have no choice but to form a lateral monolayer with their long axis almost parallel to the GO layer. In addition, a wide diffraction peak at about 18° appears compared to GO, corresponding to the characteristic peak of part reduced GO.23,24 | ||
| Fig. 1 SAXD patterns of (a) GO, (b) C16TMA-GO, (c) C16DMEA-GO and (d) C16Py-GO nanocomposites. | ||
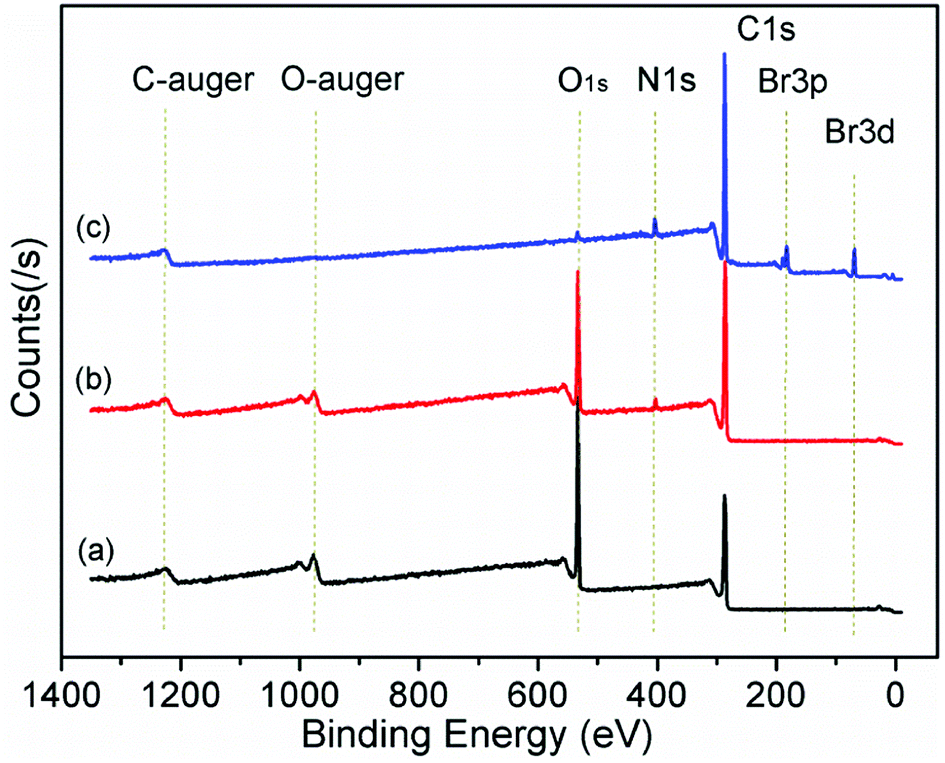
Fig. 2 shows the XPS data of GO, C16DMEA-GO and C16DMEABr to determine the type of element, and others are included in the ESI.† We can conclude that the composite contains the elements C, N, and O, where C and O come from GO and N comes from the surfactant. The absence of Br in the composite, which is at the head of the molecular chains, was attributed to the replacement of Br− by C–O− from the GO layer.
 | ||
| Fig. 2 Survey scans XPS spectra of (a) GO, (b) C16DMEA-GO and (c) C16DMEABr. | ||
TGA was used to determine the water content in GO and its composites, as shown in Fig. 3. Combining with elemental analysis data exhibited in Table 1, we can conclude how many surfactants was intercalated into the GO layer. The TGA of GO is presented for comparison. From the derivative weight, loss of weight at each stage was obtained. GO showed one weight loss step below 160 °C associated with the desorption of adsorbed and combined water in the GO layer, and a second one associated with the decomposition of oxygen-containing functional groups. The continuous weight loss of 19% above 250 °C was attributed to the decomposition of the carbon backbone until 800 °C.24 The composites have similar thermolysis behavior, but different from that of GO. After the surfactants were added, an additional weight loss between 200 and 480 °C was observed, corresponding to the pyrolysis of surfactants.25 It is noteworthy that the first weight loss step in the composites suggests that only 6–7% weight loss is related to the residual water. The water content results of GO and its composite materials are listed in Table 1. Using this information and in addition to the data from the elemental analysis, nitrogen content is similar and the C/N ratio in composites for the same added concentrations is gradually increased compared with that in the surfactant. These mean surfactant molecules exist between the GO layer. Combined with the XPS results, similar concentration values of 0.13 mmol alkylammonium cations per 100 mg GO were calculated in the three different nanocomposites.
| Sample | C (wt%) | H (wt%) | N (wt%) | H2O (weight%) |
|---|---|---|---|---|
| GO | 49.16 | 3.07 | — | 15.33 |
| C16TMA-GO | 61.55 | 6.04 | 1.25 | 6.04 |
| C16DMEA-GO | 62.40 | 6.32 | 1.25 | 6.87 |
| C16Py-GO | 63.48 | 5.57 | 1.24 | 6.21 |
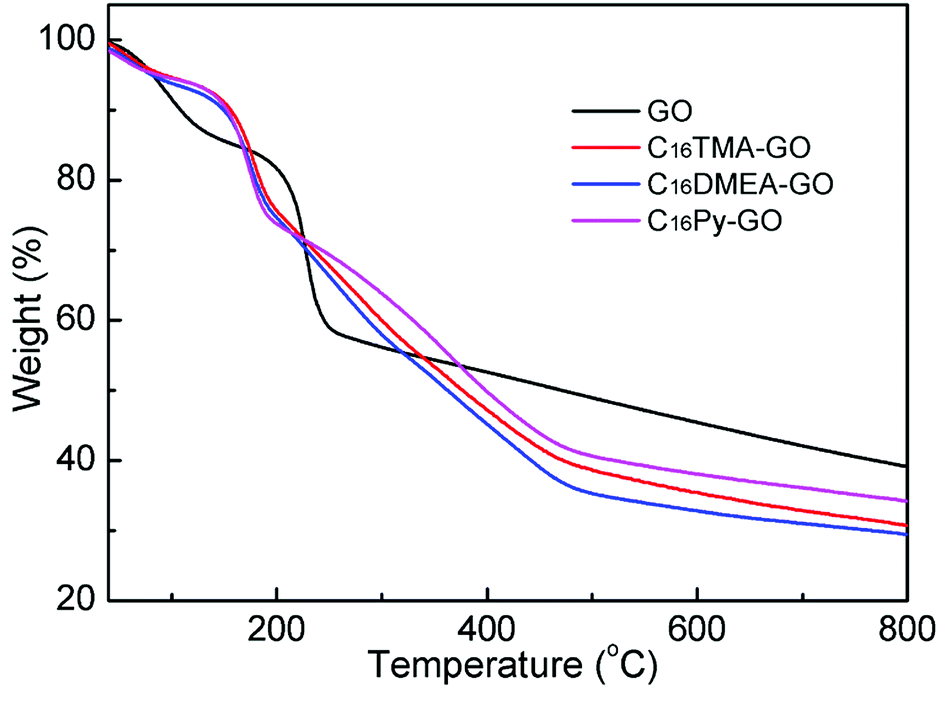 | ||
| Fig. 3 TGA patterns of GO, C16TMA-GO, C16DMEA-GO and C16Py-GO nanocomposites. | ||
In Fig. 4, one example of an FTIR spectrum of C16DMEA-GO intercalation compounds, together with that of C16DMEA and GO are shown. The FTIR spectra of other relevant samples are included in the ESI.† The wide absorption band above 3000 cm−1 is related to O–H stretching vibrations, where the peak located at about 3600 cm−1 corresponds to the hydroxyl groups from GO.26,27 Other typical absorption bands related to the vibration of C![[double bond, length as m-dash]](https://www.rsc.org/images/entities/char_e001.gif) O (∼1720 cm−1), CC (∼1615 cm−1), tertiary C–OH (∼1360 cm−1), phenolic groups (∼1225 cm−1) and C–O–C (∼1060 cm−1) also appeared clearly.27 When surfactant was added into the GO layer, some new absorption bands derived from C16DMEA related to the vibration of the CH2 asymmetric stretching vibration (∼2920 cm−1), vas(CH2), and CH2 symmetric stretching vibration (∼2850 cm−1), vs(CH2), appeared.28 Furthermore, compared to GO, in the nanocomposite weakening of absorption bands derived from the hydroxyl groups (∼3600 cm−1) and phenolic groups (∼1220 cm−1) indicates that the surfactant ion with a plus charge ionically bonds to the C–O− groups of GO. In addition, compared to the absorption band related to the CC vibration (∼1615 cm−1), the intensity of the absorption band related to the CO vibration (1720 cm−1) became weak, which was attributed to the part of oxygen-containing functional groups falling off GO.
O (∼1720 cm−1), CC (∼1615 cm−1), tertiary C–OH (∼1360 cm−1), phenolic groups (∼1225 cm−1) and C–O–C (∼1060 cm−1) also appeared clearly.27 When surfactant was added into the GO layer, some new absorption bands derived from C16DMEA related to the vibration of the CH2 asymmetric stretching vibration (∼2920 cm−1), vas(CH2), and CH2 symmetric stretching vibration (∼2850 cm−1), vs(CH2), appeared.28 Furthermore, compared to GO, in the nanocomposite weakening of absorption bands derived from the hydroxyl groups (∼3600 cm−1) and phenolic groups (∼1220 cm−1) indicates that the surfactant ion with a plus charge ionically bonds to the C–O− groups of GO. In addition, compared to the absorption band related to the CC vibration (∼1615 cm−1), the intensity of the absorption band related to the CO vibration (1720 cm−1) became weak, which was attributed to the part of oxygen-containing functional groups falling off GO.
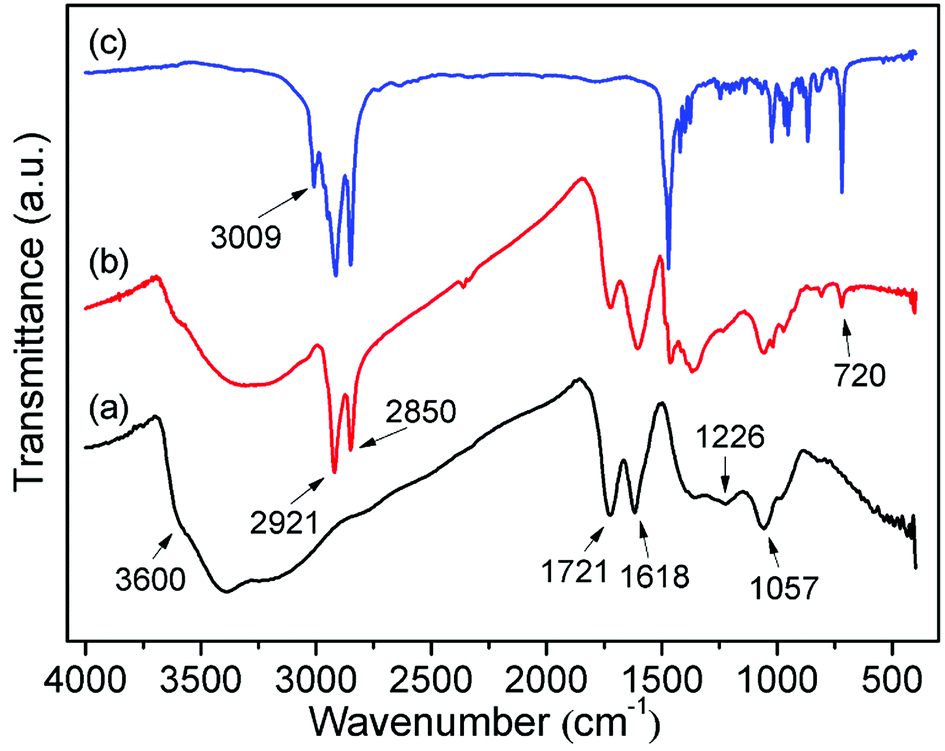 | ||
| Fig. 4 FTIR spectra of (a) GO, (b) C16DMEA-GO and (c) C16DMEABr. | ||
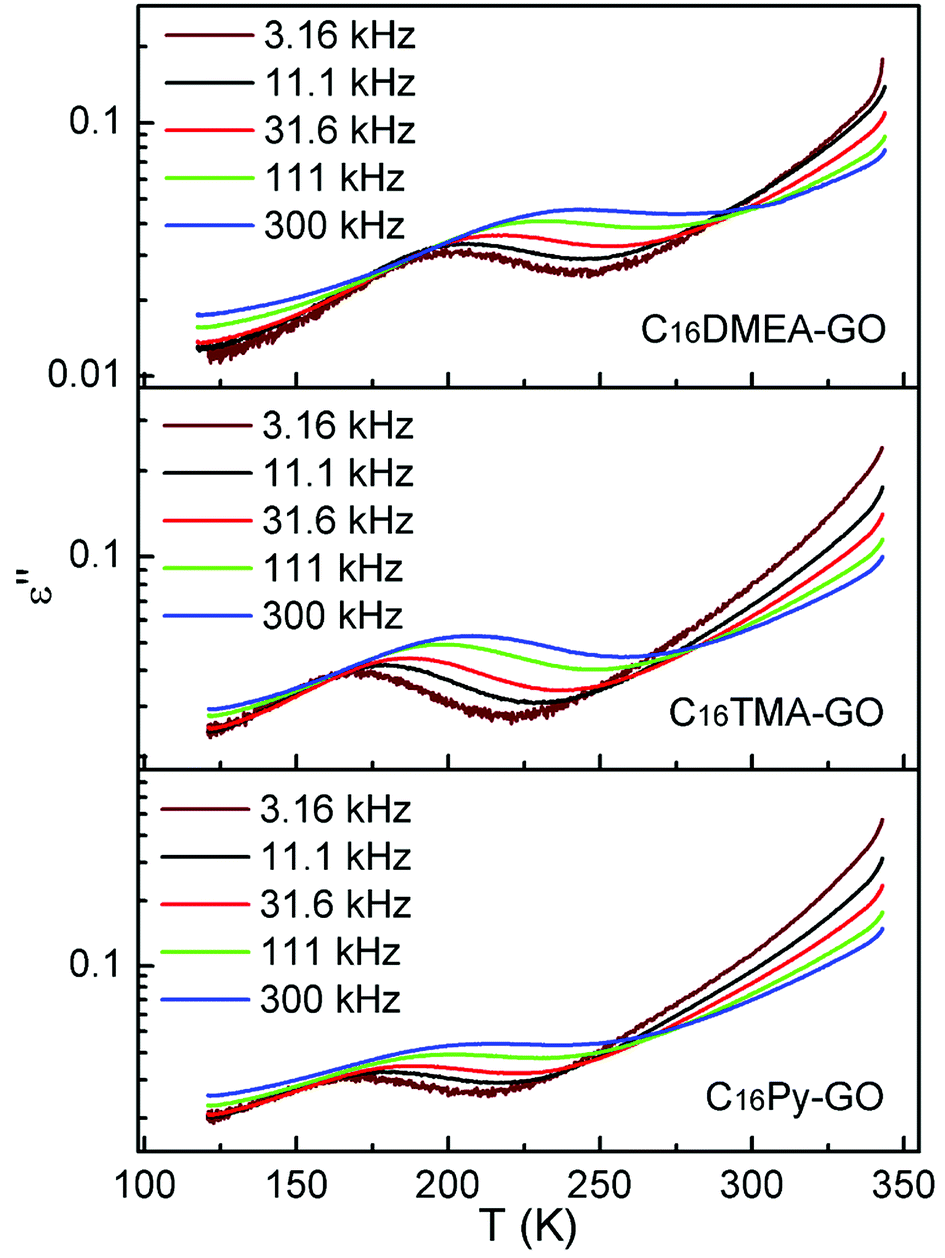
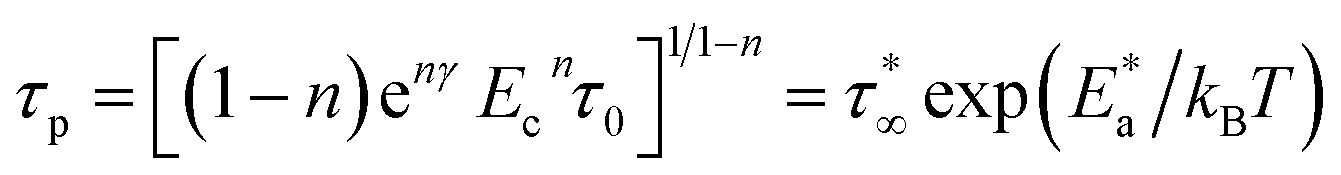
Fig. 5 shows the temperature dependence of dielectric loss at five selected frequencies for three kinds of nanocomposites. The position for the loss peak shifts toward higher temperatures with the increase of frequency, which obviously implies a relaxation process. Thermal dependence of relaxation time τ for the loss process in nanocomposites is shown in Fig. 6. The relaxation time was fitted with an Arrhenius relationship:
τ(T) = τ0![[thin space (1/6-em)]](https://www.rsc.org/images/entities/char_2009.gif) exp(Ea/kT) exp(Ea/kT)
| (1) |
 | ||
| Fig. 5 Temperature dependence of dielectric loss for the nanocomposites at various frequencies. | ||
 | ||
| Fig. 6 Temperature dependence of relaxation time for the loss process measured at several frequencies for the nanocomposites. | ||
 and logf0 derived from relaxation processes, non-exponential factor β and the actual activation energy Ea calculated by eqn (4) and (5)
| Sample |
|
log(f0 [Hz]) | β | Ea (meV) |
|---|---|---|---|---|
| C16DMEA-GO | 391 ± 4 | 13.57 | 0.31 | 120 |
| C16TMA-GO | 371 ± 2 | 14.45 | 0.31 | 114 |
| C16Py-GO | 352 ± 7 | 13.84 | 0.32 | 107 |
4. Discussion
Characterization measurements show that the alkylammonium cations were connected to the C–O− group of GO via ionic interactions, and the backbone of the confined molecule distributes as a flat monolayer with the long axis parallel to the GO layer. Each of the nanocomposites undergoes a relaxation process, which should be attributed to the motion of the distinctive alkylammonium cation. However, from Fig. 7, it can be seen that each loss peak is obviously asymmetric with longer tails on the low temperature side, which deviate from ideal Debye characteristics. The deviation is due to Van der Waals interaction between the alkylammonium molecular backbones in the alkylammonium cations, or the interaction of the alkylammonium molecular backbones with the skeletons of GO (2D polymer) in our nanocomposites. So the relaxation behavior is analyzed with the help of the Ngai's correlated-states model.29–31 A brief exposition is presented as follows.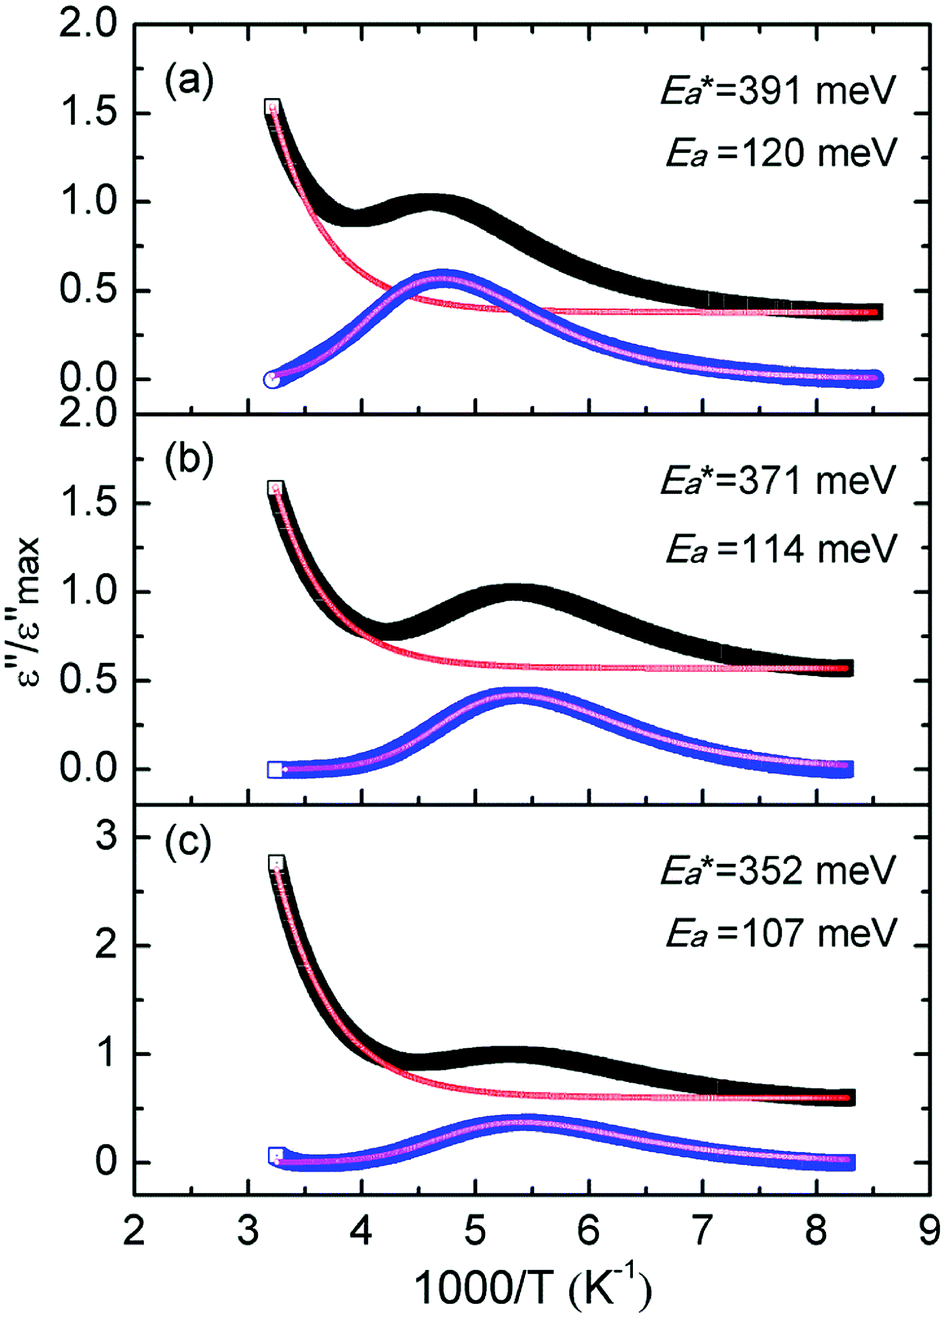 | ||
| Fig. 7 Inverse temperature plots of normalized ε′′ measured at 3.16 kHz before (black) and after (blue) background subtraction for (a) C16TMA-GO, (b) C16DMEA-GO and (c) C16Py-GO. Red and magenta lines represent the best fits to the backgrounds and the relaxation peaks. | ||
As we know, the Debye model is used for non-interacting dipoles which follow exponential decay
| ψ(t) = ψ(0)exp(−t/τD) | (2) |
|
ψ(t) = e−nγ(Ect)−nexp[−(−t/τp)1−n] 0 ≤ n < 1
| (3) |
 | (4) |
The normalized imaginary part  (ω) can be expressed as
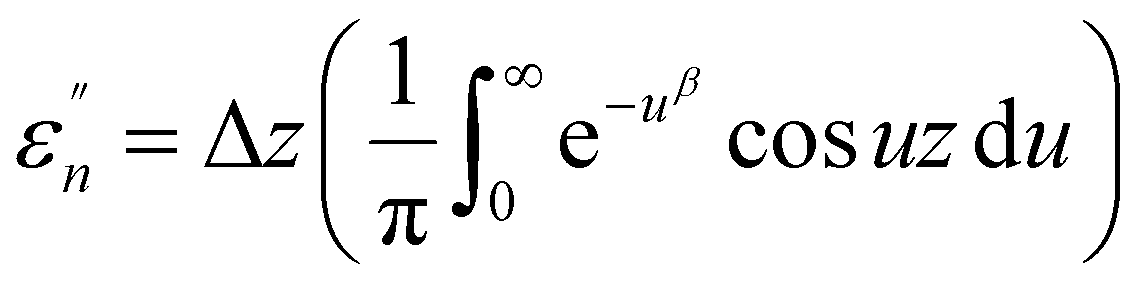 | (5) |
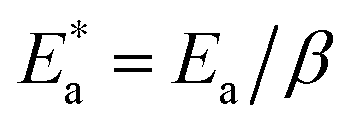
Here, Δ stands for the relaxation strength; z = ωτp; the integral in the bracket is the Levy function Qβ(z) with u = t/τp and β = 1 − n, an increase in β being equivalent to a decrease of the intermolecular coupling among the primitive motions. The actual activation energy Ea can be evaluated from its apparent activation energy  following the relationship
 | (6) |
 governs the lateral shift of the ε′′ peaks in temperature.
Fig. 7 shows the best fitting Ngai curves to our experimental data according to the convergent expressions32 of the Levy function with various n. The normalized ε′′ versus inverse temperature has been all replotted respectively. The thermal background was simulated by an exponential extrapolation and subtracted. Table 2 summarizes the nanocomposites'  , Ea and β, and their true activation energy has almost similar values of Ea = 114 meV ± 6%, which is furthermore well consistent with the internal rotation barrier of the alkyl macromolecule.7,8 In addition, the motional correlation time τ of the restricted small-angle wobbling around the long molecular axes below room temperature is in the range of 10−3 to 10−4 s,15,33 close to the measurement frequencies f (104 to 106 Hz) in our dielectric experiments. So, the observed relaxation behavior is definitely attributed to the intrinsic wobbling motion of the alkylammonium cations, but not the reorientation of the C–H at the headgroup.
The apparent activation energies of the three substances show an expected result too. From Table 1, similar concentration values of 0.13 mmol alkylammonium cations per 100 mg of GO were calculated in three different nanocomposites, with the chains extending in parallel to the GO layer. Thus, the interaction of the alkylammonium molecular backbones with the skeletons of GO is a major factor affecting the activation energies. C16DMEA+ has the worst geometric structure symmetry among the three alkylammonium cations, with one ethyl and two methyls on the headgroup. C16Py+ has the best symmetry, with a benzene ring on its headgroup. Also, the confined alkylammonium cations in layered materials assume an all-trans conformation below room temperature,15 so the difference in the size of the head groups producing different charge densities might also be a cause of the varying relaxation. Thus, the coupling was weakened, leading to a lower value of the apparent activation energy 
5. Conclusions
The loss peaks as measured using temperature-dependent impedance spectroscopy showed dielectric relaxation in the GO nanocomposites with the alkylammonium ions (C16TMA+, C16DMEA+, C16Py+) confined. Asymmetry at low temperatures in the loss peaks implies a significant departure from Debye relaxation, so Ngai's correlated-state model was used, and the calculated true activation energy of 114 meV ± 6% meV is almost equal to the internal rotation barrier of the alkyl macromolecule. The relaxation is definitely attributed to the wobbling around the long molecular axes of the confined ions, an intrinsic motion, not the reorientation of C–H at the headgroup, and is also due to geometric structural symmetry at the headgroup of the alkylammonium molecules resulting in the difference in the apparent activation energy.Conflicts of interest
There are no conflicts to declare.Acknowledgements
This work was supported by the Natural Science Foundation of the Jiangsu Higher Education Institutions of China (17KJB140005, 17KJB140012), the Natural Science Foundation of China (11804125), the College Students' Innovative Training Program of Jiangsu Province (201814436003Z), and by the Natural Science Foundation of Nanjing Xiaozhuang University (2016NXY10).References
- S. Konwer, A. Begum, S. Bordoloi and R. Boruah, Expanded graphene-oxide encapsulated polyaniline composites as sensing material for volatile organic compounds, J. Polym. Res., 2017, 24, 37 CrossRef.
- Q. Tu, I. Spanopoulos, S. Hao, C. Wolverton, M. G. Kanatzidis, G. S. Shekhawat and V. P. Dravid, Out-of-Plane Mechanical Properties of 2D Hybrid Organic-Inorganic Perovskites by Nanoindentation, ACS Appl. Mater. Interfaces, 2018, 10, 22167–22173 CrossRef CAS PubMed.
- Q. Kong, H. Zhang, L. Zheng, D. Y. Wang and J. Zhang, Effect on thermal and combustion behaviors of montmorillonite intercalation nickel compounds in polypropylene/IFR system, Polym. Adv. Technol., 2017, 28, 965–970 CrossRef CAS.
- S. Zhang, Q. Liu, H. Cheng, F. Gao, C. Liu and B. J. Teppen, Thermodynamic Mechanism and Interfacial Structure of Kaolinite Intercalation and Surface Modification by Alkane Surfactants with Neutral and Ionic Head Groups, J. Phys. Chem. C, 2017, 121, 8824–8831 CrossRef CAS PubMed.
- B. Zhang, Z. Dong, D. Sun, T. Wu and Y. Li, Enhanced adsorption capacity of dyes by surfactant-modified layered double hydroxides from aqueous solution, J. Ind. Eng. Chem., 2017, 49, 208–218 CrossRef CAS.
- X. Han, H. Yong and D. Sun, Tuning Tribological Performance of Layered Zirconium Phosphate Nanoplatelets in Oil by Surface and Interlayer Modifications, Nanoscale Res. Lett., 2017, 12, 542 CrossRef PubMed.
- S. Iwai, M. Hattori, D. Nakamura and R. Ikeda, Ionic dynamics in the rotator phase of n-alkylammonium chlorides (C6–C10), studied by 1H nuclear magnetic resonance, electrical conductivity and thermal measurements, J. Chem. Soc., Faraday Trans., 1993, 89, 827–831 RSC.
- S. Iwai, R. Ikeda and D. Nakamura, 1H nuclear magnetic resonance, differential scanning calorimetry, and electrical conductivity studies on the phase transitions of pentylammonium chloride and the cationic self-diffusion in its rotator phase, Can. J. Chem., 1988, 66, 1961–1969 CrossRef CAS.
- S.-i. Fukada, H. Yamamoto, R. Ikeda and D. Nakamura, Hydrogen-1 nuclear magnetic resonance, differential thermal analysis, X-ray powder diffraction and electrical conductivity studies on the motion of cations, including self-diffusion in crystals of propylammonium chloride and bromide as well as their n-deuterated analogues, J. Chem. Soc., Faraday Trans. 1, 1987, 83, 3207–3222 RSC.
- A. Müller, An X-ray investigation of normal paraffins near their melting points, Proc. R. Soc. London, Ser. A, 1932, 514–530 CrossRef.
- V. V. Naik and S. Vasudevan, Effect of Alkyl Chain Arrangement on Conformation and Dynamics in a Surfactant Intercalated Layered Double Hydroxide: Spectroscopic Measurements and MD Simulations, J. Phys. Chem. C, 2011, 115, 8221–8232 CrossRef CAS.
- R. Guegan, E. Véron, L. F. Le, M. Ogawa and S. Cadars, Structure and Dynamics of Nonionic Surfactant Aggregates in Layered Materials, Langmuir, 2017, 33, 9759 CrossRef CAS PubMed.
- X. Q. Ai and L. G. Ma, Study of conformation and dynamic of surfactant molecules in graphite oxide via NMR, Appl. Phys. A: Mater. Sci. Process., 2016, 122, 1–7 CAS.
- Y. L. And and H. Ishida, Concentration-Dependent Conformation of Alkyl Tail in the Nanoconfined Space: Hexadecylamine in the Silicate Galleries, Langmuir, 2003, 19, 2479–2484 CrossRef.
- B. B. Kharkov, R. W. Corkery and S. V. Dvinskikh, Phase Transitions and Chain Dynamics of Surfactants Intercalated into the Galleries of Naturally Occurring Clay Mineral Magadiite, Langmuir, 2014, 30, 7859–7866 CrossRef CAS PubMed.
- W. Gao, L. B. Alemany, L. Ci and P. M. Ajayan, New insights into the structure and reduction of graphite oxide, Nat. Chem., 2009, 1, 403–408 CrossRef CAS PubMed.
- G. Sahoo, N. Sarkar and S. K. Swain, The effect of reduced graphene oxide intercalated hybrid organoclay on the dielectric properties of polyvinylidene fluoride nanocomposite films, Appl. Clay Sci., 2018, 162, 69–82 CrossRef CAS.
- A. Ambrosi and M. Pumera, Electrochemically Exfoliated Graphene and Graphene Oxide for Energy Storage and Electrochemistry Applications, Chemistry, 2016, 22, 153–159 CrossRef CAS PubMed.
- M. Mauro, M. Maggio, V. Cipolletti, M. Galimberti, P. Longo and G. Guerra, Graphite oxide intercalation compounds with rotator hexagonal order in the intercalated layers, Carbon, 2013, 61, 395–403 CrossRef CAS.
- W. S. Hummers Jr and R. E. Offeman, Preparation of graphitic oxide, J. Am. Chem. Soc., 1958, 80, 1339 CrossRef.
- Y. Matsuo, T. Niwa and Y. Sugie, Preparation and characterization of cationic surfactant-intercalated graphite oxide, Carbon, 1999, 37, 897–901 CrossRef CAS.
- X. Fan and K. Zhao, Aggregation behavior and electrical properties of amphiphilic pyrrole-tailed ionic liquids in water, from the viewpoint of dielectric relaxation spectroscopy, Soft Matter, 2014, 10, 3259–3270 RSC.
- H.-K. Jeong, H.-J. Noh, J.-Y. Kim, M. Jin, C. Park and Y. Lee, X-ray absorption spectroscopy of graphite oxide, Europhys. Lett., 2008, 82, 67004 CrossRef.
- W. Li, X.-Z. Tang, H.-B. Zhang, Z.-G. Jiang, Z.-Z. Yu, X.-S. Du and Y.-W. Mai, Simultaneous surface functionalization and reduction of graphene oxide with octadecylamine for electrically conductive polystyrene composites, Carbon, 2011, 49, 4724–4730 CrossRef CAS.
- F. Kooli, L. I. Mianhui, S. F. Alshahateet, F. Chen and Y. Zhu, Characterization and thermal stability properties of intercalated Na-magadiite with cetyltrimethylammonium (C16TMA) surfactants, J. Phys. Chem. Solids, 2006, 67, 926–931 CrossRef CAS.
- T. Szabó, O. Berkesi, P. Forgó, K. Josepovits, Y. Sanakis, D. Petridis and I. Dékány, Evolution of surface functional groups in a series of progressively oxidized graphite oxides, Chem. Mater., 2006, 18, 2740–2749 CrossRef.
- A. B. Bourlinos, D. Gournis, D. Petridis, T. Szabó, A. Szeri and I. Dékány, Graphite oxide: chemical reduction to graphite and surface modification with primary aliphatic amines and amino acids, Langmuir, 2003, 19, 6050–6055 CrossRef CAS.
- E. Fuente, J. Menendez, M. Diez, D. Suarez and M. Montes-Moran, Infrared spectroscopy of carbon materials: a quantum chemical study of model compounds, J. Phys. Chem. B, 2003, 107, 6350–6359 CrossRef CAS.
- K. Ngai, C. White and A. Jonscher, On the origin of the universal dielectric response in condensed matter, Nature, 1979, 277, 185–189 CrossRef CAS.
- K. Ngai and C. White, Frequency Dependence of Dielectric Loss in Condensed Matter, Phys. Rev. B, 1979, 20, 2475 CrossRef CAS.
- K. Ngai, Unified theory of 1f noise and dielectric response in condensed matter, Phys. Rev. B, 1980, 22, 2066 CrossRef CAS.
- E. W. Montroll and J. T. Bendler, On Lévy (or stable) distributions and the Williams-Watts model of dielectric relaxation, J. Stat. Phys., 1984, 34, 129–162 CrossRef.
- B. B. Kharkov and S. V. Dvinskikh, Conformational Dynamics of Surfactant in a Mesolamellar Composite Studied by Local Field NMR Spectroscopy, J. Phys. Chem. C, 2013, 117, 24511–24517 CrossRef CAS.
Footnote |
| † Electronic supplementary information (ESI) available. See DOI: 10.1039/c8ra08652d |
| This journal is © The Royal Society of Chemistry 2019 |