
 Open Access Article
 This Open Access Article is licensed under a Creative Commons Attribution-Non Commercial 3.0 Unported Licence
Improved electrical transport properties of polycrystalline La0.8(Ca0.12Sr0.08)MnO3 ceramics by Ag2O doping
Gang Dong,
Tao Sun,
Fuquan Ji,
Yang Liu,
Shuai Zhang,
Zhiheng Yang,
Xiaohan Yu,
Yunbiao Duan,
Zhidong Li and
Xiang Liu *
*
School of Material Science and Engineering, Kunming University of Science and Technology, Kunming 650093, Yunnan, China. E-mail: lxjim@sina.com
First published on 14th January 2019
Abstract
Polycrystalline La0.8(Ca0.12Sr0.08)MnO3:mol%Agx (LCSMO:Agx, x = 0, 0.1, 0.2, 0.3 and 0.4) ceramics were synthesized by the sol–gel technique. Structural, electrical and magnetic properties of the LCSMO:Agx ceramics were investigated in detail. X-ray diffraction (XRD) data analyses revealed that all the samples were crystalized in the orthorhombic structure with space group of Pnma. With the increase in Ag doping (x), the grain sizes of the LCSMO:Agx samples increased and the amount of grain boundaries (GBs) decreased accordingly. At the same time, the Mn–O bond distance and the Mn–O–Mn bond angles changed correspondingly, leading to the slight increase in the lattice constants (a, b and c) and slight expansion of cell volume (V). For the LCSMO:Agx sample with x = 0.3, the optimal values of temperature coefficient of resistivity (TCR) and magnetoresistance (MR) reached 16.22% K−1 (265.1 K) and 42.07% K−1 (270.48 K), respectively. In addition, the fitting analysis of ρ–T curves showed that the experimental data were consistent with the theoretical calculation data. In the T < TMI (metal-insulator transition temperature) region, the electrical conduction mechanism of LCSMO:Agx was clarified by electron-magnon, electron–electron and electron-phonon scattering. In the T > TMI region, the resistivity data were interpreted by using the adiabatic small-polaron hopping model. Furthermore, in the entire temperature range, the phenomenological equation called the percolation model was used to explain the resistivity data and the phase-separation mechanism of ferromagnetic metallic (FM) and paramagnetic insulating (PI) phases. All the obtained results indicated that the improvement in the electrical properties of the LCSMO:Agx samples was attributed to the doping of Ag, which changed the A-site (La, Ca and Sr ions) average ion radius, the Mn–O–Mn bond angles and the Mn–O bond distance. In addition, the grain size increased, which led to improvement in the Mn4+ ion concentration and the GBs connectivity in the LCSMO:Agx polycrystalline ceramics.
1. Introduction
Mixed valent perovskite manganite with RE1−xAExMnO3, where RE and AE represent rare earth ions (La3+, Ce3+, Pr3+, Sm3+, Nd3+, etc.) and divalent alkaline earth ions (Ca2+, Sr2+, Ba2+, etc.), respectively, have been studied extensively for understanding and applying their unique electrical and magnetic properties and the colossal magnetoresistance (CMR) effect.1–7 In particular, the perovskite manganite has the metal-insulator transition (MI) features and magnetic phase transition from ferromagnetic metallic (FM) to paramagnetic insulating (PI) phase near the Curie temperature (Tc). It is well known that this phenomenon can be clarified by the double-exchange (DE) mechanism,8,9 phase separation,10,11 grain boundaries (GBs) effect12,13 and Jahn–Teller (JT) distortion.14,15 Hence, these mechanisms can be beneficial to understand the magnetic and electrical properties of the perovskite manganese oxides.Several studies have found that modulated amounts of Ag doping can increase the magnetoresistance (MR) and temperature coefficient of resistivity (TCR) of the perovskite manganese oxides, which can be used for infrared radiation and magnetic devices (uncooled magnetic sensors).16–18 It is known that the CMR effect of manganite under strong magnetic fields undoubtedly limits its practical applications in the fields of electrical and magnetic materials and devices.19–22 Therefore, the recent studies have focused on the ways to obtain large MR and TCR values at low-intensity magnetic fields to fulfill practical and technical applications. Efforts have been made to induce MR enhancements by various Ag doping under an applied magnetic field of 1 T or less.23,24 However, the La1−x(CaSr)xMnO3 materials with x = 0.2 have been rarely investigated in spite of their interesting physical properties under low magnetic fields.11
In addition, surface morphology, particle sizes, chemical homogeneity and microstructure are affected by the preparation methods,5,25,26 which play an important role in the performance of the manganite materials and devices (the Tc, TMI and CMR values). Hence, in this study, La0.8(Ca0.12Sr0.08)MnO3:mol%Agx (LCSMO:Agx, x = 0, 0.1, 0.2, 0.3 and 0.4) ceramics were fabricated by the sol–gel technique. This method was a quick and easy approach to achieve uniform composition, and the sample also had high purity and homogeneity. The results showed that Ag doping in low-intensity magnetic fields can effectively improve the electrical and magnetic properties of LCSMO:Agx ceramics, resulting in greater TCR and MR values.
2. Materials and methods
LCSMO:Agx ceramics were prepared by using the two-step approach. In the first step, the powder samples were prepared by the sol–gel technique. The solution composed of La(NO3)3·nH2O, Mn(NO3)2 aqueous solution (50% by mass), Sr(NO3)2 and Ca(NO3)2·4H2O was mixed in deionized water by continuous stirring. The ratio of La, Ca, Sr and Mn cations was 0.8![[thin space (1/6-em)]](https://www.rsc.org/images/entities/char_2009.gif) :0.12:0.08:1. Citric acid was used as the complexing agent and ethylene glycol was used as the polymerization agent in the mixed solution. Under magnetic stirring, the mixture was continuously heated until a brown gel was formed. Then, the gel was thoroughly dehydrated in an oven at 120 °C for 24 h. In an agate mortar, the achieved powder precursor was ground and then pre-burned in a calciner at 500 °C for 10 h. In the second step, Ag2O was added to the pre-calcined powder for mixing in molar ratio (mol%, 0–0.4). The mixed powder was completely ground into a fine powder.17 Then, the powder was pressed into a disk by a tablet machine by applying 16 MPa pressure. The pellets were sintered at 1450 °C under flowing oxygen for 12 h in high-purity Al2O3 crucibles.27,28
:0.12:0.08:1. Citric acid was used as the complexing agent and ethylene glycol was used as the polymerization agent in the mixed solution. Under magnetic stirring, the mixture was continuously heated until a brown gel was formed. Then, the gel was thoroughly dehydrated in an oven at 120 °C for 24 h. In an agate mortar, the achieved powder precursor was ground and then pre-burned in a calciner at 500 °C for 10 h. In the second step, Ag2O was added to the pre-calcined powder for mixing in molar ratio (mol%, 0–0.4). The mixed powder was completely ground into a fine powder.17 Then, the powder was pressed into a disk by a tablet machine by applying 16 MPa pressure. The pellets were sintered at 1450 °C under flowing oxygen for 12 h in high-purity Al2O3 crucibles.27,28
The crystal structure of LCSMO:Agx ceramics were characterized by X-ray powder diffraction (XRD, Ultima IV). A scanning electron microscope (SEM, SU8010) was used for analyzing the surface morphology and microstructures of the samples. The resistance–temperature and magnetization–temperature profile of the samples were measured by using the standard four-probe method in the temperature range from 100 K to 330 K and under an applied external magnetic field of 1 T with Keithley instruments.
3. Results and discussion
Fig. 1(a) displays the XRD patterns of the LCSMO:Agx polycrystalline ceramics, and the inset graph shows the enlarged view of the (200) and (121) peaks in the 2θ range of 31–34°. Clearly, it can be seen that LCSMO:Agx ceramics show one single phase without any impurity peaks. The samples revealed a typical perovskite orthorhombic structure with space group of Pnma. In addition, no diffraction peaks of Ag were detected in all the samples. Since the process sintering temperature (1450 °C) was much higher than the melting point of Ag (962 °C), the content of Ag reduced to a certain extent beyond the detection range of the XRD instrument.17,29 Moreover, some Ag was detected in the silver ion state, where the Ag replaced the A sites (Ca2+, La3+or Sr2+).29 Therefore, the actual amount of silver in the sample was much lower than that used in Ag doping (x), and the silver diffraction peak was extremely difficult to detect. With the increase in Ag addition, the (200) and (121) peaks of LCSMO:Agx samples deviated, which explains that the Ag-doping leads to changes in lattice, as displayed in the inset of Fig. 1(a).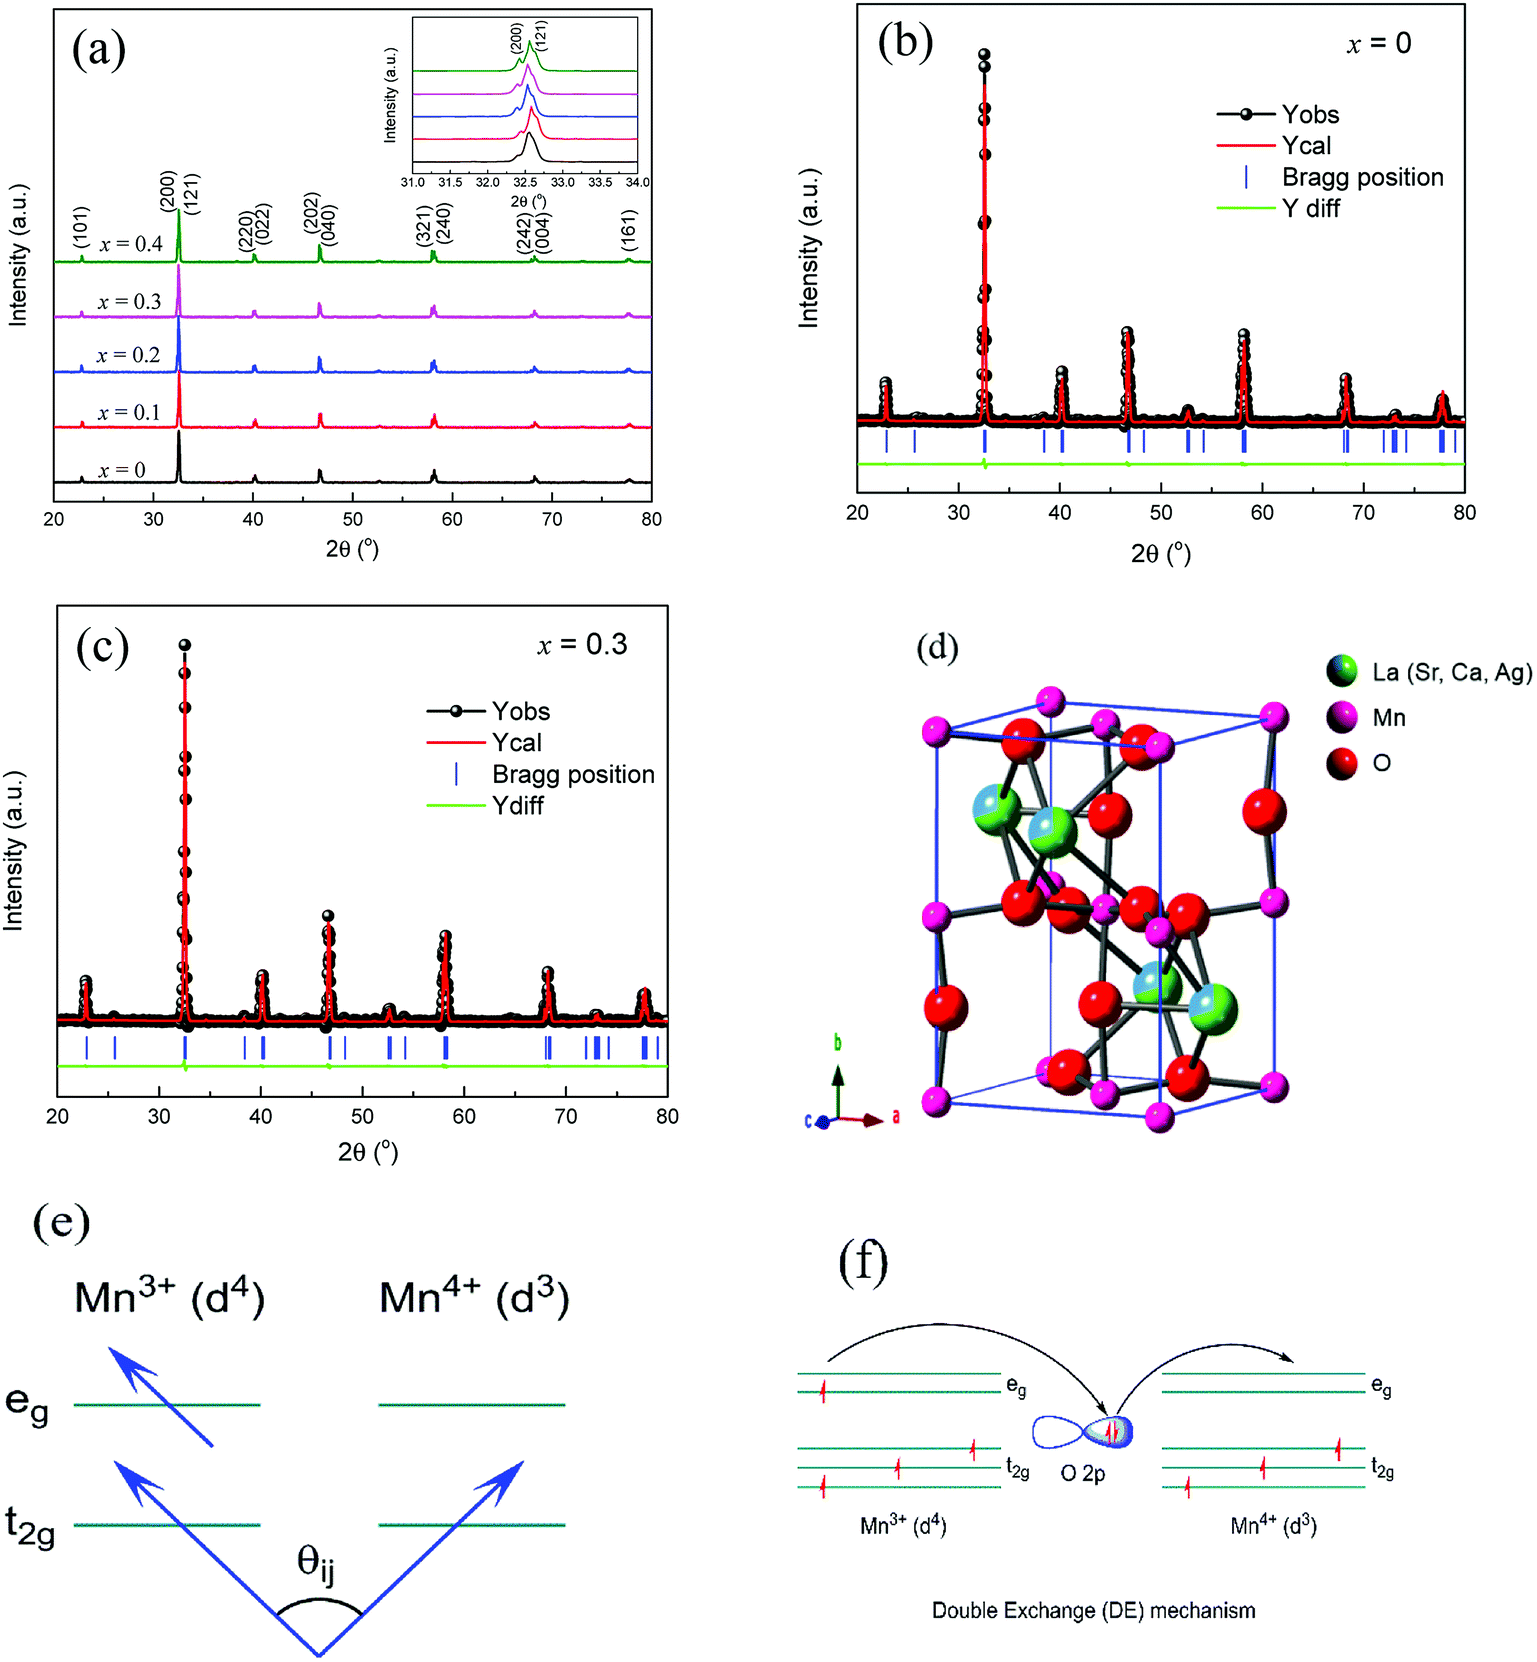 | ||
| Fig. 1 (a) X-ray diffraction patterns of LCSMO:Agx polycrystalline ceramics. (b) and (c) Rietveld refinement plots of a typical LCSMO:Agx with x = 0 and 0.3, respectively. (d) A typical perovskite orthorhombic structure with space group of Pnma for LCSMO:Agx ceramics. (e) The spin angle between adjacent Mn ions. (f) Sketch of electron transition. | ||
Fig. 1(b) and (c) illustrate the Rietveld XRD patterns of the samples with x = 0 and x = 0.3. The Rietveld analysis results can be seen in Table 1. Clearly, the Rietveld spectrum diffraction peak parameters (Re, Rp, Rb, and χ) further certify the single-phase (Pnma space group) for LCSMO:Agx ceramics, as shown in Table 1 and Fig. 1(d). With the increase in the Ag content (x ≤ 0.2) in the parent compound LCSMO, the lattice constants (a, b, c, and V) and the A-site cationic radius (〈rA〉) increased. Clearly, the doped Ag ions entered into the LCSMO matrix and partially replaced the A sites because the radius of Ag+ (1.28 Å) is similar to that of La3+ (1.16 Å), Ca2+ (1.12 Å) and Sr2+ (1.26 Å). However, this substitution was limited, resulting in a constant crystal structure of the sample. As the amount of Ag doping further increased, the lattice constant decreased at x = 0.3. The possible reason is the precipitation of metallic silver on the surface of the samples. Furthermore, a reduction in Mn3+(0.65 Å) ion content and an increase in the content of Mn4+(0.53 Å) with a smaller radius was observed.30 The introduction of Ag in the A sites imply a partial conversion of Mn3+ to Mn4+ ions, as shown in Fig. 1(f). The increase in tetravalent Mn content led to a decrease in the average size of the A-site cationic radius, and in turn, resulted in the reduction in the lattice constant. The change in cell volume is shown in Table 1.
| x (Ag mol%) | 0 | 0.1 | 0.2 | 0.3 | 0.4 | |
|---|---|---|---|---|---|---|
| Space group | Pnma | Pnma | Pnma | Pnma | Pnma | |
| Lattice constant (Å) | a | 5.4791 | 5.4812 | 5.4812 | 5.4792 | 5.4802 |
| b | 7.7490 | 7.7518 | 7.7518 | 7.7494 | 7.7511 | |
| c | 5.5096 | 5.5120 | 5.5121 | 5.5097 | 5.5112 | |
| Cell volume (Å3) | V | 233.9241 | 234.2003 | 234.2046 | 233.9447 | 234.1024 |
| Bond distance (Å) | Mn–Mn | 3.8851 | 3.8759 | 3.8759 | 3.8747 | 3.8755 |
| Mn–O1 | 1.9633 | 1.9640 | 1.9640 | 1.9634 | 1.9638 | |
| Mn–O2 | 1.9562/1.9613 | 1.9570/1.9620 | 1.9570/1.9620 | 1.9562/1.9612 | 1.9566/1.9617 | |
| Bond angles (o) | Mn–O1–Mn | 161.3054 | 161.3041 | 161.3037 | 161.3060 | 161.3051 |
| Mn–O2–Mn | 165.2600 | 165.2606 | 165.2607 | 165.2596 | 165.2597 | |
| Fit index (%) | Re | 5.97 | 5.97 | 5.96 | 6.03 | 6.1 |
| Rb | 6.14 | 6.59 | 5.69 | 6.49 | 7.3 | |
| Rp | 4.07 | 5.19 | 4.22 | 4.17 | 4.8 | |
| χ | 1.05 | 1.21 | 0.91 | 1.16 | 1.4 | |
The increase in 〈rA〉 changed the tolerance factor (τ), which is defined by τ = (rA + rO)/(rMn + rO). Fig. 1(e) presents the spin angle between adjacent Mn ions. The lattice constant also changed with the increase in x, and this change in τ led to variations in Mn–O bond distance (dMn–O1 and dMn–O2) and Mn–O–Mn bond angles (θMn–O1–Mn and θMn–O2–Mn). The change in bond angle and bond distance affected the DE. This could be the reason why the increase in x significantly improved the DE interaction between Mn3+–O2−–Mn4+ ions. However, the Ag substitution was limited, resulting in less tolerance factor (τ) changes. Therefore, the change in Mn–O–Mn bond angle was not large enough to cause changes in space groups.
Fig. 2(a–d) shows the SEM images of the LCSMO:Agx ceramics. The grain sizes increased first and then decreased as the amount of added Ag increased; the grain sizes of all the samples are clearly displayed in the figure. The change in grain sizes of the samples can be beneficial to increase the ceramic density and enhance the connectivity of GBs and the electrical properties of the doped system.31 The surface morphology of the x = 0.3 sample was more homogeneous than that of the other samples.
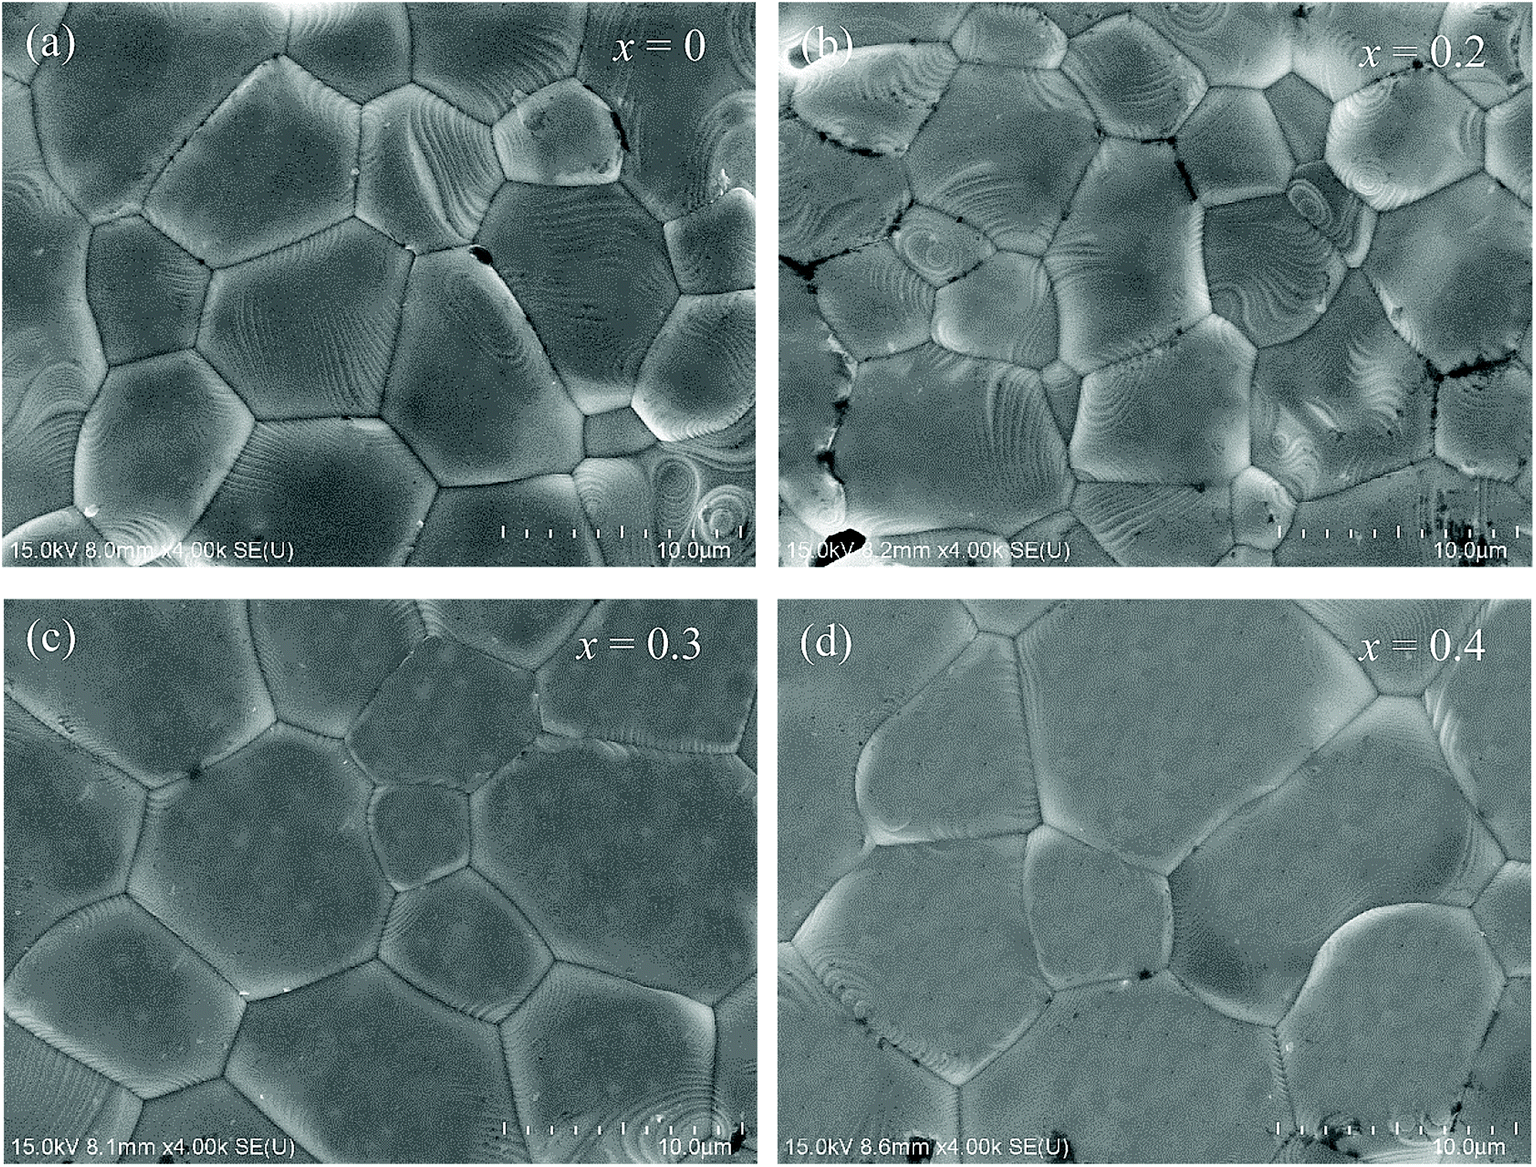 | ||
| Fig. 2 SEM images of the surface morphology of LCSMO:Agx (x = 0–0.4) ceramics. | ||
The grain sizes of LCSMO:Agx ceramics were analyzed with Nona Measurer 1.2 software to better understand the morphology of the sample. Fig. 3(a–d) exhibits the statistic results of the grain sizes. With the increase in Ag doping amount, the grain sizes changed from 11.1 μm to 20.0 μm. It is reported in the literature that the grain sizes are affected by various factors such as doping conditions, sintering temperature and preparation methods.25 Thus, in order to increase the grain sizes of the LCSMO:Agx samples, it was very crucial to control the doping addition and the technological parameters for preparation. As the grain sizes increased, the GBs of the samples decreased, reducing the resistivity of the samples.
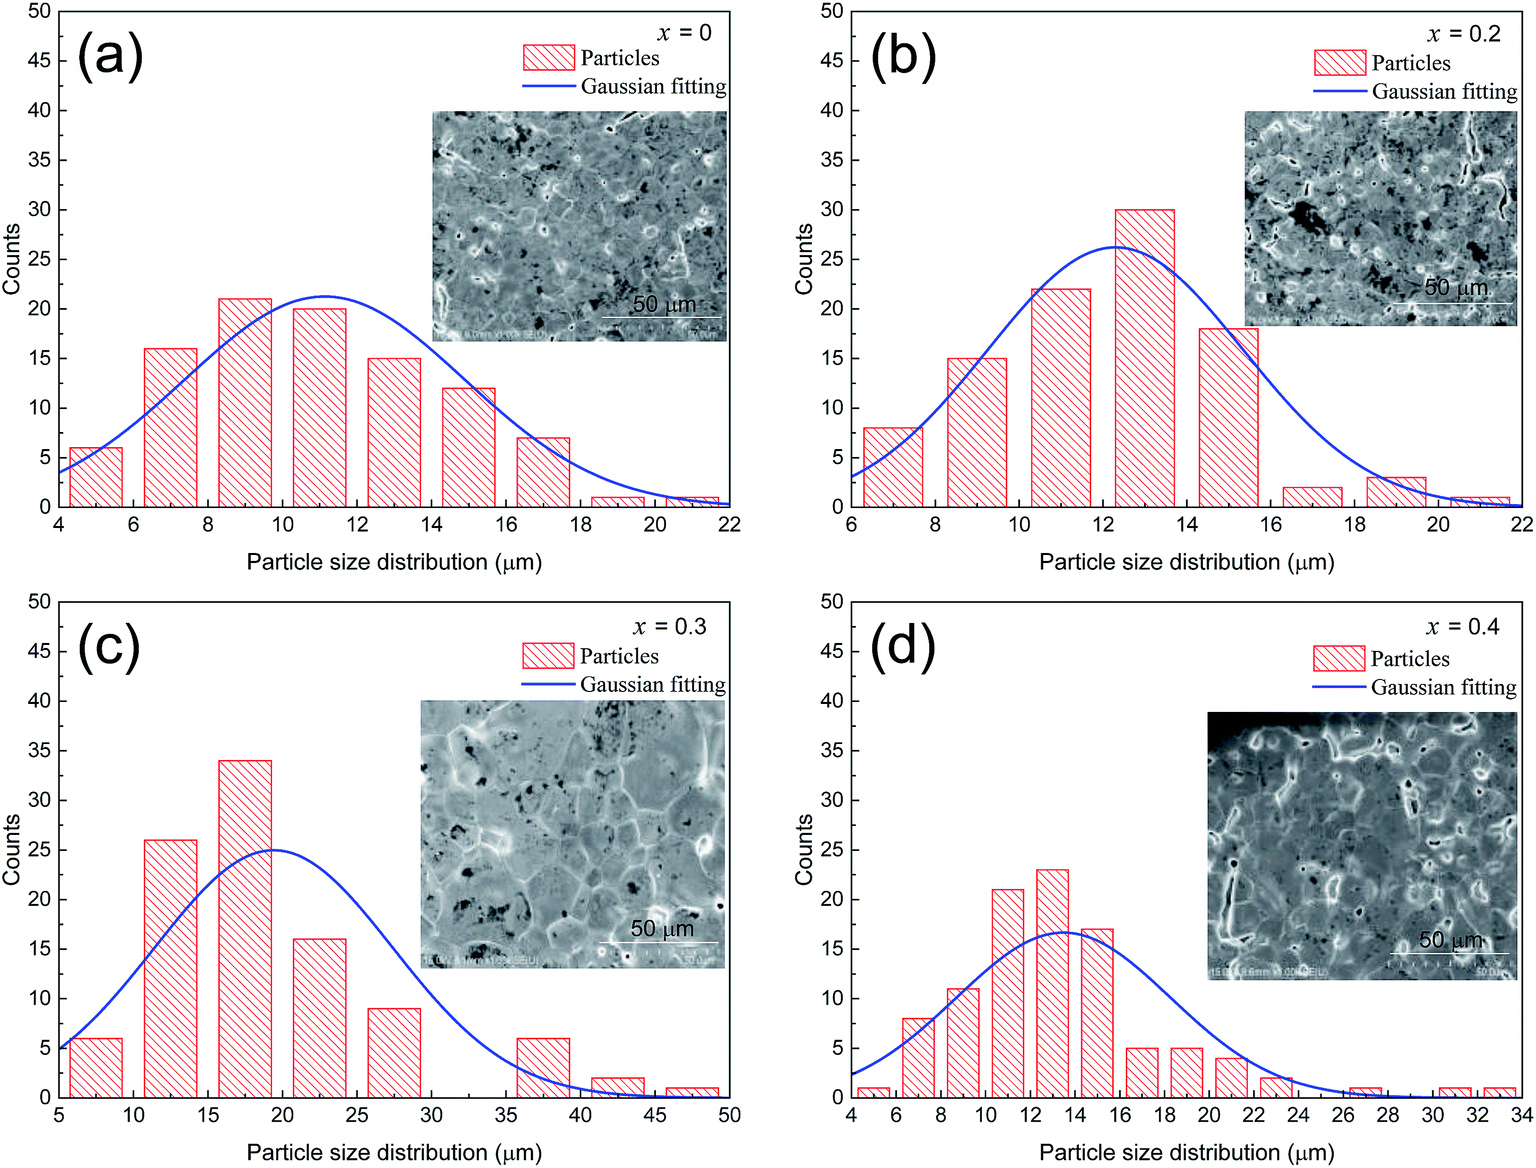 | ||
| Fig. 3 Particle size distribution chart of LCSMO:Agx (x = 0–0.4) ceramics. | ||
Fig. 4 clearly presents the temperature dependence of resistivity (ρ) of LCSMO:Agx polycrystalline ceramics in the temperature range from 100 K to 330 K. With the increase in Ag addition, the resistivity of all the samples showed similar trends and the conductivity increased significantly. As the temperature increases, it can be seen that all samples display transition from FM to PI at TMI. The aggregation of metallic Ag in GBs improved the microstructure of the grain surface, thus enhancing the connectivity of GBs and improving the conductivity of LCSMO:Agx ceramics. Therefore, the resistivity of the samples decreased with Ag addition. In addition, the substitution of silver ions in place of A-site ions changed the Mn–O bond distance and Mn–O–Mn bond angles. These changes enhanced the DE interaction and JT effect.
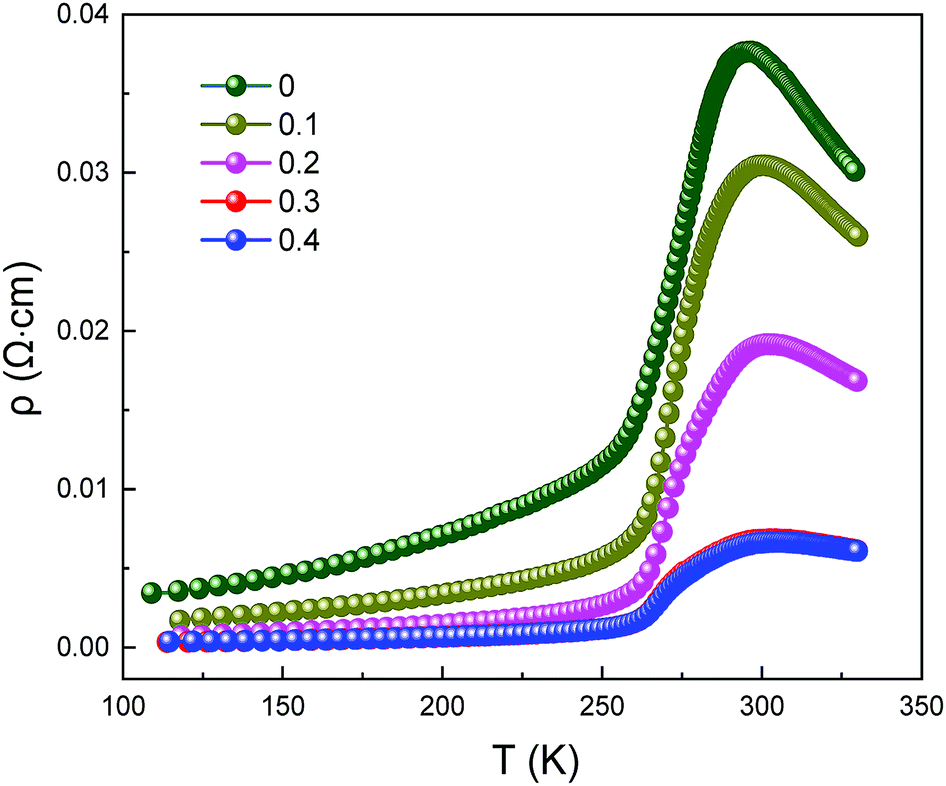 | ||
| Fig. 4 Resistivity as a function of temperature for LCSMO:Agx (x = 0–0.4) ceramics. | ||
Fig. 5 reveals the curves presenting the TCR of LCSMO:Agx ceramics. The TCR is defined by the relationship: 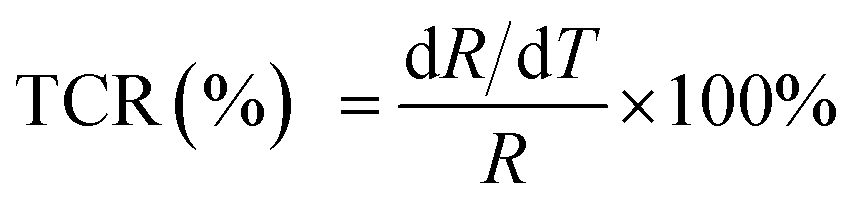 (R and T are the resistance and temperature, respectively). The Ag doping caused substitution of the A-site ion by Ag+, significantly affecting the electronic transport properties of the samples. With the increase in x, the TCR increased first and then decreased. With the increase in the Ag content (x ≤ 0.3), the resistivity of the sample significantly reduced, but the DE enhancement was not significant. At this time, the influence of resistivity on the TCR should play a dominant role. Therefore, the value of TCR increased. With the Ag doping at x = 0.3, the maximum TCR reached 16.22 K−1. As the content of Ag doping further increased, the value of TCR decreased. The possible reason for this is that the resistivity hardly changes. The substitution of silver was limited, and the tolerance factor did not change, resulting in the enhancement of the Mn–O double exchange effect as the Mn4+ ion content increased. At this point, the influence of DE enhancement on TCR dominated, and resistivity slightly affected TCR.
 | ||
| Fig. 5 TCR as a function of temperature for LCSMO:Agx samples. | ||
These materials have different conduction mechanisms for resistivity in different temperature ranges.32–34 Therefore, in order to better understand the conductive behavior of LCSMO:Agx ceramics, in this study, we analyzed the three temperature ranges and the ρ–T data were fitted, including the metallic regime (T < TMI), insulating regime (T > TMI), and all temperature zones (100 ≤ T ≤ 330 K). The following sections discuss these three temperature conditions in detail.
Fig. 6(a) represents that at T < TMI range, all samples exhibited a metallic behavior. In order to study the relative intensities of the dissimilar scattering mechanisms produced in the metallic region, the ρ–T data were fitted using the following empirical equation:35
| ρFM (T) = ρ0 + ρ2T2 + ρ4.5T4.5 | (1) |
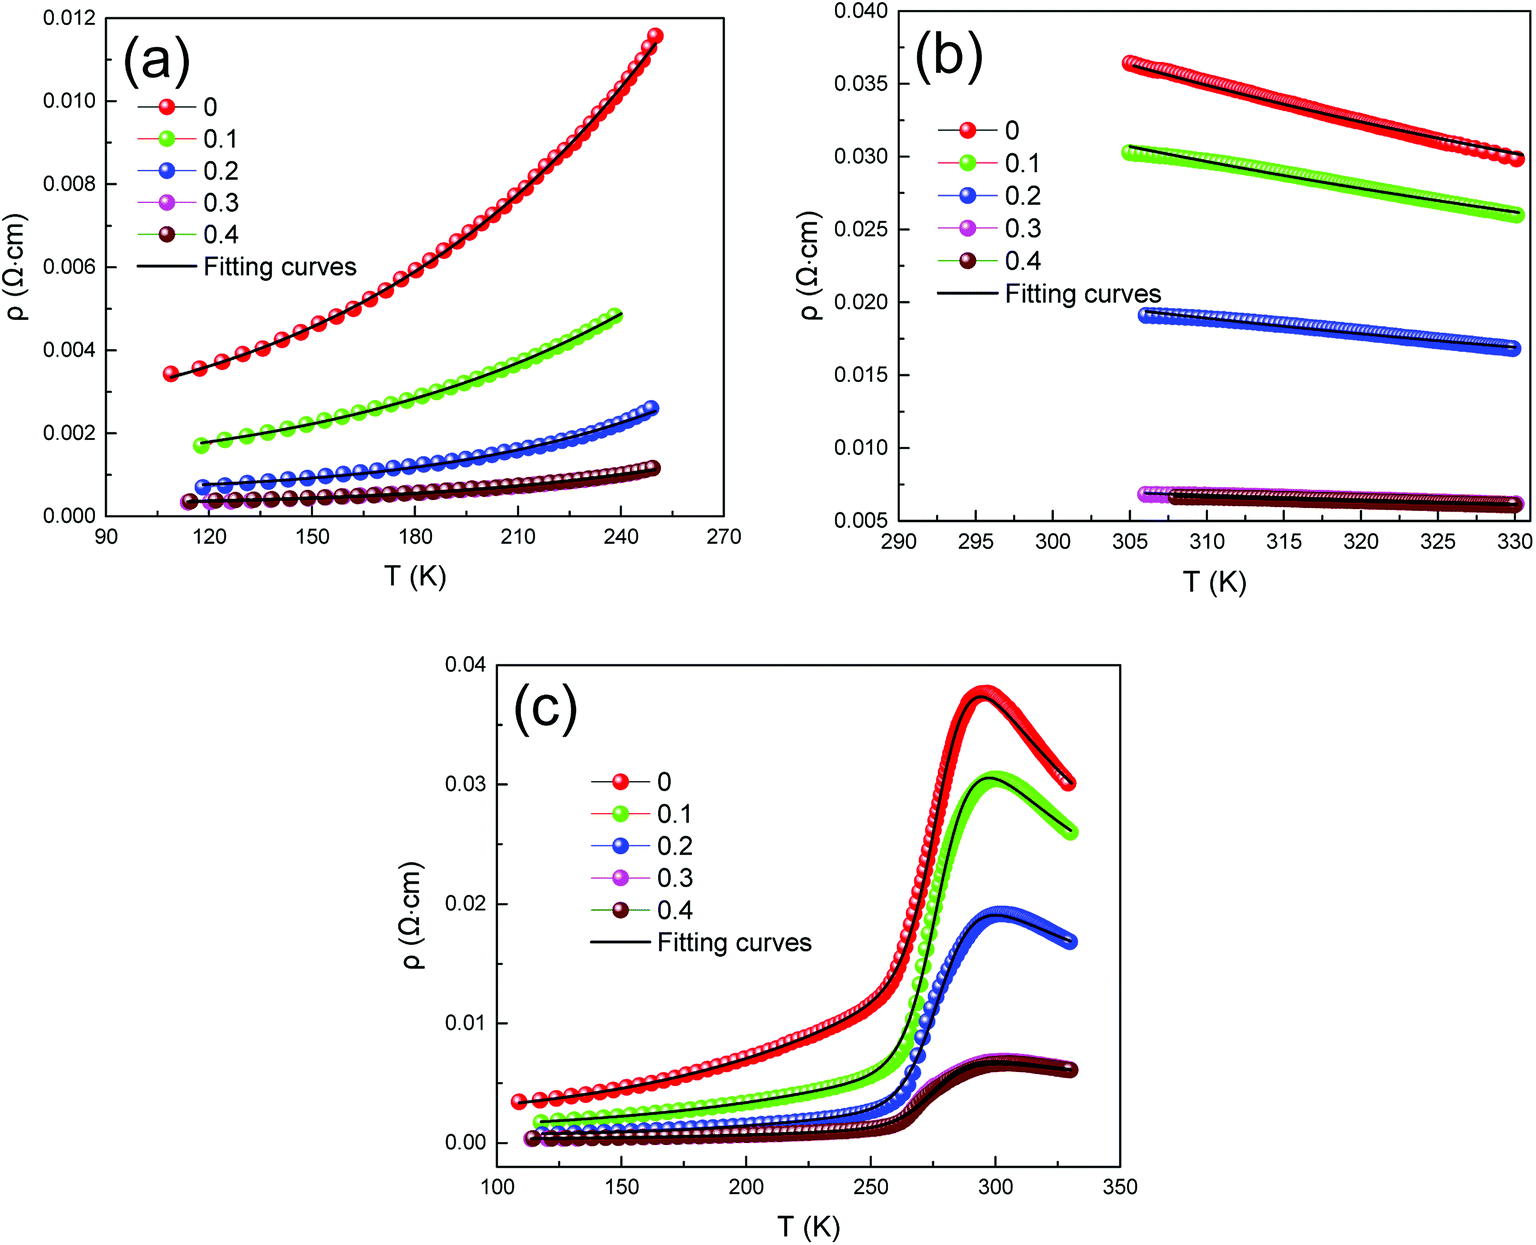 | ||
| Fig. 6 Fitted resistivity curves for different temperature ranges, (a). T < TMI, (b) T > TMI, (c) all temperature zones (100 K ≤ T ≤ 330 K). | ||
| x (Ag mol%) | Applied magnetic field (T) | ρ0 × 10−4 (Ω cm) | ρ2 × 10⁻⁸ (Ω cm K−2) | ρ4.5 × 10⁻¹⁴ (Ω cm K−4.5) | ρa × 10−6 (Ω cm) | Ea/KB (K) | Tmodc (K) | R2 |
|---|---|---|---|---|---|---|---|---|
| 0 | 0 | 26.60 | 4.45 | 6.70 | 1.88 | 1219.96 | 284.4 | 0.999 |
| 1 | 20.20 | 5.86 | 5.46 | 3.12 | 1049.11 | 286.4 | 0.999 | |
| 0.1 | 0 | 11.20 | 1.99 | 3.18 | 3.40 | 974.40 | 280.1 | 0.998 |
| 1 | 10.30 | 1.84 | 3.12 | 6.28 | 764.94 | 282.9 | 0.999 | |
| 0.2 | 0 | 4.23 | 0.31 | 2.26 | 2.61 | 910.44 | 279.8 | 0.998 |
| 1 | 4.05 | 0.90 | 1.63 | 3.42 | 710.21 | 283.9 | 0.999 | |
| 0.3 | 0 | 2.15 | 0.09 | 1.09 | 1.43 | 779.19 | 278.0 | 0.997 |
| 1 | 2.08 | 0.22 | 0.84 | 1.79 | 695.30 | 282.3 | 0.998 | |
| 0.4 | 0 | 2.17 | 0.65 | 0.55 | 1.35 | 751.32 | 277.5 | 0.997 |
| 1 | 1.81 | 0.52 | 0.66 | 1.74 | 656.31 | 281.8 | 0.998 |
At high temperatures (T > TMI), the temperature-dependent electrical resistivity can be analyzed by means of the well-known adiabatic small-polaron hopping model,36 which was fitted using eqn (2).
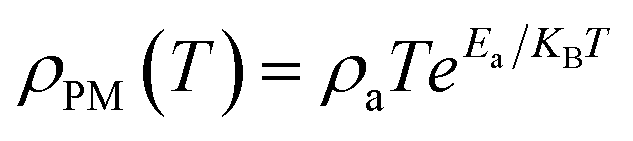 | (2) |
To study the electrical transport properties over all the temperature zones, particularly T ≈ TMI, we analyzed the resistivity data in the competition mechanism by the phenomenological percolation model.37 In the T ≈ TMI zone, FM and PI coexist and compete with each other. The model takes into account the fact that the FM and PI regions are electrically coupled in series,34,38 and also accounts for the contributions caused by the terms ρFM (T) and ρPM (T). Therefore, the combined equation36 is given by eqn (3).
| ρ(T) = fρFM(T) + (1 − f)ρPI(T) | (3) |
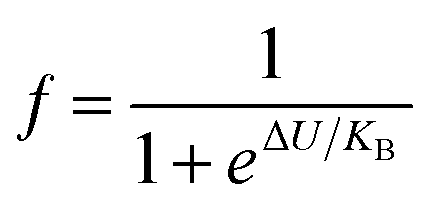 and 1 − f are the volume concentration of FM region and PI region, respectively. In this equation, ρFM (T) and ρPI (T) come from eqn (1) and (2), respectively.
  is the energy difference between FM and PI phases. Tmodc denotes the temperature was used in the model near to TMI where resistivity has a maximum value. For all the presently studied samples, the resistivity data were fitted over all the temperature zones by using eqn (3), and the fitting parameters are given in Table 2. The fitting graphs are shown in Fig. 6(c), and it is clearly seen that the experimental data were in excellent agreement with the theoretical model and the R2 mean was close to 1 for all samples. It can be seen from the table results that U0 increased with the increase in Ag doping amount. This indicated that all the samples became more conductive, which was in consistent with the resistivity measurements.
The influence of magnetic field and CMR on the magnetic transport properties of the samples was studied. Fig. 7(a–e) presents the variation in ρ–T and fitted curves from 100 K to 330 K of LCSMO:Agx ceramics measured under 0 T and 1 T magnetic field. Here, MR was defined as MR (%) = [ρ(0,T) − ρ(H,T)]/ρ(0,T) × 100%, where ρ(0,T) and ρ(H,T) are the resistivity at 0 T and 1 T magnetic field, respectively. As the amount x increased, the MR increased first and then decreased. When the Ag doping was x = 0.3, the maximum MR was 42.07%. However, the MR value decreased at x = 0.4. This phenomenon was due to the diamagnetic properties of metallic Ag, which may increase the magnetic disorder. This shows that the continuous increase in Ag content may be unfavorable for the MR value of the samples.
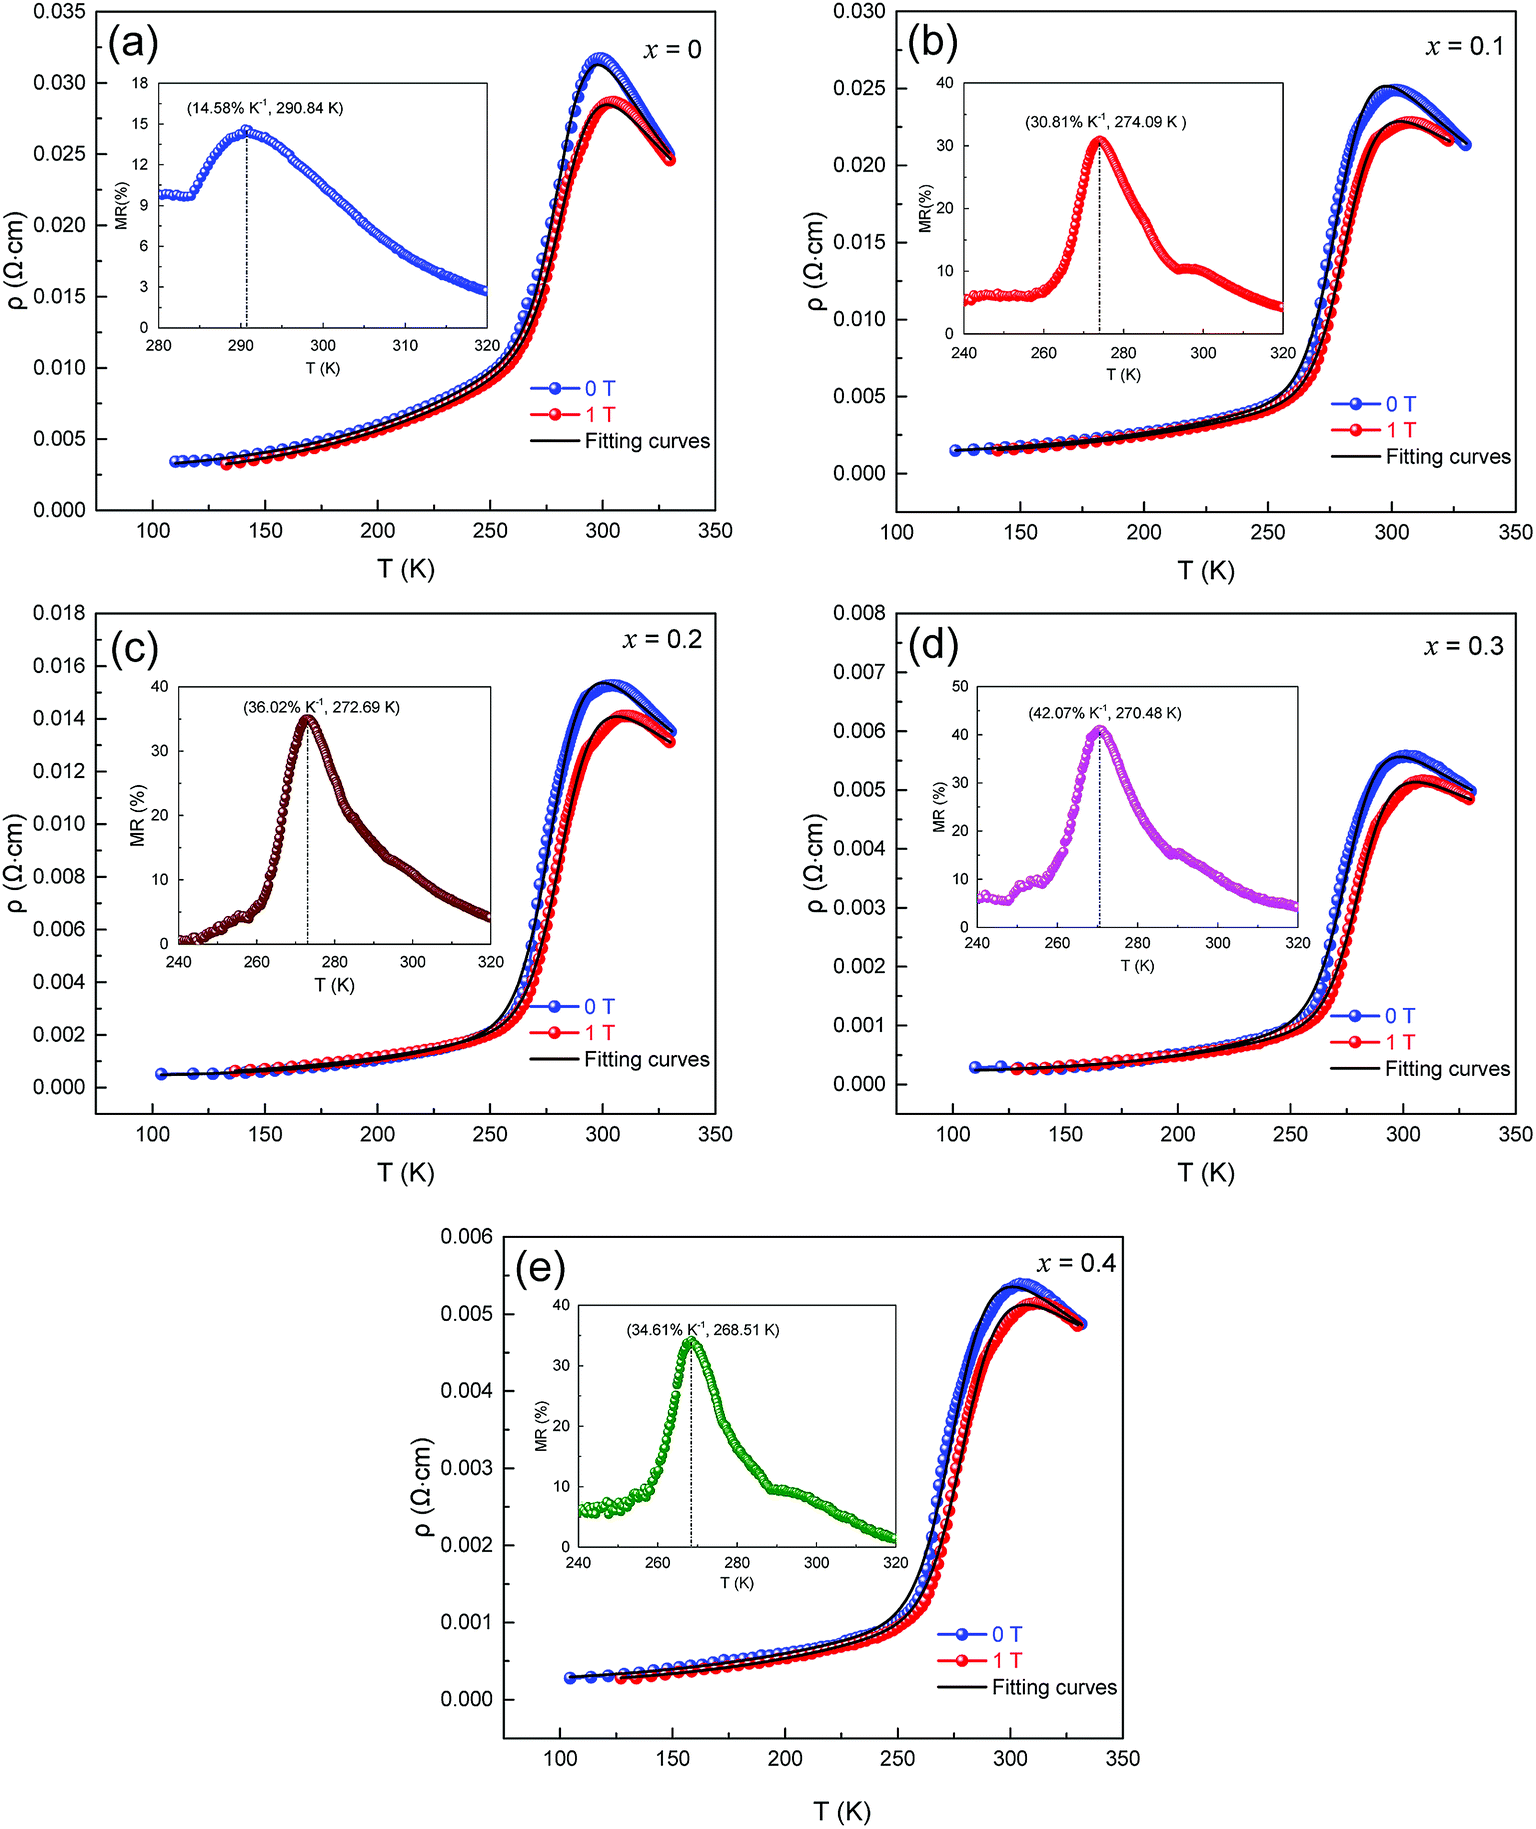 | ||
| Fig. 7 Resistivity as a function of temperature and fitting curves for LCSMO:Agx. samples at 0 T and 1 T magnetic fields, the inset graph shows the MR-T image of LCSMO:Agx. | ||
Fig. 7 (a–e) display that when subjected to a 1 T magnetic field, the resistivity drops and the TMI value moves toward higher temperatures. This change may be due to the increase in the tunneling of conducting electrons under the influence of a magnetic field, which is related to the direction of the spin of the electron and the extra magnetic field. Magnetic fields can provide extra energy to the sample, making it easier for free electrons to migrate. The activation energy Ea (obtained from Table 2) was reduced in the sample under 1 T extra magnetic field. This phenomenon may be caused by the spin alignment with the magnetic field and the reduction in charge localization while the energy of electron jumping was less. It can be further explained that the decrease in Ea was due to the action of a magnetic field, which was the main cause of the decrease in resistivity.
Fig. 8 (a–e) represent the fitted data of ρ–T of all the samples under 0 T and 1 T magnetic fields. The curve of f and 1 − f vs. temperature was obtained.
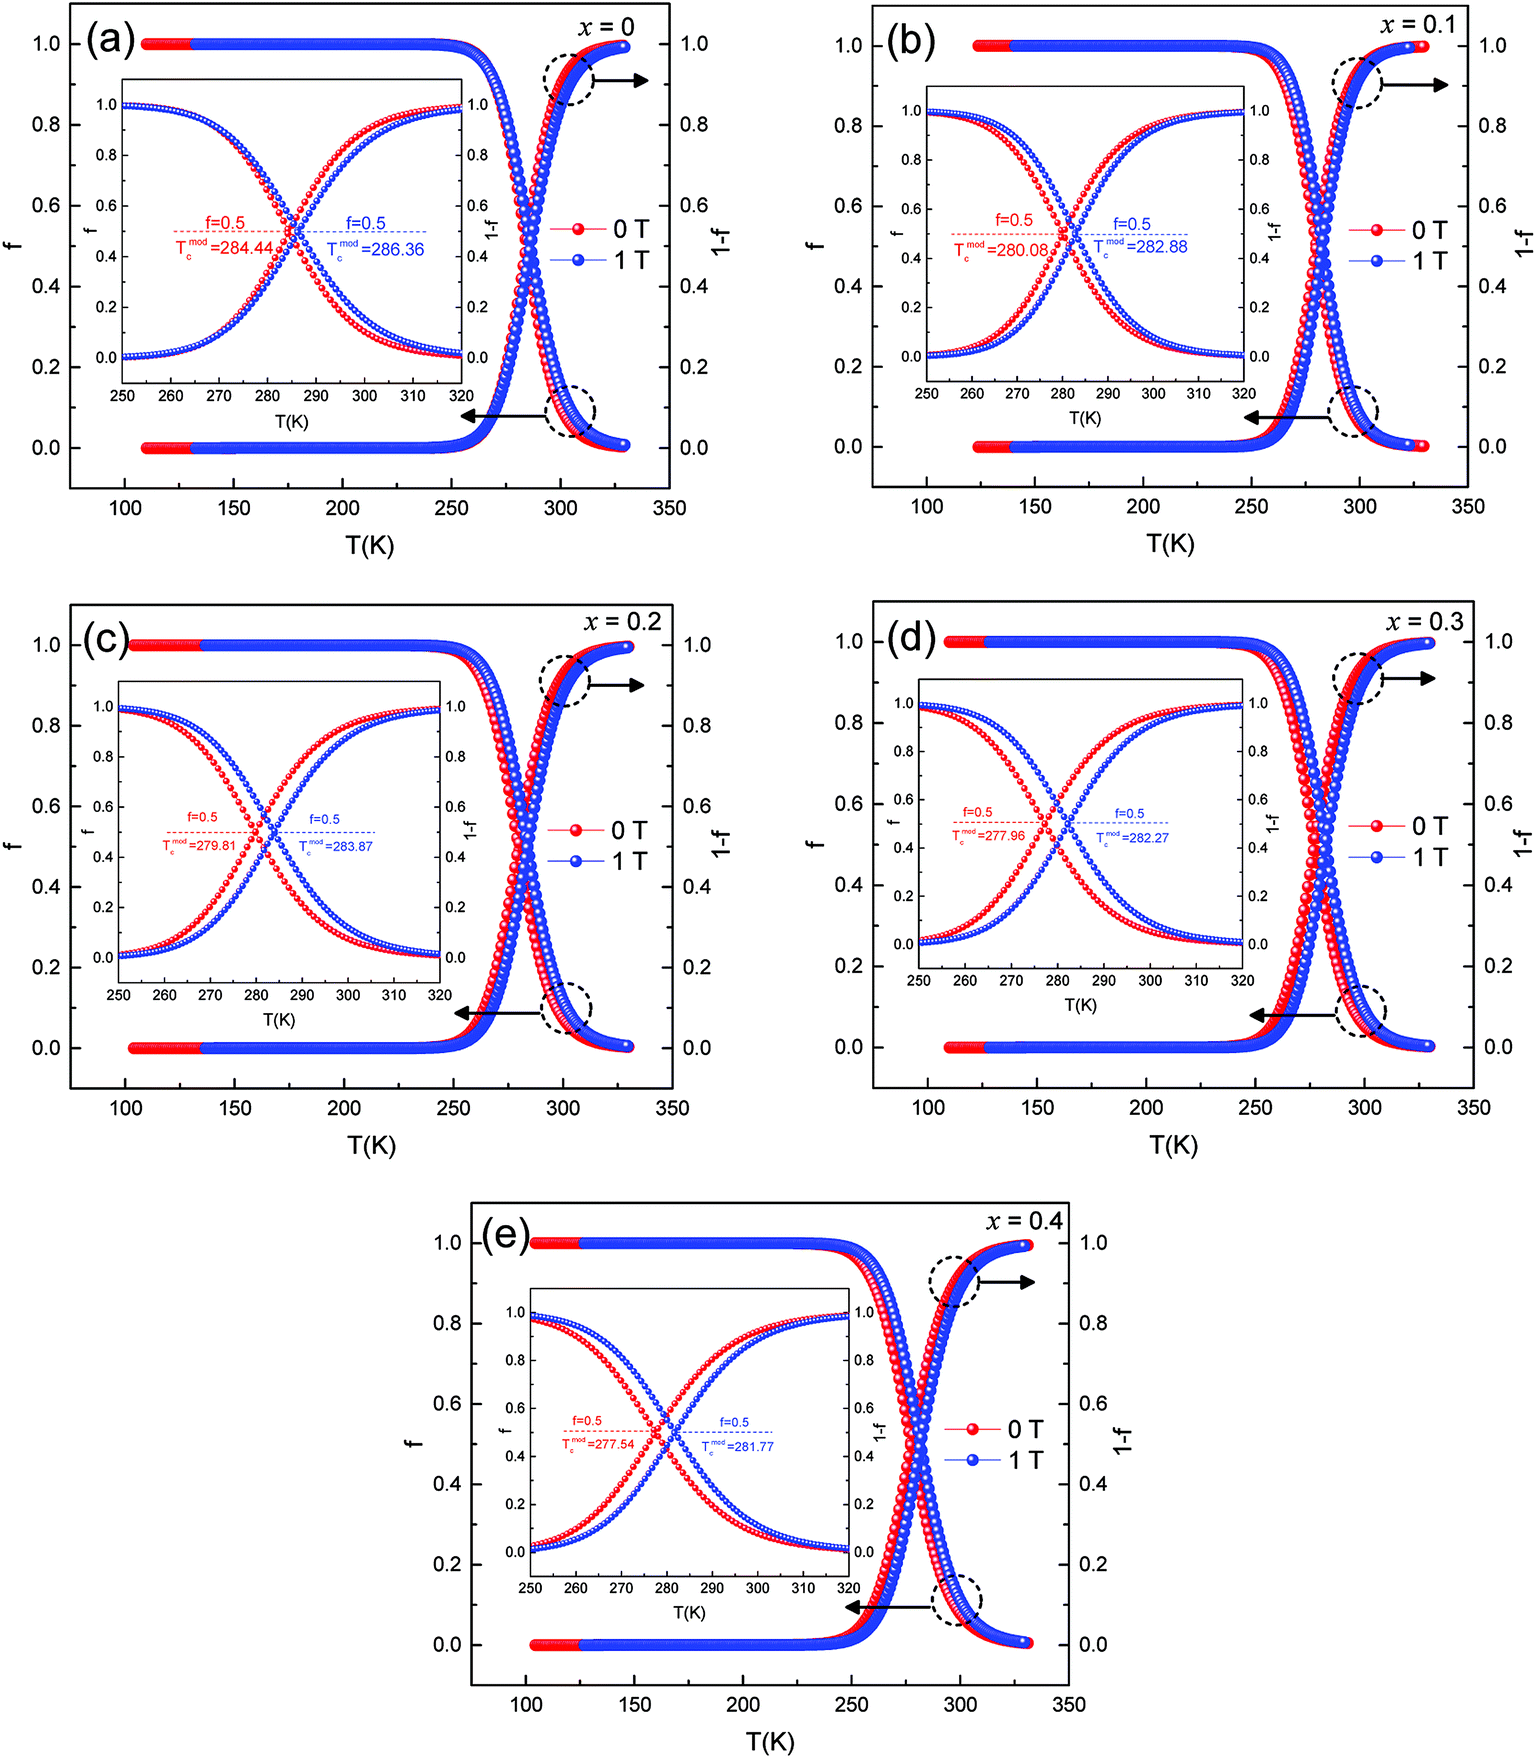 | ||
| Fig. 8 Temperature dependence of ferromagnetic and paramagnetic phase volume. fraction at 0 T and 1 T. | ||
From eqn (3), it can be inferred that
(1) f = 0 for T ≫ Tmodc, f = 1 for T ≪ Tmodc and f = fc = 0.5 at T = Tmodc
(2) (1 − f) = 1 for T ≫ Tmodc, (1 − f) = 0 for T ≪ Tmodc and (1 − f) = fc = 0.5 at T = Tmodc
where fc is the percolation threshold.
When the sample was at low temperature (T < Tmodc), f was close to 1 and the sample remained semiconducting. The volume fraction of the ferromagnetic phase was near to 0 at high temperature (T > Tmodc), and the samples became metallic. With the increase in Ag doping, Tmodc showed a downward trend. Since the samples were affected by an external magnetic field, the FM phase changed in volume fraction. It was easier for a portion of the PI phase to transition to the FM phase, which could cause an increase in resistivity, thus enhancing the effect of the CMR.28 This behavior was observed in other literature reports and was consistent with the magnetic transitions that were common in magnetization measurements, thus suggesting that the f involved here had a similar physical significance as magnetization decreased.
4. Conclusions
La0.8(Ca0.12Sr0.08)MnO3:mol%Agx polycrystalline ceramics were synthesized by using the conventional sol–gel reaction technique. The structure, surface morphologies, and electrical and magnetic transport performance for all samples were systematically studied in the present study. XRD analysis showed that all the samples had a single phase with orthorhombic structure. As x increased, the resistivity of the samples decreased sharply, and TMI and conductive properties increased significantly. Simultaneously, with the increase in amount of x doping, the TCR and MR increased first and then decreased. For the LCSMO:Agx sample with x = 0.3, the optimal values of TCR and MR reached 16.22% K−1 and 42.07% K−1, respectively. The main diffraction peak (121) shifted to a low angle, indicating the replacement of A sites by Ag. In TMI, analyses of the FM region, T < TMI displays that the electrical transport was mainly controlled by the electron–electron, electron–phonon, and electron–magnon scattering processes. In addition, analyses of the PI region indicated that the adiabatic small-polaron hopping model was suitable for use in T > TMI. Finally, the entire temperature region data were fitted and analyzed by using the phenomenological equation called the percolation model, which explained the FM and PI phase separation mechanism.Conflicts of interest
There are no conflicts to declare.Acknowledgements
This study was supported by the Nature Science Foundation Committee (Grant No. 11674135), the Innovation Training Program for College Students (Grant No. 20180179), and the Analysis and Testing Foundation of Kunming University of Science and Technology (Grant No. 2018M20172230057).References
- J. B. Goodenough, J. Appl. Phys., 1997, 81, 5330–5335 CrossRef CAS.
- J. B. Goodenough, Aust. J. Phys., Astrophys. Suppl., 1999, 52, 155–186 CrossRef CAS.
- T. V. Ramakrishnan, J. Phys.: Condens. Matter, 2007, 19, 125211 CrossRef.
- X. B. Yuan, Y. H. Liu, C. J. Wang and L. M. Mei, Int. J. Mod. Phys. B, 2005, 19, 4467–4473 CrossRef CAS.
- S. Zhao, X.-J. Yue and X. Liu, Ceram. Int., 2017, 43, 13240–13246 CrossRef CAS.
- S. Vadnala, P. Pal and S. Asthana, J. Mater. Sci.: Mater. Electron., 2016, 27, 6156–6165 CrossRef CAS.
- A.-M. Haghiri-Gosnet and J.-P. Renard, J. Phys. D: Appl. Phys., 2003, 36, R127–R150 CrossRef CAS.
- C. Zener, Phys. Rev., 1951, 81, 440–444 CrossRef CAS.
- C. Zener, Phys. Rev., 1951, 82, 403–405 CrossRef CAS.
- A. Moreo, S. Yunoki and E. Dagotto, Science, 1999, 283, 2034–2040 CrossRef CAS PubMed.
- E. Dagotto, T. Hotta and A. Moreo, Phys. Rep., 2001, 344, 1–153 CrossRef CAS.
- R. Mahesh, R. Mahendiran, A. K. Raychaudhuri and C. N. R. Rao, Appl. Phys. Lett., 1996, 68, 2291–2293 CrossRef CAS.
- R. Gross, L. Alff, B. Büchner, B. H. Freitag, C. Höfener, J. Klein, Y. Lu, W. Mader, J. B. Philipp and M. S. R. Rao, J. Magn. Magn. Mater., 2000, 211, 150–159 CrossRef CAS.
- K. I. Kugel and D. I. Khomskiĭ, Phys.-Usp., 1982, 25, 231–256 CrossRef.
- J. Jiang, S. Zhao, T. Sun, Q.-m. Chen and X. Liu, Ceram. Int., 2018, 44, 3915–3920 CrossRef CAS.
- R. Tripathi, V. P. S. Awana, H. Kishan and G. L. Bhalla, J. Magn. Magn. Mater., 2008, 320, L89–L92 CrossRef CAS.
- S. Zhao, X. Yue and X. Liu, Ceram. Int., 2017, 43, 4594–4598 CrossRef CAS.
- H. Hwang, S. W. Cheong, P. Radaelli, M. Marezio and B. Batlogg, Phys. Rev. Lett., 1995, 75, 914–917 CrossRef CAS PubMed.
- D. G. Li, Y. T. Mai, J. Xoing, Y. H. Xiong, Z. L. Liu and C. S. Xiong, J. Supercond. Novel Magn., 2012, 26, 719–723 CrossRef.
- H. Y. Hwang, S. W. Cheong, P. G. Radaelli, M. Marezio and B. Batlogg, Phys. Rev. Lett., 1995, 79, 914–917 CrossRef PubMed.
- D. Cao, Y. Zhang, W. Dong, J. Yang, W. Bai, Y. Chen, G. Wang, X. Dong and X. Tang, Ceram. Int., 2015, 41, S381–S386 CrossRef CAS.
- C. S. Xiong, L. G. Wei, Y. H. Xiong, J. Zhang, D. G. Li, Q. P. Huang, Y. D. Zhu and X. S. Li, J. Phys. D: Appl. Phys., 2007, 40, 1331–1334 CrossRef CAS.
- Z. H. Xiong, D. Wu, Z. V. Vardeny and J. Shi, Nature, 2004, 427, 821–824 CrossRef CAS PubMed.
- V. Dediu, M. Murgia, F. C. Matacotta, C. Taliani and S. Barbanera, Solid State Commun., 2002, 122, 181–184 CrossRef CAS.
- D. Li, Q. Chen, Z. Li, Y. Li, H. Zhang and Y. Zhang, Ceram. Int., 2018, 44, 3448–3453 CrossRef CAS.
- X. Yin, X. Liu, Y. Yan and Q. Chen, J. Sol-Gel Sci. Technol., 2014, 70, 361–365 CrossRef CAS.
- T. Sun, S. Zhao, F. Ji and X. Liu, Ceram. Int., 2018, 44, 2400–2406 CrossRef CAS.
- T. Sun, J. Jiang, Q. Chen and X. Liu, Ceram. Int., 2018, 44, 9865–9874 CrossRef CAS.
- X. Yue, Y. Zhan, X. Liu, G. Gu, Q. Wang and X. Yin, J. Low Temp. Phys., 2015, 180, 356–362 CrossRef CAS.
- S. Choura-Maatar, R. M’nassri, W. Cheikhrouhou-Koubaa, M. Koubaa, A. Cheikhrouhou and E. K. Hlil, RSC Adv., 2017, 7, 50347–50357 RSC.
- L. W. Lei, Z. Y. Fu, J. Y. Zhang and H. Wang, Mater. Sci. Eng., B, 2006, 128, 70–74 CrossRef CAS.
- S. P. Altintas, A. Amira, N. Mahamdioua, A. Varilci and C. Terzioglu, J. Alloys Compd., 2011, 509, 4510–4515 CrossRef CAS.
- J. Khelifi, A. Tozri, F. Issaoui, E. Dhahri and E. K. Hlil, Ceram. Int., 2014, 40, 1641–1649 CrossRef CAS.
- S. Das and T. K. Dey, Solid State Commun., 2005, 134, 837–842 CrossRef CAS.
- S. O. Manjunatha, A. Rao, T. Y. Lin, C. M. Chang and Y. K. Kuo, J. Alloys Compd., 2015, 619, 303–310 CrossRef CAS.
- S. Hcini, S. Zemni, A. Triki, H. Rahmouni, M. Boudard and M. Oumezzine, J. Supercond. Novel Magn., 2013, 26, 2181–2185 CrossRef CAS.
- S. O. Manjunatha, A. Rao, Subhashini and G. S. Okram, J. Alloys Compd., 2015, 640, 154–161 CrossRef CAS.
- G. Li, H. D. Zhou, S. J. Feng and X. J. Fan, J. Appl. Phys., 2002, 92, 1406–1410 CrossRef CAS.
| This journal is © The Royal Society of Chemistry 2019 |