DOI:
10.1039/C8RA08396G
(Paper)
RSC Adv., 2019,
9, 1782-1791
Polymer–silica hybrid self-healing nano/microcapsules with enhanced thermal and mechanical stability†
Received
10th October 2018
, Accepted 17th December 2018
First published on 15th January 2019
Abstract
In recent years, microencapsulation technology has drawn much attention due to its wide applications. Added to the coating as a dry powder, the microcapsules contain a liquid that can repair the film if released into the cracks. However, there is still a lack of synthesis strategies for microcapsules with excellent strength, solvent resistance and thermal stability. Herein, organic–inorganic hybrid nano/microcapsules loaded with isophorone diisocyanate (IPDI) were prepared via interfacial polymerization in Pickering emulsion. The diameter of the resultant capsules ranged from 468 nm to 1106 nm, and the thick shells were densely packed with silica nanoparticles. To evaluate the resistance properties of the nano/microcapsules, thermogravimetric analysis (TGA) tests showed that the capsules have a high initial evaporation temperature at about 340 °C; titration tests indicated that the capsules exhibited outstanding resistance to xylene and acetone. For capsules characterized by AFM, the compressive modulus could reach up to 16–19 GPa, which proved their excellent mechanical property. The morphology of the nanocapsules in different preparation periods was also studied, and it was found that the shell wall was closely packed with silica nanoparticles. The structure of the shell wall and the chemical reaction between organic and inorganic materials improved the hardness of the nano/microcapsules. Furthermore, the resultant capsules exhibited self-healing ability in an organic silicon resin coating.
1 Introduction
Microencapsulation is a novel technology of encapsulating solids, liquids or gases with film-forming materials to form micro-containers with core–shell structures.1 The development of microencapsulation can be traced back to the 1930s. After that, microcapsule technology gradually matured and became widely used in various fields such as carbonless paper,2 food,3 pesticides,4 pharmaceuticals,5 phase-change materials,6 lithium-ion batteries7,8 and self-healing materials.9 Since the self-healing microcapsules first proposed by S. R. White et al. in 2001,10 the research of microcapsules has been focused on self-healing materials.11 Polymeric materials are mainly used as the shell wall materials of microcapsules including poly(urea-formaldehyde),12,13 poly(melamine-formaldehyde),14 polyurethane (PU),15 polyurea16 and polystyrene.17 The functional core materials encapsulated are dicyclopentadiene (DCPD),10 epoxy resin,18 polydimethylsiloxane (PDMS),19 and isocyanate,20 which can be released and polymerized to repair the cracks in matrix materials.21
With the development of microencapsulation technology, the diameter of the microcapsules can be controlled to be less than 1 μm, and they are called nanocapsules. Nanocapsules were originally proposed by Marty et al. in the late 1970s.22 The smaller capsules result in a larger ratio of capsule surface area to volume, which is better for further surface modification.23 In addition, smaller capsules improve the compatibility and dispersibility between the capsules and the matrix.21 Considering the mechanical property, nanocapsules must be strong enough to prevent cracking during preparation such as stirring, centrifuging and filtration. Compared to ceramics and metals, the shell walls of the nanocapsules formed by polymer materials are generally fragile and have elastic modulus around 1–2 GPa.24 So far, the mechanical properties of a single nanocapsule have rarely been studied.
In regards to the research on the mechanical properties of microcapsules, M. W. Keller et al. tested the elastic modulus of poly(urea-formaldehyde)-shelled microcapsules filled with DCPD, and the elastic modulus of the shell wall was 3.7 GPa, which was independent of the capsule diameter.25 Silvia Armini et al. measured the elastic modulus of surface-charged polymethylmethacrylate (PMMA)-based terpolymer, and the value of composite terpolymer core–silica shell particles was as high as 11.1 GPa. The formation of a continuous silica layer around the composite improved the mechanical properties of the composite, which can also be a good strategy for enhancing nanocapsules.26 In addition, the solid particle-stabilized Pickering emulsion provides a more stable platform for the formation of nano/microcapsules.27,28 Pickering emulsion is an emulsion that is stabilized by solid particles rather than by surfactants or hydrocolloids. The interfacially active solid particles adsorbed at the interface between the two phases increase the stability of the emulsion through steric repulsion.24 After interfacial polymerization on the Pickering emulsion template, the organic–inorganic hybrid capsule shell can be obtained. The shell wall of microcapsules composed of solid particles can improve the resistance and strength of the microcapsules, encapsulating more active core materials.26 Accordingly, microcapsules synthesized from Pickering emulsions have shown improved properties.29,30
In this contribution, we synthesized a robust organic–inorganic hybrid nano/microcapsule based on Pickering emulsion templates. Both polyurethane and silica nanoparticles serving as the hybrid shell wall encapsulated isophorone diisocyanate as the core material. The primary aim of this research is to prepare a robust nano/microcapsule with remarkable resistance, which can be used in a variety of applications. The resultant capsules presented an improvement in solvent resistance, thermal stability and mechanical property. Moreover, the organic–inorganic hybrid nano/microcapsules exhibited self-healing performance in an organic silicon resin coating.
2 Results and discussion
2.1. Overview of the synthesized nano/microcapsules
The synthesis process of nano/microcapsules is shown in Fig. 1. In the synthesis process, the oil phase containing poly(propylene glycol), tolylene 2,4-diisocyanate-terminated (PPG–TDI) and IPDI was strongly dispersed into a silica nanoparticle suspension to form a Pickering emulsion. Silica nanoparticles were chosen as Pickering emulsion stabilizers distributed in the oil–water interface (Fig. 1B). When 1,4-butanediol (BDO) was introduced, the hydroxyl functional groups in the water phase reacted with the isocyanate functional groups in the oil phase, which was an interfacial polymerization, and produced a polyurethane (PU) shell surrounding the oil droplets (Fig. 1D). The isocyanate functional groups in PPG–TDI exhibited higher reactivity than the groups in IPDI; thus, the initial polymerization reaction occurred between PPG–TDI and BDO, and IPDI was encapsulated as the core material. The reaction scheme of the interfacial polymerization and the cross-sectional structure of the capsule are shown in Fig. 1C.
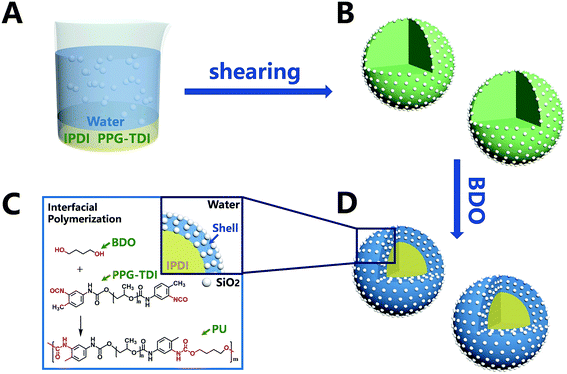 |
| | Fig. 1 Schematic of the nano/microcapsule synthesis process. | |
The experimental procedures at different conditions are listed in Table 1. Among them, the agitation rates of samples 1–4 were different; also, the addition of core and shell materials in samples 3, 5, 6 and 7 was different (the mass sum of core material and shell material was constant), and the addition of silica nanoparticles in samples 3, 8 and 9 was different.
Table 1 Procedures of the nano/microcapsule synthesis with different processing parameters
| Sample |
Silica nanoparticle dispersion [g] |
PPG–TDI [g] |
IPDI [g] |
Agitation rate [rpm] |
Yield [%] |
Core content [wt%] |
Content of silica nanoparticles [wt%] |
Mean diameter [nm] |
| 1 |
30 |
1.5 |
3 |
3000 |
62 |
28 |
10 |
1106 |
| 2 |
30 |
1.5 |
3 |
6000 |
45 |
29 |
18 |
848 |
| 3 |
30 |
1.5 |
3 |
9000 |
49 |
33 |
25 |
674 |
| 4 |
30 |
1.5 |
3 |
12![[thin space (1/6-em)]](https://www.rsc.org/images/entities/char_2009.gif) 000 000 |
64 |
39 |
27 |
468 |
| 5 |
30 |
0.5 |
4 |
9000 |
58 |
32 |
21 |
1023 |
| 6 |
30 |
1 |
3.5 |
9000 |
63 |
44 |
26 |
865 |
| 7 |
30 |
2 |
2.5 |
9000 |
53 |
34 |
28 |
758 |
| 8 |
15 |
1.5 |
3 |
9000 |
47 |
31 |
10 |
655 |
| 9 |
45 |
1.5 |
3 |
9000 |
40 |
29 |
37 |
891 |
Capsules of different sizes could be produced by changing the agitation rate. The morphologies and size distributions of samples 1–4 are listed in Fig. S1,† indicating that the diameter of the capsule decreased with increase in the agitation rate. Different additions of core/shell ratios and silica nanoparticles exhibited no significant influence on the mean size of the resultant capsules.
2.2. Morphology and statistical parameters of the capsules
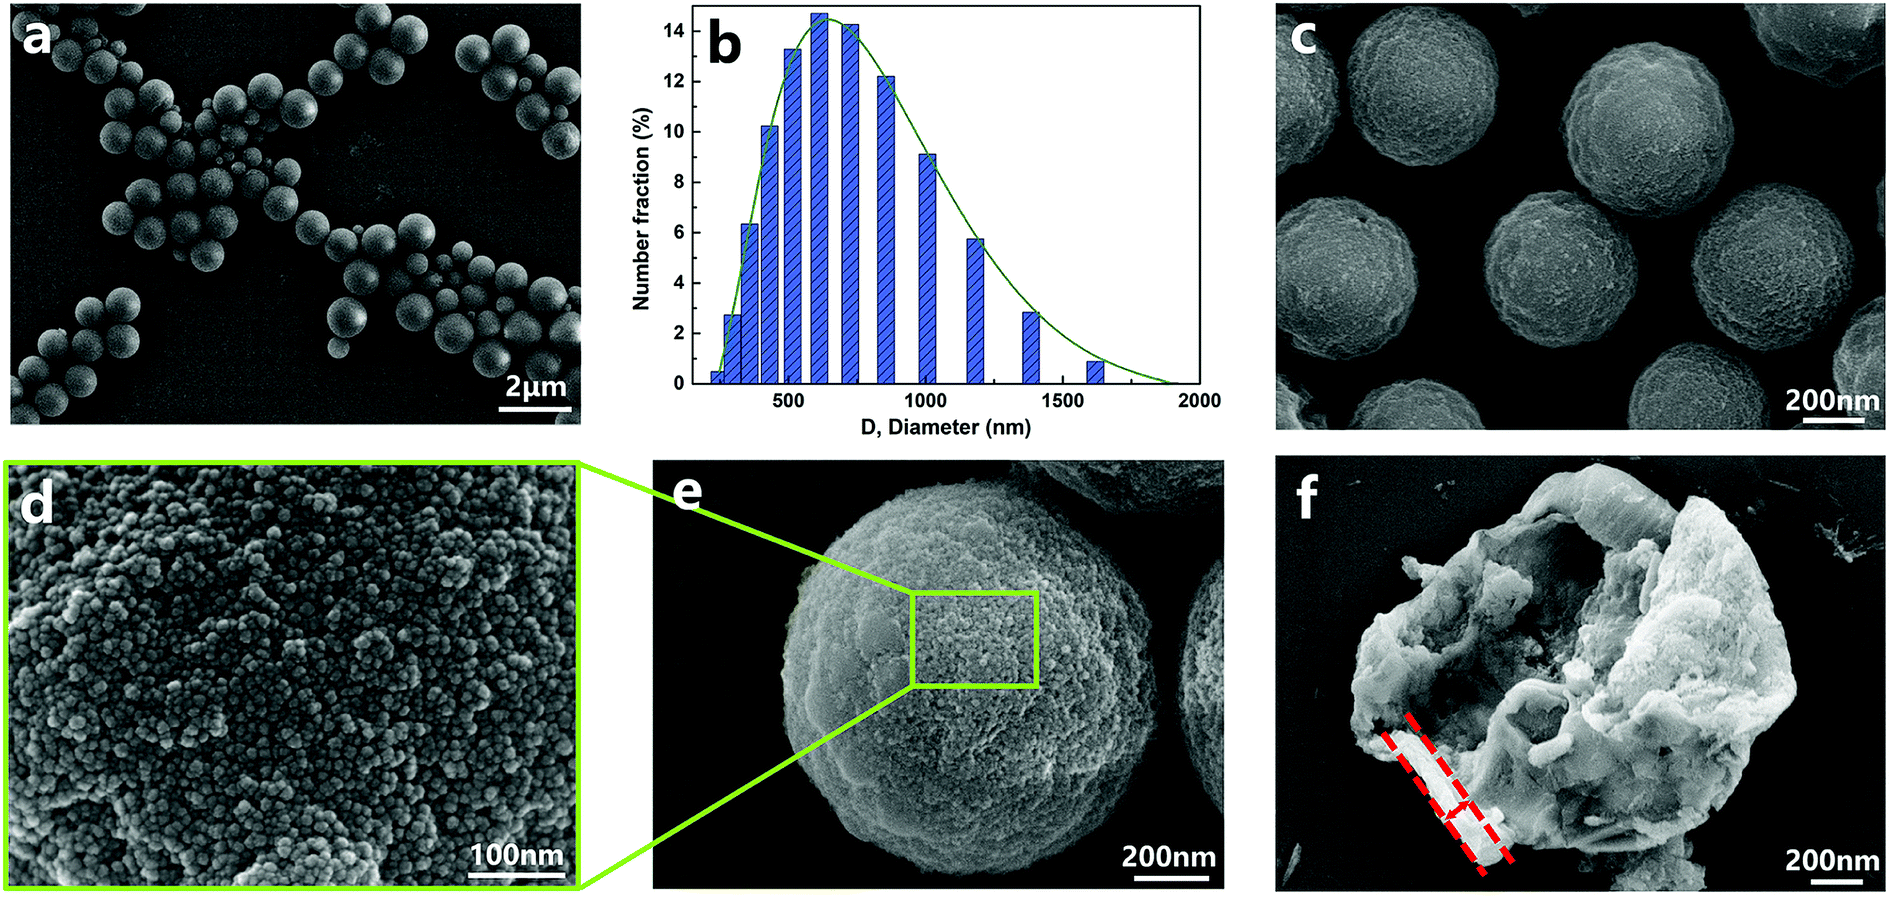
In this part, the capsules of sample 3 (listed in Table 1) were chosen to be thoroughly discussed for the surface morphology, core–shell structure and element distribution. The morphologies of the capsules are shown in Fig. 2. The diameters of capsules were approximately in the range from 190 nm to 1700 nm, and the mean diameter was 674 nm. The small-sized capsules promoted compatibility and dispersion with the matrix, which are also beneficial for surface modification. The surface morphology (Fig. 2d) clearly indicated that there was a dense layer of nanoparticles on the surface of the capsules. The thickness of the organic–inorganic hybrid shell wall (Fig. 2f) was roughly estimated to be about 50–150 nm, which ensured sufficient mechanical strength of the capsule.
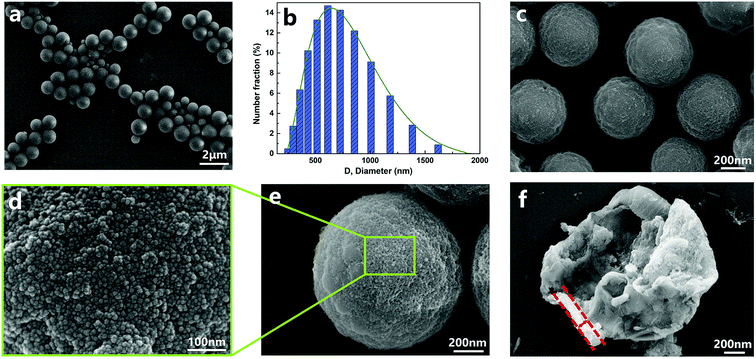 |
| | Fig. 2 SEM morphologies of (a, c and e) nano/microcapsules, (d) outer surface of capsules, (f) a capsule with a broken shell and (b) diameter distribution of capsules. | |
The structure of nano/microcapsules was further confirmed by TEM images (Fig. 3). The chemical composition of the capsules was determined by energy dispersive spectroscopy (EDS) mapping analysis. The EDS spectrum (Fig. 3b–e) of the capsule shows that besides C, O and N, Si is also present; it further exhibits capsules with a polymer–silica hybrid shell. The elemental mappings of the capsule showed the coverage of the microcapsules with silica nanoparticles.
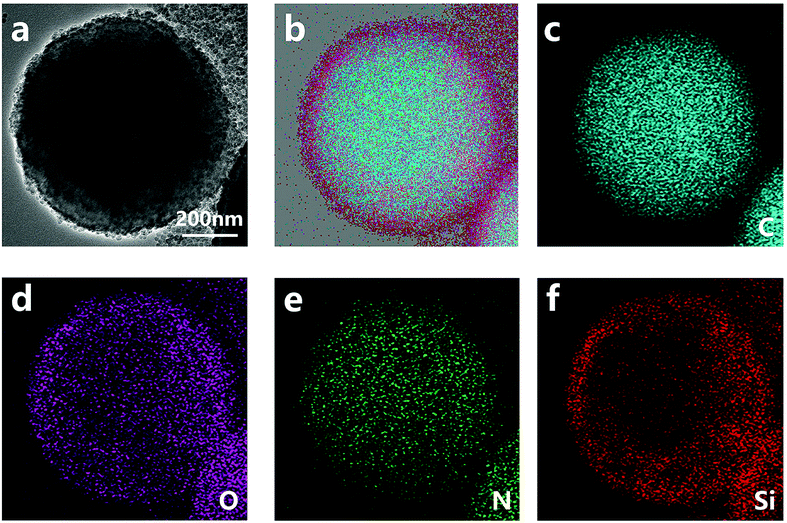 |
| | Fig. 3 TEM (a) and element mapping (b–f) images of nano/microcapsules. | |
2.3. Chemical structure and reactivity of the core material
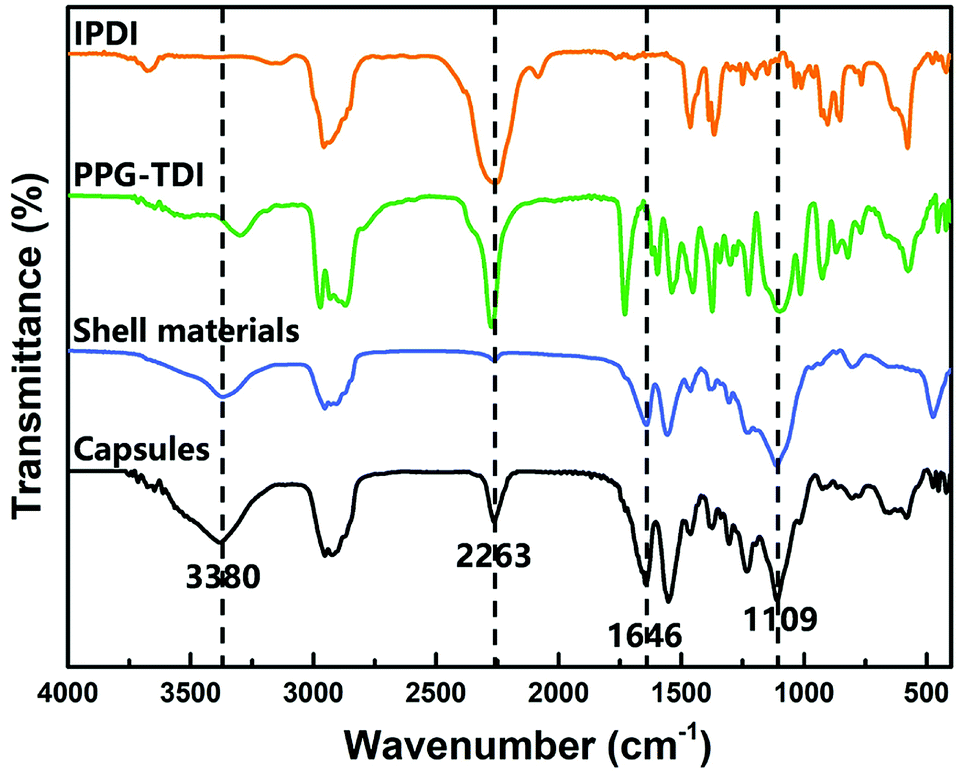
The chemical structure of the capsules was characterized by FT-IR. The FT-IR spectra of capsules, shell wall materials, PPG–TDI and IPDI are presented in Fig. 4. For the capsules and shell materials, the absence of NCO groups (at about 2263 cm−1) implied that the prepolymer reacted completely to form a PU shell. The stretching vibration peak of N–H groups at 3380 cm−1 and the stretching peak of C![[double bond, length as m-dash]](https://www.rsc.org/images/entities/char_e001.gif) O groups at 1646 cm−1 also proved the formation of the PU shell wall. Besides, the signal peak at 1109 cm−1 was associated with the Si–O–Si stretching vibrations of the silica nanoparticles, demonstrating the silica/PU hybrid structure of the shell. Moreover, different peak intensities of the NCO groups between the capsules and shell materials indicated that the NCO groups of IPDI were successfully encapsulated.31 The reactivity of the successfully encapsulated core materials was further investigated as follows.
O groups at 1646 cm−1 also proved the formation of the PU shell wall. Besides, the signal peak at 1109 cm−1 was associated with the Si–O–Si stretching vibrations of the silica nanoparticles, demonstrating the silica/PU hybrid structure of the shell. Moreover, different peak intensities of the NCO groups between the capsules and shell materials indicated that the NCO groups of IPDI were successfully encapsulated.31 The reactivity of the successfully encapsulated core materials was further investigated as follows.
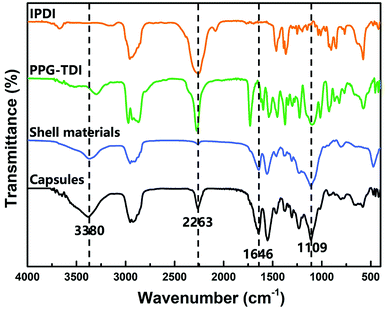 |
| | Fig. 4 FT-IR spectra of nano/microcapsules, shell materials, PPG–TDI and IPDI. | |
The reactivity of IPDI was evaluated by a simple test. Typically, when a few drops of ethylenediamine were added to a small amount of manually broken capsules, the liquid rapidly solidified and generated heat, indicating that IPDI was successfully encapsulated and maintained its chemical activity.20
2.4. Properties of nano/microcapsules
The wide application of the capsules was restricted by various environmental conditions, such as solvent, acidity/basicity, high temperature and different preparation processes. Therefore, the superior resistant properties of the capsules including thermal stability, solvent resistance and especially their strength still need to be improved.32,33
2.4.1. Solvent resistance. The solvent resistance property of the nano/microcapsules was evaluated by immersion in solvents such as xylene and acetone, which act as diluting agents in practical coating systems such as polyurethane, epoxy resin, and organic silicon resin.34 The released IPDI content was titrated according to ASTM D2572-97.35 As illustrated in Fig. 5, the relative released percentages of IPDI gradually steadied at 8.36 wt% and 10.24 wt% after immersion in xylene and acetone for 96 h, respectively. Therefore, the percentage of core materials remaining in the capsule was about 90%, indicating that the capsules exhibited good resistance to xylene and acetone at room temperature.32,36
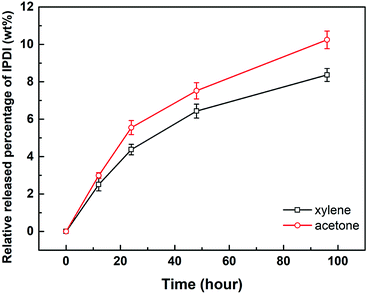 |
| | Fig. 5 Relative released percentages of IPDI in capsules after immersion in xylene and acetone for different times. | |
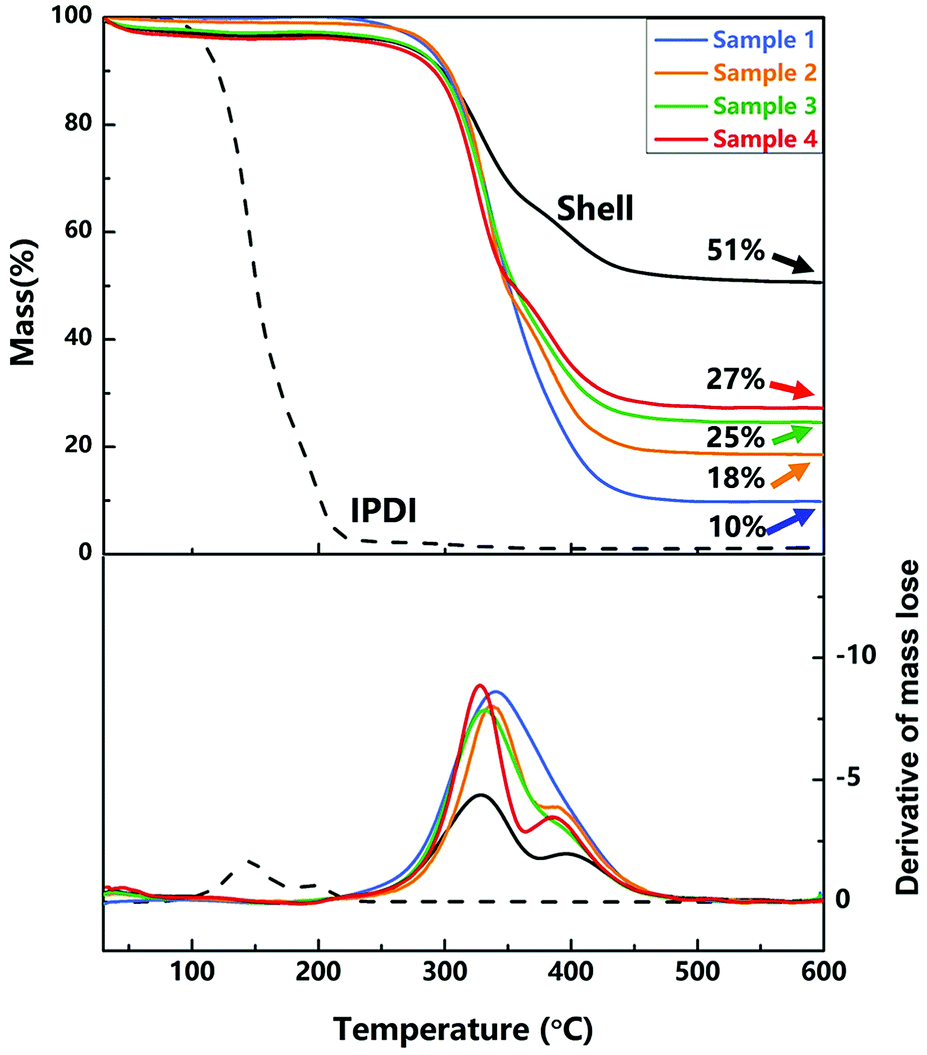
2.4.2. Thermal property. TGA and the derivative of TGA curves of nano/microcapsules (samples 1–4), IPDI and shell materials were conducted to evaluate the thermal stability and the content of silica nanoparticles in the capsules. As exhibited in Fig. 6, the initial evaporation temperature of the capsules is about 340 °C, which is clearly higher than that of pure IPDI (about 140 °C), showing the excellent thermal stability of the capsules. The improved thermal stability of the capsules can be attributed to the polyurethane shell embedded with silica nanoparticles (hybrid silica/PU shell), which prevented the leakage of core materials upon heating.
 |
| | Fig. 6 TGA and the derivative of TGA curves of nano/microcapsules, the shell wall and core material. | |
At about 600 °C on the curve, the residual mass is the mass fraction of silica nanoparticles because of the decomposition and evaporation of PU and IPDI. As shown in Fig. 6, the contents of silica nanoparticles in samples 1–4 (different agitation rates) are 10 wt%, 18 wt%, 25 wt% and 27 wt%, and the content of silica nanoparticles in the shell wall is 51 wt%. With increase in the agitation rate, the size of capsules decreased and the relative surface area enlarged, resulting in increase in the content of silica nanoparticles.
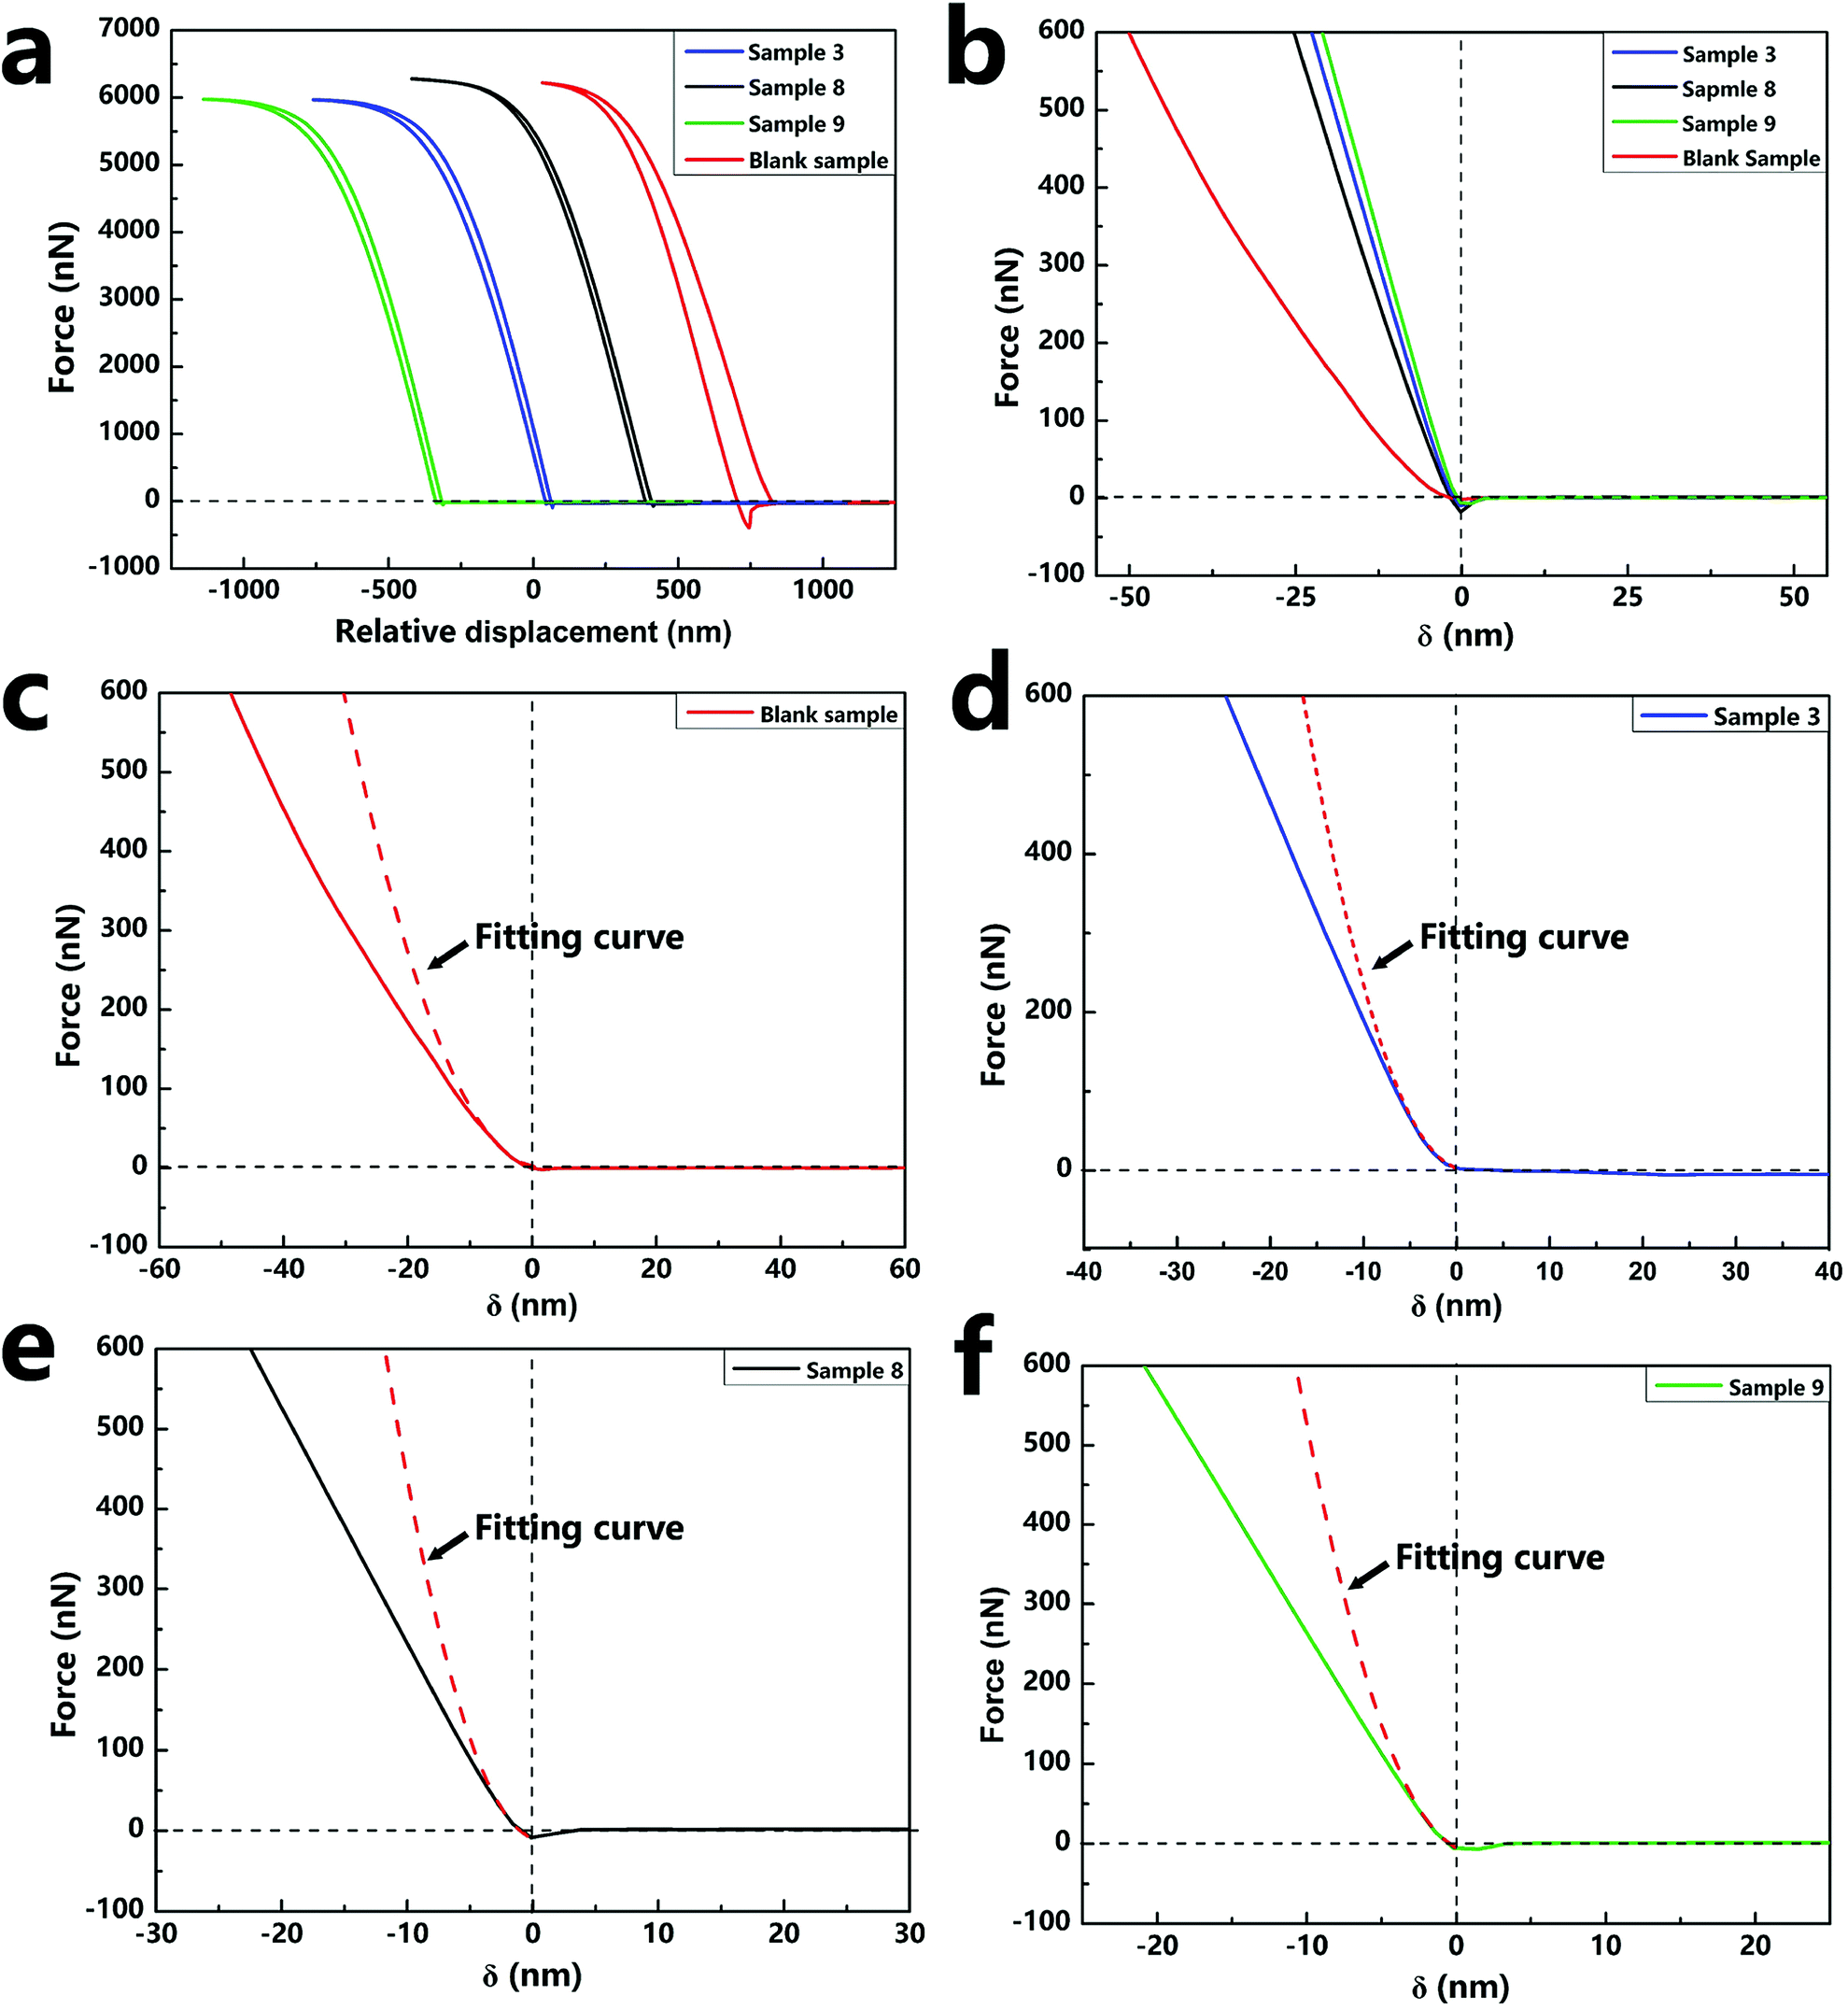
2.4.3. Mechanical property of single nano/microcapsule. The mechanical property is important for nano/microcapsules because robust capsules can avoid cracking during the preparation process and application. The mechanical property of a single capsule was characterized by AFM, which is one of the most popular and standard techniques for the characterization of the mechanical properties in all micro-mechanical test methods.37 As for the mechanical property, it has been proven that before the yield point, the individual capsules deform elastically and then return to their original shapes when the force is withdrawn. Once the yield point has passed, the deformation of the capsules is irreversible. In this experiment, the compressive modulus used to indicate the hardness of the material can be calculated from the force–displacement curve of AFM. To quantitatively extract values of compressive modulus, we used the NanoScope Analysis System Software to transform the force–displacement curves to force–indentation curves, which could then be used to calculate the equivalent elastic modulus (E*) and the compressive modulus (E) by fitting the Sneddon's model of the Hertzian theory.26 In the calculation, the content of silica nanoparticles in the sample can be obtained from the TGA curves (Fig. S2†).The force curves in Fig. 7a show the force versus displacement of the capsule samples (sample 3, sample 8, sample 9, and blank sample) with various contents of silica nanoparticles. The force–indentation curves and the respective fitting curves of the above-mentioned four samples are shown in Fig. 7b–e. The calculated compressive modulus values are reported in Table 2. The E value of the blank sample without silica nanoparticles was about 2.39 GPa, which is the same as that of a polyurethane material. As the content of the silica nanoparticles increased, E of the samples increased several-fold, indicating that the addition of silica nanoparticles increased the hardness of the capsules. However, a comparison of the E values of sample 3 and sample 9 indicated that different contents of silica nanoparticles had negligible effect on the E value. Because the content of silica nanoparticles tended to saturate and become excessive, nanoparticles could not have a continuously enhanced effect on the capsules. The different contents of silica nanoparticles of the samples can be observed by the SEM images (Fig. S3†).
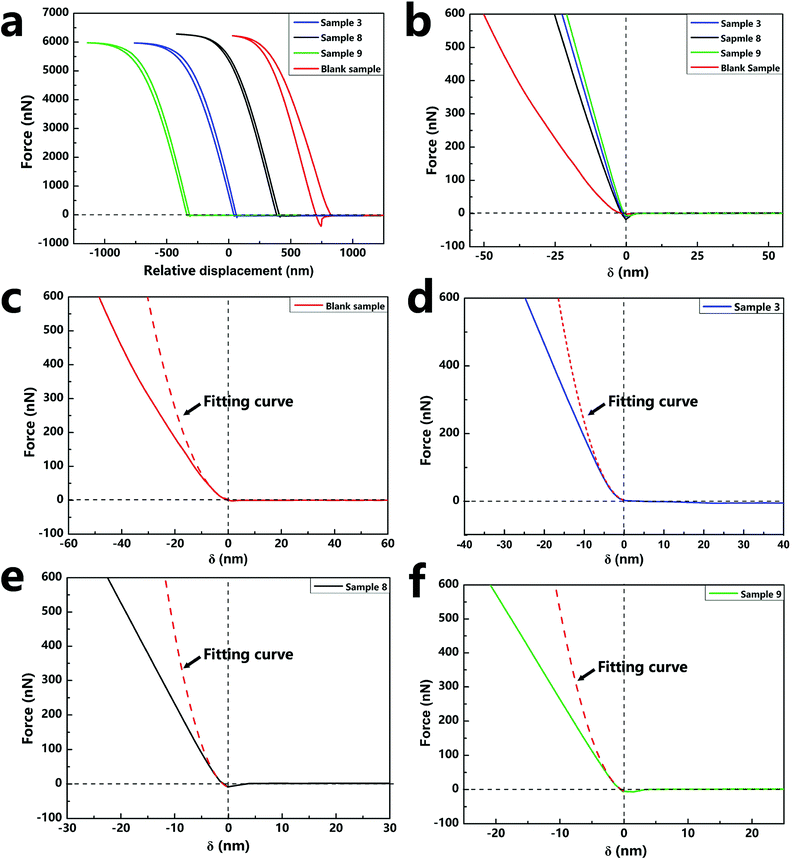 |
| | Fig. 7 Force–displacement curves (a) and typical force vs. indentation depth curves (b) of the capsule samples (sample 3, sample 8, sample 9, blank sample) with various contents of silica nanoparticles. The force vs. indentation depth curves were fitted with the Sneddon's model (c–f). | |
Table 2 The compressive modulus and state parameters of nano/microcapsules calculated by applying the Sneddon's model
| Sample |
Blank sample |
Sample 3 |
Sample 8 |
Sample 9 |
| wsilica (%) |
0 |
24.51 |
9.61 |
36.99 |
| wpolyurethane (%) |
100 |
42.49 |
59.50 |
34.40 |
| Vf (%) |
100 |
78.90 |
93.03 |
66.73 |
| v2 |
0.42 |
0.37 |
0.40 |
0.34 |
| E* (GPa) |
2.90 |
19.33 |
9.67 |
21.76 |
| Esample (GPa) |
2.39 |
16.73 |
8.10 |
19.28 |
The addition of silica nanoparticles increased the hardness of the nano/microcapsules, mainly in two ways. First, the shell of the capsules was densely packed by silica nanoparticles and bonded by polyurethane. Fig. 8 shows the surface morphologies of the capsules at different reaction times. At each time point, the surface of the capsule was covered with silica nanoparticles, whereas the capsule showed regular geometry. When the reaction was finally completed, the capsule formed a sphere and the silica nanoparticles filled the shell. Fig. 8a shows the shell wall and Fig. 8b illustrates the schematic diagram of the shell wall structure, which clearly presents the structure. Second, some hydroxyl functional groups of silica nanoparticles reacted with the isocyanate functional groups of PPG–TDI and PU shells during the reaction (Fig. 8c), which further enhanced the hardness of the shells, as shown in Fig. S4.† For silica nanoparticles, the signal peaks at 3380 cm−1 and 803 cm−1 were assigned to –OH stretching vibrations and Si–OH stretching vibrations. The stretching vibration peak of N–H groups in the shell materials was located at a similar position to that of the hydroxyl group in silica nanoparticles (3380 cm−1), from which the reaction of hydroxyl groups could not be clearly analyzed. However, different peak intensities of the Si–OH group at 803 cm−1 indicated that some hydroxyl functional groups of silica nanoparticles reacted with the isocyanate functional groups.38,39 The above-mentioned reasons caused enhancement in the hardness of the nano/microcapsules, which also improved the solvent resistance and thermal stability of the capsules.
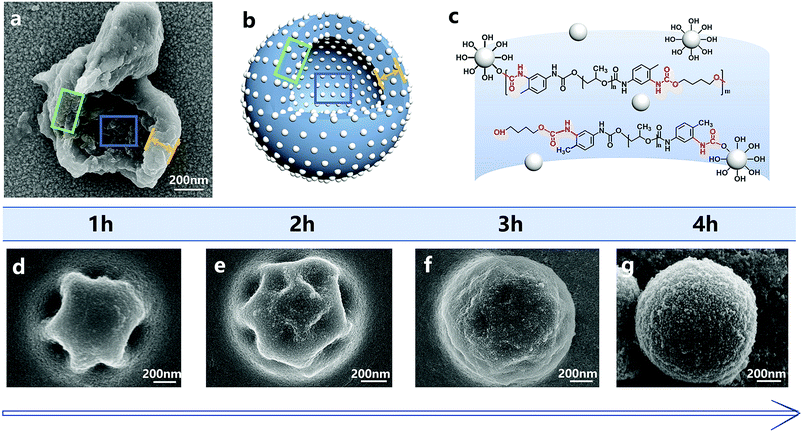 |
| | Fig. 8 SEM image of the shell (a) and the schematic of the capsule structure (b). The molecular structure of the capsule shell wall (c). The surface morphologies of the nano/microcapsules at different reaction times during the reaction (d–g). | |
2.5. Preliminary self-healing performance in resin coating
The resultant capsules were mixed in an organic silicon resin to create a self-healing coating, and the repairing performance was investigated by a preliminary brine-submersion corrosion-accelerating test. The optical images (Fig. S5†) and SEM images (Fig. 9) indicate the scratched areas of the self-healing coating and the pure organic silicon resin coated on the carbon steel panel after 48 h brine-immersion. As expected, the matrix coated with the self-healing coating withstood erosion from brine and showed no significant corrosion, exhibiting good self-healing ability. In contrast, the matrix coated with the control coating showed significant corrosion. Moreover, from the SEM images of the scratched area of the self-healing coating (Fig. 9c and d), we infer that the crack is filled with newly formed materials. The self-healing principle can be represented by the schematic diagram (Fig. 9e). The cracks of the coating caused rupture of the capsules and released the core material IPDI. IPDI reacted with water and gradually filled the cracks, enabling automatic repair of the coating.
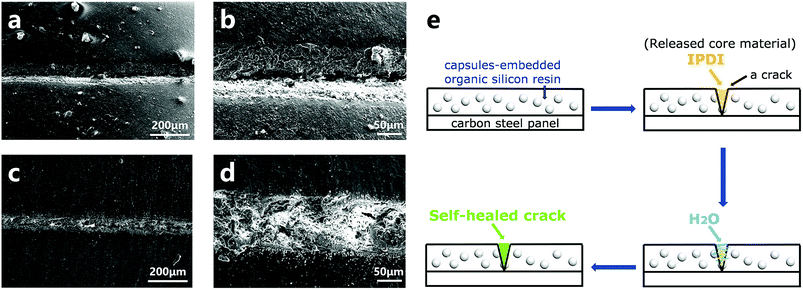 |
| | Fig. 9 SEM images of the scratched areas after immersion in brine for 48 h (a and b: control coating; c and d: self-healing coating). The schematic diagram of the self-healing process of the capsule-embedded coating (e). | |
3 Conclusion
Organic–inorganic hybrid nano/microcapsules loaded with IPDI were obtained via interfacial polymerization based on a silica nanoparticle-stabilized Pickering emulsion. The diameter, core content and the silica nanoparticle fraction of the resultant capsules were in the ranges of 468–1106 nm, 28–44 wt% and 10–37 wt%, respectively. The reduction of core content in the immersion tests indicated that the capsules exhibited outstanding resistance to xylene and acetone. The initial evaporation temperature of capsules characterized by TGA was about 340 °C, which proved their excellent thermal stability. As for the mechanical property evaluated by AFM, the compressive modulus of the resultant capsules was approximately 16.73–19.28 GPa, which was much higher than that of the blank sample (2.39 GPa). The improvement in the resistance of the nano/microcapsules was ultimately due to the addition of silica nanoparticles. Observation of the morphologies of the capsules at different reaction times indicated that the surfaces were covered with silica nanoparticles, due to which the whole shells were closely packed with silica nanoparticles and connected by polyurethane. Moreover, some hydroxyl functional groups of the silica nanoparticles reacted with the isocyanate functional groups of PPG–TDI and PU, further enhancing the hardness of the capsules. In addition, the organic–inorganic hybrid nano/microcapsules presented great self-healing performance in an organic silicon resin coating, which indicated the promising application potentials of the capsules in various fields.
4 Experimental section
4.1. Materials
Poly(propylene glycol) and tolylene 2,4-diisocyanate-terminated (PPG–TDI) (Mn ∼2300, isocyanate ∼3.6 wt%) were obtained from Sigma-Aldrich. Isophorone diisocyanate (IPDI) (99%), 1,4-butanediol (BDO), chlorobenzene (CIB), ethylenediamine, dibutylamine, xylene, and acetone were obtained from Aladdin. Silica nanoparticle dispersion (15 ± 5 nm, 30 wt%) was obtained from Suzhou You Zirconium Nanomaterials Co., Ltd. Organic silicon resin (JY875A) was obtained from Dongguan Junyi Chemical Technology Co., Ltd.
4.2. Nano/microcapsule synthesis
The nano/microcapsules with IPDI were prepared by O/W Pickering emulsion interfacial polymerization. The typical experiment procedure of sample 3 is as follows: 30 g of 30 wt% silica sol was added to 60 mL of deionized water in a beaker. The solution was agitated at a rate of 9000 rpm for 10 min with a high-speed dispersion machine to produce a stable suspension, which was considered as the water phase. To prepare the oil phase, 1.5 g of PPG–TDI was dissolved in 1.5 g of CIB; then, 3 g of IPDI was added and mixed well. The oil phase was added dropwise into the water phase to develop a Pickering emulsion system. After emulsification for 20 min, the above emulsion was transferred into a round-bottom flask equipped with a mechanical stirrer and heated with an oil bath. The oil bath was heated to 65 °C at a rate of 7 °C min−1. At 30 °C, a diluted aqueous solution of 0.5 g of BDO (5 wt%) was slowly added into the Pickering emulsion system with a stirring speed of 2500 rpm. The mixtures were polymerized at 65 °C for 4 h and then cooled down to room temperature slowly. The resultant capsules were centrifuged and washed with DI water and dried in a vacuum oven.
4.3. Morphology and statistic parameters of the nano/microcapsules
The surface morphology of the capsules was observed using field emission scanning electron microscopy (SUPRA55, Germany). The particle size of the capsules was calculated using an electrophoretic light scattering spectrometer (Zeta Sizer, Model 3000HS, Malvern Instruments Ltd.). A transmission electron microscope (JEM2200FS, JEOL, Japan) operated at 200 kV was used to characterize the morphology and microstructure of the capsules. The preparation method of the SEM observation sample was as follows: dried capsules or capsules ruptured with a hammer were adhered to a glass slide and sputtered with a thin layer of gold.
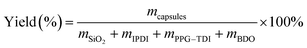
4.4. Yield
Yield of the capsules was defined as the mass ratio of the dried capsules to the starting materials, which was simply calculated as follows:40| |
 | (1) |
To confirm the constituents of the capsules, pure IPDI, PPG–TDI, capsule shell and full capsules were analyzed by using Fourier transform infrared spectroscopy (FT-IR, Nicolet IS10, USA) in the range from 4000 cm−1 to 400 cm−1 at a resolution of 0.4 cm−1.
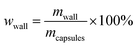
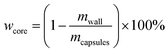
4.5. Core content and shell wall content
The core content of the capsules was measured by the solution extraction method. Manually broken capsules were extracted with acetone for 48 h in order to remove all the core materials. The residual mass of the dry materials was the weight of the shell wall. The shell wall content (wwall) and core content (wcore) were calculated as follows:21| |
 | (2) |
| |
 | (3) |
4.6. The content of silica nanoparticles
The silica nanoparticle fraction of the capsules was evaluated using Simultaneous TG-DSC Apparatus (Netzsch STA 449 F3) at a scanning rate of 10 °C min−1 from 25 °C to 600 °C in an N2 environment. The remaining mass after 600 °C was the silica nanoparticle content of the capsules.
4.7. Thermal property
The thermal stability was also analyzed using the Simultaneous TG-DSC Apparatus.
4.8. Solvent resistance
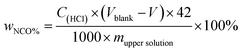
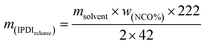
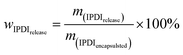
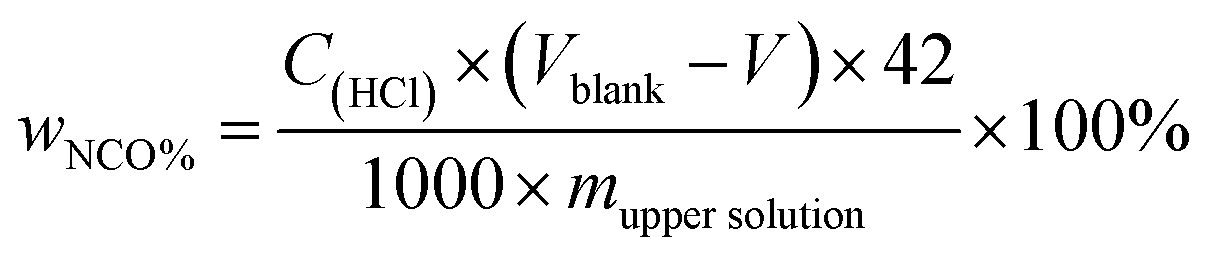
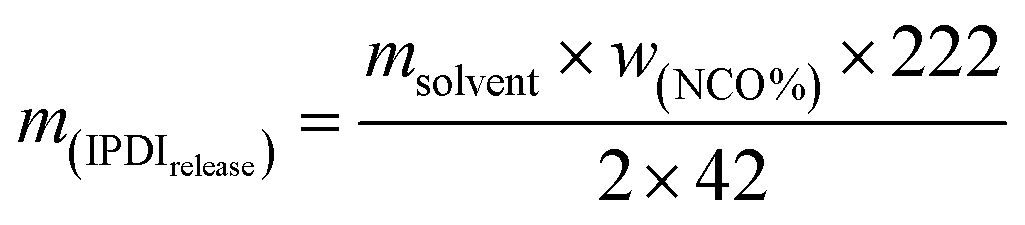
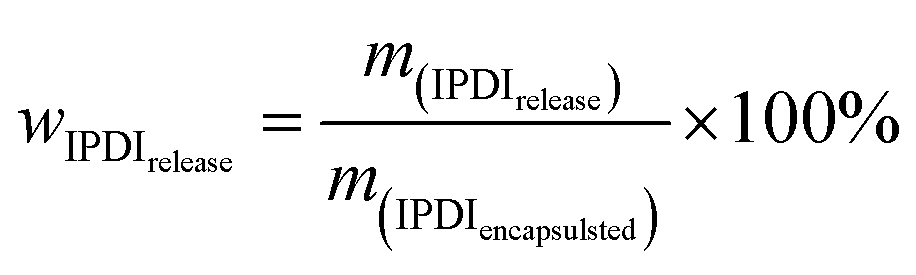
The solvent resistant property of the capsules was characterized by immersion test. First, 0.2 g of dried capsules was immersed into 10 g of xylene or acetone. After a certain time, 5 g of the upper solution was titrated by the Standard Test Method for Isocyanate Groups in Urethane Materials or Prepolymers (ASTM D2572-97). The core material IPDI release percentage of capsules was calculated as follows:| |
 | (4) |
| |
 | (5) |
| |
 | (6) |
Here, wNCO% is the percentage of NCO released into the solvent, mupper solution (g) is the weight of the upper solution (5 g), C(HCl) is the concentration of standard HCl aqueous solution, Vblank (mL) is the volume of standard HCl aqueous solution consumed by the blank experiment, V (mL) is the volume of standard HCl aqueous solution consumed by 5 g upper solution, 42 is the molar mass of the NCO group, m(IPDIrelease) (g) is the release weight of IPDI in the whole solvent, msolvent (g) is the weight of the solvent (10 g), and m(IPDIencapsulsted) (g) is the weight of IPDI encapsulated in 0.2 g of capsules.32
4.9. Mechanical property of single capsule
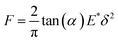
The mechanical curves and compressive modulus of a single capsule were tested using atomic force microscopy (Agilent AFM5500). The compressive modulus was calculated using the Sneddon model (Fig. 10) from the force–displacement curve. As for the Sneddon model, the relationship between F (force) and δ (deflection) is| |
 | (7) |
where α is the cone half-angle of the tip (the value was 18° in this experiment) and E* is the equivalent elastic modulus. Also, 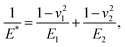 where E1 and E2 are the elastic moduli and v1 and v2 are the Poisson ratios of the tip and of the sample, respectively. In this system, Etip ≫ Esample; therefore,
  26 Because the Poisson ratios of the samples were unknown, the rule of mixture of composites was used in the calculations.
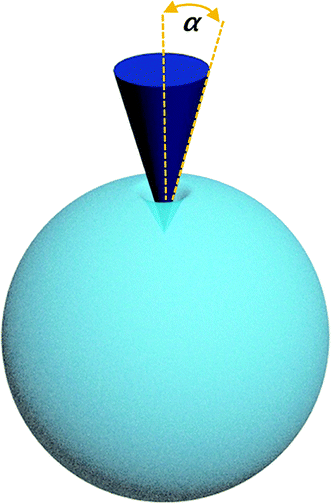 |
| | Fig. 10 Schematic of the Sneddon contact model. | |
The Poisson ratio of the capsule was calculated by the Poisson ratios of the shell materials, bulk polyurethane (vf = 0.42) and silica nanoparticles (vm = 0.17). The rule of mixture of composites is
| | |
v2 = vfVf + vm(1 − Vf)
| (8) |
where
vf is the Poisson ratio of the matrix,
vm is the Poisson ratio of the enhanced phase, and
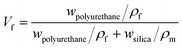
Vf is the matrix volume content, which can be calculated by the content and density of bulk polyurethane (
ρf = 1.02 g m
−3) and silica nanoparticles (
ρm = 2.20 g m
−3).
| |
 | (9) |
4.10. Preparation and observation of self-healing coatings
Self-healing coatings were prepared by dispersing 10 wt% of the resultant capsules into an organic silicon resin (JY875A). Then, the mixture was sonicated for 10 minutes. The carbon steel panel was polished with sandpaper and washed using deionized water. After drying, the matrix was coated by the self-healing coating with a thickness of 200–300 mm. Pure organic silicon resin was prepared as a control. The coatings were baked in an oven at 60 °C for 8 hours and then dried in the air for one day.
After the coatings completely dried, cracks were manually scratched on the coating using a razor blade. The samples were immersed in 10 wt% NaCl solution for 48 h to accelerate the corrosion process. Optical images were used to record the corrosion process. The scratched areas were observed by SEM images in detail. The optical photographs were taken with a digital camera (Olympus E-PL1, Japan).
Author contributions
The manuscript was written through the contributions of all authors. All authors have given approval to the final version of the manuscript.
Conflicts of interest
There are no conflicts to declare.
Acknowledgements
The authors are grateful for the support provided by the National Natural Science Foundation of China (Grant No. U1637204) and the Aeronautical Science Fund (2016ZF51053).
References
- R. Dubey, T. C. Shami and K. U. B. Rao, Def. Sci. J., 2009, 59, 82–95 CAS.
- M. A. White, J. Chem. Educ., 1998, 75, 1119–1120 CrossRef CAS.
- A. Gharsallaoui, G. Roudaut, O. Chambin, A. Voilley and R. Saurel, Food Res. Int., 2007, 40, 1107–1121 CrossRef CAS.
- P. G. Shukla, B. Kalidhass, A. Shah and D. V. Palaskar, J. Microencapsulation, 2002, 19, 293–304 CrossRef CAS PubMed.
- J. W. Beyger and J. G. Nairn, J. Pharm. Sci., 1986, 75, 573–578 CrossRef CAS PubMed.
- D. Yin, M. Li, J. Liu and Q. Zhang, Energy, 2014, 64, 575–581 CrossRef CAS.
- G. Zhu, L. Wang, H. Lin, L. Ma, P. Zhao, Y. Hu, T. Chen, R. Chen, Y. Wang and Z. Tie, Advanced Functional Materials, 2018 Search PubMed.
- T. Chen, Y. Hu, B. Cheng, R. Chen, H. Lv, L. Ma, G. Zhu, Y. Wang, C. Yan and Z. Tie, Nano Energy, 2016, 20, 305–314 CrossRef CAS.
- M. R. Kessler, N. R. Sottos and S. R. White, Composites, Part A, 2003, 34, 743–753 CrossRef.
- S. R. White, N. R. Sottos, P. H. Geubelle, J. S. Moore, M. R. Kessler, S. R. Sriram, E. N. Brown and S. Viswanathan, Nature, 2001, 409, 794 CrossRef CAS PubMed.
- T. Chen, R. Chen, J. Zhong and J. Liu, J. Mater. Chem. A, 2015, 3, 9510–9516 RSC.
- M. D. L. P. Miguel, R. Ollier, V. Alvarez and C. Vallo, Prog. Org. Coat., 2016, 97, 194–202 CrossRef.
- T. Nesterova, K. Dam-Johansen and S. Kiil, Prog. Org. Coat., 2011, 70, 342–352 CrossRef CAS.
- L. M. Meng, Y. C. Yuan, M. Z. Rong and M. Q. Zhang, J. Mater. Chem., 2010, 20, 6030–6038 RSC.
- E. Koh, N. K. Kim, J. Shin and Y. W. Kim, RSC Adv., 2014, 4, 16214–16223 RSC.
- X. K. D. Hillewaere, R. F. A. Teixeira, L. T. T. Nguyen, J. A. Ramos, H. Rahier and F. E. D. Prez, Adv. Funct. Mater., 2015, 24, 5575–5583 CrossRef.
- G. L. Li, M. Schenderlein, Y. Men, H. Möhwald and D. G. Shchukin, Adv. Mater. Interfaces, 2014, 1, 1300019 CrossRef.
- L. Yuan, G. Liang, J. Q. Xie, L. Li and J. Guo, Polymer, 2006, 47, 5338–5349 CrossRef CAS.
- M. W. Keller, S. R. White and N. R. Sottos, Adv. Funct. Mater., 2010, 17, 2399–2404 CrossRef.
- J. Yang, M. W. Keller, J. S. Moore, S. R. White and N. R. Sottos, Macromolecules, 2008, 41, 9650–9655 CrossRef CAS.
- L. Qiao, Y. Xue and Q. Zhang, J. Mater. Sci., 2017, 53, 1–14 CrossRef.
- J. J. Marty, R. C. Oppenheim and P. Speiser, Pharm. Acta Helv., 1978, 53, 17–23 CAS.
- D. Grigoriev, E. Shchukina and D. G. Shchukin, Adv. Mater. Interfaces, 2017, 4, 1600318 CrossRef.
- M. W. Patchan, B. W. Fuller, L. M. Baird, P. Gong, E. Walter, B. J. Vidmar, I. Kyei, Z. Xia and J. J. Benkoski, ACS Appl. Mater. Interfaces, 2015, 7, 7315 CrossRef CAS PubMed.
- M. W. Keller and N. R. Sottos, Exp. Mech., 2006, 46, 725–733 CrossRef CAS.
- S. Armini, I. U. V. Vakarelski, C. M. W. Whelan, K. Maex and K. Higashitani, Langmuir, 2007, 23, 2007–2014 CrossRef CAS PubMed.
- S. U. Pickering, J. Chem. Soc., Trans., 1907, 91, 2001–2021 RSC.
- H. Li, S. Li, Z. Li, Y. Zhu and H. Wang, Langmuir, 2017, 14149–14155 CrossRef CAS PubMed.
- L. A. Fielding and S. P. Armes, J. Mater. Chem., 2012, 22, 11235–11244 RSC.
- Y. Yu, W. Zengjiang, W. Chaoyang and T. Zhen, ACS Appl. Mater. Interfaces, 2013, 5, 2495–2502 CrossRef PubMed.
- M. Haghayegh, S. M. Mirabedini and H. Yeganeh, J. Mater. Sci., 2016, 51, 3056–3068 CrossRef CAS.
- G. Wu, J. An, D. Sun, X. Tang, Y. Xiang and J. Yang, J. Mater. Chem. A, 2014, 2, 11614–11620 RSC.
- M. M. Caruso, B. J. Blaiszik, H. Jin, S. R. Schelkopf, D. S. Stradley, N. R. Sottos, S. R. White and J. S. Moore, ACS Appl. Mater. Interfaces, 2010, 2, 1195 CrossRef CAS PubMed.
- Y. Ke and P. Stroeve, Polymer-layered silicate and silica nanocomposites, Elsevier, 2005 Search PubMed.
- ASTM Standard ASTM D2572-97, Standard Test Method for Isocyanate Groups in Urethane Materials or Prepolymers, 2010 Search PubMed.
- S. Kang, M. Baginska, S. R. White and N. R. Sottos, ACS Appl. Mater. Interfaces, 2015, 7, 10952–10956 CrossRef CAS PubMed.
- J. F. Su, X. Y. Wang, S. Han, X. L. Zhang, Y. D. Guo, Y. Y. Wang, Y. Q. Tan, N. X. Han and W. Li, J. Mater. Chem. A, 2017, 5, 23937–23951 RSC.
- M. Yang, Y. Gao, H. M. Li, M. Yang, Y. Gao and H. M. Li, eXPRESS Polym. Lett., 2007, 1, 433–442 CrossRef CAS.
- G. Zhang, A. Dass, A. M. M. Rawashdeh, J. Thomas, J. A. Counsil, C. Sotiriou-Leventis, E. F. Fabrizio, F. Ilhan, P. Vassilaras and D. A. Scheiman, J. Non-Cryst. Solids, 2004, 350, 152–164 CrossRef CAS.
- M. Huang and J. Yang, J. Mater. Chem., 2011, 21, 11123–11130 RSC.
Footnote |
| † Electronic supplementary information (ESI) available. See DOI: 10.1039/c8ra08396g |
|
| This journal is © The Royal Society of Chemistry 2019 |
Click here to see how this site uses Cookies. View our privacy policy here. 
 Open Access Article
 This Open Access Article is licensed under a Creative Commons Attribution-Non Commercial 3.0 Unported Licence
 *
*


 where E1 and E2 are the elastic moduli and v1 and v2 are the Poisson ratios of the tip and of the sample, respectively. In this system, Etip ≫ Esample; therefore,
 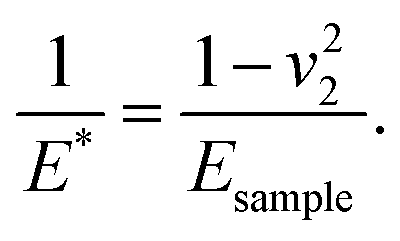 26 Because the Poisson ratios of the samples were unknown, the rule of mixture of composites was used in the calculations.

