 Open Access Article
The influence of cell morphology on microfluidic single cell analysis
Xuxin Zhang†
a,
Yanzhao Li†a,
Hanshu Fangb,
Hongquan Weic,
Ying Mu *d,
Ming-Fei Lang
 *b and
Jing Sun
 *ef
*ef
aAffiliated Zhongshan Hospital of Dalian University, Dalian 116001, China
bMedical College, Institute of Microanalysis, Dalian University, Dalian 116622, China. E-mail: langmingfei@dlu.edu.cn
cFirst Hospital of China Medical University, Shenyang 110001, China
dInstitute of Cyber-Systems and Control, Zhejiang University, Hangzhou 310007, China. E-mail: muying@zju.edu.cn
eThe Key Laboratory of Biomarker High-throughput Screening and Target Translation of Breast and Gastrointestinal Tumor of Liaoning Province, Dalian University, Dalian 116622, China
fCollege of Environmental and Chemical Engineering, Institute of Microanalysis, Dalian University, Dalian 116622, China. E-mail: sunjing@dlu.edu.cn
First published on 21st December 2018
Abstract
Microfluidics has been widely used in single cell analysis. Current protocols allow either spread or round cells to be analyzed. However, the contribution of cell morphology to single cell analysis has not been noted. In this study, four proteins (EGFR, PTEN, pAKT, and pS6) in the EGFR signaling pathway are measured simultaneously using microfluidic image cytometry (MIC) in glioblastoma cells U87. The results show that the MIC technology can reveal different subsets of cells corresponding to the four protein expression levels no matter whether they are round or spread at the time of the measurements. However, sharper distinction is obtained from round cells, which implies that cellular heterogeneity can be better resolved with round cells during in situ protein quantification by imaging cytometry. This study calls attention to the role of cell morphology in single cell analysis. Future studies should examine whether differences in data interpretation resulting from cell morphology could reveal altered biological meanings.
Introduction
Analyzing intracellular signaling pathways is essential to understanding many cancer behaviors, such as tumorigenesis, metastasis, and drug response. Traditionally, variations in signaling pathways are detected by population-based approaches, such as western blot, ELISA, immunohistochemistry, and flow cytometry. These approaches are helpful in gaining general images by averaging all the information within a population. However, they are inadequate to reveal variability within the population and can even mask small changes that may contribute to significant behaviors.1–3 Therefore, single cell analysis has become necessary to scrutinize the heterogeneity of cellular signaling pathways more thoroughly and quantitatively.Over the past years, single cell characterization has become a powerful tool to dissect cellular heterogeneity of cancers.4–9 Details in signaling disturbance at single cell levels have provided guidance to more accurate diagnosis and treatment regime. For example, Sun et al. measured four proteins (epidermal growth factor receptor, EGFR; phosphatase and tensin homolog, PTEN; phospho-AKT serine/threonine kinase 1, pAKT; phospho-ribosomal protein S6 kinase, pS6) in EGFR signaling pathway with glioblastoma cells and patient samples by microfluidic image cytometry (MIC).10 The simultaneous acquisition of the four protein levels revealed that patients with low EGFR, PTEN, and pAKT, but high pS6 expression had much longer survival. Advancement in flow cytometry has also expanded this population-based method in single cell analysis. Using multi-parameter flow cytometry (MFC), Kotecha et al. were able to distinguish a STAT5-active subpopulation at single cell levels in acute myeloid leukemia (AML).11 These STAT5-active AML cells were responsive to low doses of GM-CSF and represented a more malignant cell population. Both the above technologies MIC and MFC are able to detect multiple proteins in a single cell simultaneously. However, the MIC technology has its advantages in fewer sample requirements and lower reagent consumption. In addition, the MIC provides morphological correlation to expression levels that the MFC (or more generally, flow cytometry) is unable to.
Currently, microfluidics-based single cell analysis has been developed into various applications, including observing signaling dynamics in living cells continuously.12–17 For diagnostic purposes, available protocols allow both round and spread cells to be stained for imaging by fluorescent microscope.10,18,19 Cells loaded for the MIC measurement can be derived from hematological or solid tumor samples. While cells from hematological samples are round and in their natural shapes, cells from solid tumors are dissociated from their original tissue and are in unnatural morphology. Such solid tumor derived cells can be further maintained in culture and be examined till they attach and become fully spread, which mimics more closely to their original morphology. Given the delicate nature of single cell analysis, it is worth studying whether signaling profiles differ when cell morphology changes during the diagnostic manipulation.
To test the influence of cell morphology in single cell analysis by microfluidics, four cytosolic protein (EGFR, PTEN, pAKT, and pS6) expression levels were measured in glioblastoma cells U87 when their morphologies were either round or spread. The expression levels from the different cell morphologies were compared. Results showed that the signaling proteins could be well distinguished whether they were examined in round or spread morphology. However, round cells presented shaper subsets separation based on the expression levels compared to the spread cells. This study calls attention to the subtle contribution to the analytical outcome by cell morphology during single cell analysis. Further study would link these subtle contributions with biological meanings.
Materials and methods
Design and fabrication of the microfluidic chips
The microfluidic chips with 24 channels were fabricated as described in a previous study.10 Briefly, polydimethylsiloxane (PDMS) (Momentive) was moulded to form the channels of the microfluidic chips that were mounted on poly-L-lysine (PLL)-coated glass slides. The dimensions of the microfluidic channels were 8 mm (l) × 1 mm (w) × 120 μm (h). The channels were filled with cells and culture media through an inlet and wastes were removed from an outlet.Cell culture in the microfluidic channels
The human glioma cell line U87 was purchased from the American Type Culture Collection. U87 cell variants overexpressing EGFR, PTEN, or EGFR with PTEN (U87-EGFR, U87-PTEN, U87-PTEN-EGFR, respectively) were described previously.10,20 All the cells were cultured in DMEM containing 10% fetal bovine serum and 1% penicillin/streptomycin (Thermo Scientific) in a 5% CO2, 37 °C incubator. 500 cells per μL were loaded into the microfluidic channels and were allowed to grow overnight. For spread morphology, these cells were measured directly. For round morphology, these cells were resuspended by 0.25% trypsin–EDTA (Thermo Scientific) digestion for 1 min at room temperature, loaded back into the microfluidic channels, and briefly centrifuged for attachment before measurements.On-chip immunocytochemistry
On-chip immunocytochemistry (ICC) was performed as previously reported.10 Briefly, the cells were first fixed by 4% paraformaldehyde in the microfluidic channels at room temperature for 15 min, washed with PBS for three times, permeabilized by 0.3% Triton X-100 for 15 min, blocked with 10% normal goat serum, 3% bovine serum albumin and 0.1% N-dodecyl-β-maltoside for 12 hours at 4 °C, and immunolabeled. The fluorophore-conjugated antibodies were an optimized mixture of anti-EGFR (BD Pharmingen) labelled with LiCor/HiLyte Fluor 750 (Dojindo Molecular Technologies), phycoerythrin conjugated anti-PTEN (BD Biosciences), Alexa Fluor 647-conjugated anti-pS473-AKT (Cell Signaling Technology), and Alexa Fluor 488-conjugated anti-pS235/S236-S6 (Cell Signaling Technology).Image acquisition and data analysis
Images of the immunolabeled cells were obtained by a Nikon Eclipse Ti2 inverted fluorescent microscope with a CCD camera similar to previously reported.10 The exposure time for the spread cells was 10 s for LiCor/HiLyte Fluor 750 (EGFR), 1 s for PE (PTEN), 2 s for Alexa Fluor 647 (pAKT) and 0.5 s for Alexa Fluor 488 (pS6). For the spread cells, the exposure time was shortened to avoid overexposure: 8 s for EGFR, 1 s for pAKT, 0.5 s for PTEN, and 0.2 s for pS6. Eight images were taken from each channel, which covered the complete bottom surface of a channel. All the images were used for analysis. Each channel contained about 500 cells and cells from 5 channels were combined for analysis. Fluorescent intensities in individual cells were quantified by MetaMorph (Molecular Devices) using the Multi-Wavelength Cell Scoring module. Background subtraction for each frame was performed by assessing the average intensity values in area with no cells. Fluorescent intensity values were normalized by the cell-surface area. These intensities were logarithmically transformed to give Gaussian-like distributions. The transformed intensities were used for subsequent analysis in OriginPro 2018 (OriginLab) and transformed into 3D scatter charts.Distance calculation and statistics
For calculating the distance between different subsets, normalized fluorescent intensities were entered into OriginPro 2018. Hierarchical clustering analysis was performed. The Euclidean distances between different subsets were obtained and represented as mean ± sd. Student's t-test was applied for statistical analysis, where p < 0.05 was considered significant. All the experiments were repeated in triplicate.Results
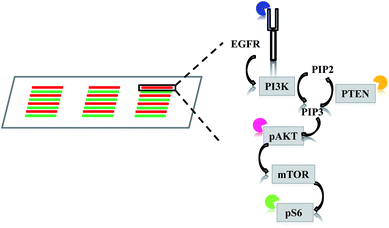
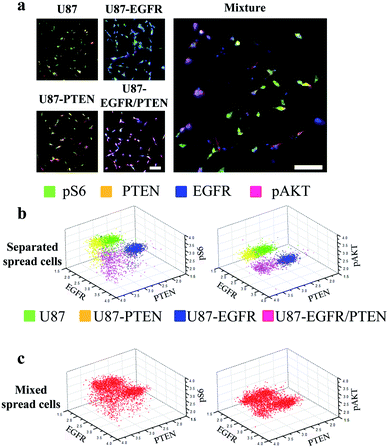
The multi-parameter microfluidic chip was fabricated with PDMS containing 24 channels (Fig. 1). U87 cells were introduced into each channel. Quantitative ICC was achieved by staining four proteins of the EGFR signaling pathway (EGFR, PTEN, pAKT, and pS6). Antibodies against the four proteins were conjugated with different fluorophores, enabling simultaneous detection of the four proteins and subsequent quantification based on fluorophore intensities. Four different cell lines were chosen in this study, U87, U87-EGFR (overexpressing EGFR), U87-PTEN (overexpressing PTEN), and U87-EGFR/PTEN (overexpressing EGFR and PTEN).Staining of spread cells was first tested. The cells were loaded into the microfluidic channels and allowed to settle overnight for complete attachment to the surface of the channels, with the cells fully spread as their typical flat morphology. When the cell lines were stained separately, overlays of the four-antibody staining showed that U87-EGFR cells overexpressing EGFR were markedly stained by EGFR, while the staining for pS6, PTEN, and pAKT was also seen though the intensities were not as much as those of the EGFR staining. Likewise, U87-PTEN and U87-EGFR/PTEN stained mostly for PTEN and EGFR/PTEN, respectively [Fig. 2(a)]. When the cell lines were mixed with equal numbers of cells after staining (i.e. separated spread cells), the presence of four subsets could be revealed, reflecting the four cell lines [Fig. 2(b)]. Quantitative analysis of the fluorophore intensities by 3D scatter charts in the separated spread cells, plotted against the expression levels of either pS6/EGFR/PTEN or pAKT/EGFR/PTEN, resulted in four subsets representing the four cell lines [Fig. 2(b)]. In the charts, each dot represented a single cell and the locations of the dots reflected the expression levels (fluorophore intensities) of the proteins. For example, purple dots were U87-EGFR/PTEN cells that overexpressed EGFR and PTEN and were located at high EGFR and PTEN levels.
When equal numbers of the four cells were mixed before staining (mixed spread cells), the same analysis could also reveal four subsets [Fig. 2(c)]. When plotted with fluorophore intensities of pS6/EGFR/PTEN, the four subsets were separated not as well as those that were plotted with pAKT/EGFR/PTNE fluorophore intensities. Notably, the separated and the mixed cell lines shared similar subset patterns, demonstrating that the MIC technology could distinguish cells of different origins.
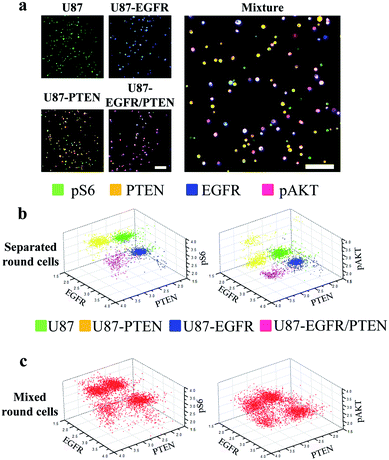
Next, staining of round cells was investigated. For this purpose, the four U87 cell lines were cultured overnight followed by trypsin treatment for resuspension. The resuspended cells were briefly centrifuged to settle after loading into the microfluidic channels and were immediately stained for analysis. At the time of staining, the cells were round as they were in suspension. The expression of the four proteins (EGFR, PTEN, pAKT, and pS6) could be detected in either separated or mixed cell lines [Fig. 3(a)], similar to those seen with the spread cells. However, when 3D scatter charts were evaluated, the cell lines were better separated no matter whether they were in the separated [Fig. 3(b)] or in the mixed form (Fig. 3(c)), compared with the results with the spread cells [Fig. 2(b) and (c)]. The expression levels (as demonstrated by fluorophore intensities) of the four proteins in different cell lines were detected as expected, i.e. U87-PTEN with more PTEN staining, U87-EGFR with more EGFR staining, and U87-EGFR/PTEN with more EGFR/PTEN staining.
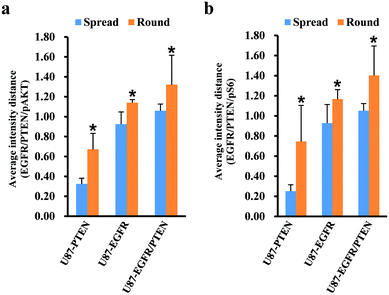
Since cell heterogeneity is more mimicked by mixing the cells before staining, the mixed spread and the mixed round cells were compared by average intensity distance (AID). For calculating the AIDs between different subsets, normalized fluorescent intensities were entered into OriginPro 2018. Using the hierarchical clustering analysis, the Euclidean distances between different subsets were obtained. The AIDs of the U87 subset to the other three subsets were compared between the mixed spread and the mixed round cells. When plotted with the intensities of pAKT/PTEN/EGFR [Fig. 4(a)], for the spread cells, the distance of U87 subset to the other three subsets were 0.325 ± 0.057 (to the U87-PTEN), 0.925 ± 0.122 (to the U87-EGFR), 1.059 ± 0.067 (to the U87-EGFR/PTEN); for the round cells, 0.672 ± 0.159 (to the U87-PTEN), 1.140 ± 0.031 (to the U87-EGFR), 1.322 ± 0.294 (to the U87-EGFR/PTEN). The distances of the round cells were significantly longer (p < 0.001) than the spread cells, reflecting sharper distinction of the mixed round cells. Similarly, the distances of the mixed round cells were distinguished better (p < 0.001) when plotted with pS6/PTEN/EGFR [Fig. 4(b)]. For the spread cells, the distance of U87 subset to the other three subsets were 0.251 ± 0.064 (to the U87-PTEN), 0.928 ± 0.185 (to the U87-EGFR), 1.051 ± 0.072 (to the U87-EGFR/PTEN); for the round cells, 0.745 ± 0.359 (to the U87-PTEN), 1.167 ± 0.094 (to the U87-EGFR), 1.402 ± 0.293 (to the U87-EGFR/PTEN).
Discussion
In this study, the effects of cell morphology on microfluidic image cytometry were assessed. Based on our previous results,10 when the fluorophore intensities were analyzed quantitatively by 2D contour plots, similar conclusions could be drawn in spread and round cells, i.e. four subsets corresponding to the four U87 cell lines were resolved. However, the power of the microfluidic image cytometry relies on its simultaneous analysis of multi-parameters. Two-dimensional plots only allow two parameters to be analyzed each time, which compromises the power of the MIC technology. Therefore, this study analyzed one additional parameter that resulted in significant differences between different cell morphologies that the previous study didn't show. This implies that subtle variations would be better resolved by simultaneous evaluation of multiple parameters. Furthermore, cell morphology should be considered during single cell analysis.When the four cell lines were separately stained before mixing, the 3D scatter charts using three out of the four proteins were able to show four cell subsets. Given the heterogeneous nature of the U87 cell lines, it is not surprising that different combinations of the proteins generated different resolutions of the four cell lines (e.g. EGFR/PTEN/pS6 vs. EGFR/PTEN/pAKT). To mimic a glioma tissue, the four cell lines were mixed before staining. Again, the four cell lines were retrieved as four subsets. Comparing the results of the separated and the mixed cell lines, there was no obvious difference regarding the degree of resolution. This demonstrated that the resolution of the MIC technology remained at acceptable levels in highly heterogeneous samples. It is also of note that overlaps among the subsets did exist in the four artificially overexpressing cell lines. This could be due to the variations in the expression levels of the overexpressed proteins within a given cell line, the highly heterogeneous nature of a given cell line that induced variations in the expression levels of the overexpressed protein, or the combination of the above two possibilities.
While cell heterogeneity wouldn't compromise the power of the MIC technology, this study showed that cell morphology could influence how well the heterogeneity could be reflected. In the 3D charts, better resolution was achieved with the round cells. The round cells were measured almost at the same time as the spread cells, though resuspension of the cells accounted for some delay. Besides cell morphology, another factor that may contribute to the resolution difference was the trypsin treatment during the cell resuspension step for the preparation of the round cells. Trypsin treatment digests protein linkages at the outer surface of the cells. Any changes of protein expression within the cells may be negligible. In other words, trypsin treatment may not change protein levels within the cells in this study, especially under very mild treatment (e.g. for cell resuspension with low concentration of trypsin–EDTA for 1 min at room temperature). Even for the only surface protein EGFR in this study, it is also not expected to be digested by our resuspension protocol. Indeed, in a parallel experiment cells were mechanically resuspended without the trypsin digestion and were compared with those with the trypsin digestion. The result showed no difference (data not shown). The other three proteins in the EGFR signaling pathway are in the cells and their levels in the round or in the spread cells may be considered the same. Therefore, the resolution differences observed may truly reflect the effect of cell morphology on the analysis outcome. If a study is divided into three phases: treatment, observation, and analysis, it is also worth mentioning that the focus of this study is on the observation phase. Most of the previous studies have set the focuses on treating the cells differently,21,22 which allows different cells to enter the observation phase, leading to an expectation of different results from different treatment. In contrast, the same cells entered the observation phase in this study, which would set the expectation that same results should be observed. However, this study shows that post-treatment handling can lead to different observations.
For cells with delicate tuning mechanisms, their expression profiles may generally look similar. Small differences in protein levels may lead to different cell fates and different responses to intervention. In an era of precision medicine, more precise molecular diagnosis is necessary. Thus, manipulation of the cells when they are isolated from their origin can have important influence on data interpretation.
Our results that cell morphology played an important role in protein expression would be helpful when conducting analysis. For example, cells may be firstly examined in their spread and round forms to make judgment on the choice of the detection methodology. When the differences between the two forms are insignificant, it would be better not to disturb the spread cells (by detachment) to conduct an analysis. However, when cells under investigation show significant differences by the different morphologies, more and different approaches are necessary to support if the cell morphology changes indeed influence result interpretation.
Finally, different experimental regime may require different cell morphology. Spread cells were used in our previous study of cell cycle analysis by DAPI staining of nuclear DNA.23 The reason is that our pilot study revealed better resolution and reflection of cell cycle phases with spread cells, instead of round cells. The explanation to the differences in this and the previous study may rely on the location and the intensity of the signals. In cell nuclei, the condensed DNA can mask some of the DAPI signals when the cells are round, however, by flatten the cells, the DNA is more uniformly distributed in cell nuclei and the microscope can detect more signals. For cytosolic signaling proteins, they are scattered and the signals are much weaker compared with the DAPI signals in cell nuclei. Therefore, round cells serve to concentrate and intensify the signals, which results in clearer distinction (shown as longer distances between subsets in this study) among heterogeneous cell population. Along this line, when signals from nucleic DNA and cytosolic proteins are required at the same time (e.g. to correlate cell cycles measured by DNA contents with cell cycle phase specific cytosolic protein levels), optimized balance on which morphology fits better should be considered.
Conclusions
This study demonstrates the significance of cell morphology (spread or round) on the detection of fine differences of the cells, which is important for the molecular diagnosis in the era of precision medicine.Conflicts of interest
There are no conflicts to declare.Acknowledgements
This research was funded by grants from the National Natural Science Foundation of China (No. 21505013 to Jing Sun), the Natural Science Foundation of Liaoning Province, China (No. 2015020660 to Ming-Fei Lang), the Liaoning BaiQianWan Talents Program (No. [2015]6 to Jing Sun), the Dalian Science and Technology Innovation Funds (No. 2018J13SN087 to Ming-Fei Lang), and the Health and Family Planning Commission of Dalian Municipality (No. 1811121 to Yanzhao Li).References
- J. M. Irish, R. Hovland, P. O. Krutzik, O. D. Perez, Ø. Bruserud, B. T. Gjertsen and G. P. Nolan, Cell, 2004, 118, 217–228 CrossRef CAS PubMed.
- J. M. Irish, N. Kotecha and G. P. Nolan, Nat. Rev. Cancer, 2006, 6, 146–155 CrossRef CAS PubMed.
- D. J. Dickinson, F. Schwager, L. Pintard, M. Gotta and B. Goldstein, Dev. Cell, 2017, 42, 416–434.e411 CrossRef CAS PubMed.
- S. J. Altschuler and L. F. Wu, Cell, 2010, 141, 559–563 CrossRef CAS PubMed.
- C. Brasko, K. Smith, C. Molnar, N. Farago, L. Hegedus, A. Balind, T. Balassa, A. Szkalisity, F. Sukosd, K. Kocsis, B. Balint, L. Paavolainen, M. Z. Enyedi, I. Nagy, L. G. Puskas, L. Haracska, G. Tamas and P. Horvath, Nat. Commun., 2018, 9, 226–232 CrossRef PubMed.
- S. Rajaram, L. E. Heinrich, J. D. Gordan, J. Avva, K. M. Bonness, A. K. Witkiewicz, J. S. Malter, C. E. Atreya, R. S. Warren, L. F. Wu and S. J. Altschuler, Nat. Methods, 2017, 14, 967–970 CrossRef CAS PubMed.
- M. Tellez-Gabriel, B. Ory, F. Lamoureux, M. F. Heymann and D. Heymann, Int. J. Mol. Sci., 2016, 17, 2142–2160 CrossRef PubMed.
- S. G. Parker, Y. Yang, S. Ciampi, B. Gupta, K. Kimpton, F. M. Mansfeld, M. Kavallaris, K. Gaus and J. J. Gooding, Nat. Commun., 2018, 9, 2288–2296 CrossRef PubMed.
- D. Zhang, L. Wei, M. Zhong, L. Xiao, H.-W. Li and J. Wang, Chem. Sci., 2018, 9, 5260–5269 RSC.
- J. Sun, M. D. Masterman-Smith, N. A. Graham, J. Jiao, J. Mottahedeh, D. R. Laks, M. Ohashi, J. DeJesus, K. Kamei, K. B. Lee, H. Wang, Z. T. Yu, Y. T. Lu, S. Hou, K. Li, M. Liu, N. Zhang, S. Wang, B. Angenieux, E. Panosyan, E. R. Samuels, J. Park, D. Williams, V. Konkankit, D. Nathanson, R. M. van Dam, M. E. Phelps, H. Wu, L. M. Liau, P. S. Mischel, J. A. Lazareff, H. I. Kornblum, W. H. Yong, T. G. Graeber and H. R. Tseng, Cancer Res., 2010, 70, 6128–6138 CrossRef CAS PubMed.
- N. Kotecha, N. J. Flores, J. M. Irish, E. F. Simonds, D. S. Sakai, S. Archambeault, E. Diaz-Flores, M. Coram, K. M. Shannon, G. P. Nolan and M. L. Loh, Cancer Cell, 2008, 14, 335–343 CrossRef CAS PubMed.
- M. G. Roper, Anal. Chem., 2016, 88, 381–394 CrossRef CAS PubMed.
- R. A. Kellogg, R. Gomez-Sjoberg, A. A. Leyrat and S. Tay, Nat. Protoc., 2014, 9, 1713–1726 CrossRef CAS PubMed.
- M. E. Warkiani, L. Wu, A. K. Tay and J. Han, Annu. Rev. Biomed. Eng., 2015, 17, 1–34 CrossRef CAS PubMed.
- T. W. Murphy, Q. Zhang, L. B. Naler, S. Ma and C. Lu, Analyst, 2018, 143, 60–80 RSC.
- S. Nahavandi, S. Baratchi, R. Soffe, S.-Y. Tang, S. Nahavandi, A. Mitchell and K. Khoshmanesh, Lab Chip, 2014, 14, 1496–1514 RSC.
- H. Liu, Z. Ye, X. Wang, L. Wei and L. Xiao, Analyst, 2018 10.1039/c8an01420e.
- J. M. Irish, J. H. Myklebust, A. A. Alizadeh, R. Houot, J. P. Sharman, D. K. Czerwinski, G. P. Nolan and R. Levy, Proc. Natl. Acad. Sci. U. S. A., 2010, 107, 12747–12754 CrossRef CAS PubMed.
- H. J. Yoo, J. Park and T. H. Yoon, Cytometry, Part A, 2013, 83, 356–362 CrossRef PubMed.
- M. Y. Wang, K. V. Lu, S. Zhu, E. Q. Dia, I. Vivanco, G. M. Shackleford, W. K. Cavenee, I. K. Mellinghoff, T. F. Cloughesy, C. L. Sawyers and P. S. Mischel, Cancer Res., 2006, 66, 7864–7869 CrossRef CAS PubMed.
- A. Riedl, M. Schlederer, K. Pudelko, M. Stadler, S. Walter, D. Unterleuthner, C. Unger, N. Kramer, M. Hengstschläger, L. Kenner, D. Pfeiffer, G. Krupitza and H. Dolznig, J. Cell Sci., 2017, 130, 203–218 CrossRef CAS PubMed.
- G. Gut, M. D. Tadmor, D. Pe'er, L. Pelkmans and P. Liberali, Nat. Methods, 2015, 12, 951–954 CrossRef CAS PubMed.
- J. Sun, J. Zhang, H. Yang, G. Wang, Y. Li, X. Zhang, Q. Chen and M.-F. Lang, Micromachines, 2017, 8, 36–43 CrossRef.
Footnote |
| † These authors contributed equally to this work. |
| This journal is © The Royal Society of Chemistry 2019 |


