 Open Access Article
Purification and rapid dissolution of potassium sulfate in aqueous solutions
Shoujiang Lia,
Kaige Suna,
Yunliang Zhao *ab,
Guihua Niea and
Shaoxian Songb
aSchool of Resources and Environmental Engineering, Wuhan University of Technology, Luoshi Road 122, Wuhan, Hubei 430070, China. E-mail: zyl286@whut.edu.cn
bHubei Key Laboratory of Mineral Resources Processing and Environment, Wuhan University of Technology, Luoshi Road 122, Wuhan, Hubei 430070, China
First published on 15th January 2019
Abstract
Water soluble potassium sulfate dissolves rapidly and completely in water. Its main characteristics are purity and dissolution rate. In this study, the purification and rapid dissolution of potassium salt (K2SO4) separated from potassium brine deposits collected from Lop Nur basin of China (referred to as LN K2SO4) were studied for utilization in agricultural farming as a potash fertilizer. First, the dissolving-crystallizing process was conducted to remove the insoluble content and improve the purity of K2SO4. Second, physical modification of K2SO4 surfaces was accomplished based on the Noyes–Whitney equation. The results showed that the water insoluble content could be completely removed and the purity of K2SO4 reached 100% in the purification process. The dissolution rate was significantly improved with the help of environmentally-friendly additives such as sodium tripolyphosphate (STPP)/urea phosphate (UP). These additives ameliorated the diffusion coefficient (D) and the diffusion layer thickness (h) for K2SO4. Results also demonstrated that a larger K2SO4 surface area (S) induced a higher dissolution rate.
1 Introduction
Potassium is one of the three essential elements for plants to maintain proper growth.1–5 Potash fertilizers used in agriculture usually contain two types: one is potassium chloride (KCl), which is harmful to some crops, increases soil salinity and pH of the soil, and the other is potassium sulfate (K2SO4), which is a chlorine-free, high-quality, potent potash fertilizer, especially indispensable for tobacco, tea, potatoes, watermelon, sugar beets and other economic crops that are sensitive to chlorine.6–9Fully water-soluble potassium sulfate can dissolve rapidly and completely in water, allowing it to be more efficiently absorbed and utilized by crops. More importantly, K2SO4 can be applied in agricultural facilities for processes such as sprinkler irrigation and drip irrigation. Overall, this allows for the integration of water and fertilizer, a reduction in water usage, fertilizer-saving, reduced labor and increased production.10,11 As a result, water-soluble fertilizer is a promising candidate for the simultaneous application of water and fertilizer technology for reduced water consumption in agricultural applications.
Lop Nur salt lake, located in the eastern Tarim basin, contains the biggest potassium brine deposits discovered in China. These deposits also contain a magnesium sulfate sub-type brine and can be used to produce potassium sulfate fertilizers.12,13 Through the exploitation and utilization of Lop Nur salt lake, SDIC Xinjiang Lop Nur Potash Co. Ltd. (SLNP) has become the biggest K2SO4 production company in the world with a K2SO4 yield of 1.6 million ton per year.14,15 The insoluble content in K2SO4 production affects not only the purity of K2SO4, but also the dissolution rate. However, Lop Nur agricultural K2SO4 (LN K2SO4) contains about 1 wt% insoluble residue, which decreased the purity of K2SO4 and made it dissolve slowly and incompletely. Moreover, the purity of LN K2SO4 does not meet the national standard for water soluble fertilizer HG/T4365-2012, where the insoluble content must be less than 0.5 wt%. Therefore, it is necessary to investigate the purification of LN K2SO4.
The process for dissolving a solid requires two consecutive stages. In the first stage, solute molecules are released from the solid surface into the solution. In the second stage, dissolved molecules are transferred from the solid–liquid interface to the solution by diffusion or convection.16–18 The dissolution process can be explained by the Noyes–Whitney19,20 equation:19,20
 | (1) |
Potassium sulfate dissolution has drawn widespread attention. Kubota stated that traces of foreign ions (trivalent chromium and trivalent iron) have a significant effect on the dissolution rates of K2SO4 crystals.21–23 Furthermore, the dissolution kinetics of K2SO4 crystals were studied with an ion selective electrode. The effects of hydrodynamics on the dissolution were also investigated.24 However, the above research studies were based on a more ideal situation or pure K2SO4 crystal samples. No profound study has been performed on agricultural K2SO4 and its rapid dissolution. Thus in this paper, an attempt was made to study the purification and rapid dissolution behavior of potassium sulfate. First, Lop Nur agricultural K2SO4 (LN K2SO4) was used as a raw material to remove the insoluble content by a purification process. The Noyes–Whitney equation was then applied to analyze the K2SO4 dissolution mechanism. The physical properties of K2SO4 were modified with the help of surfactants. Accordingly, the rapid dissolving process was determined.
2 Experimental
2.1 Materials
Agricultural potassium sulfate (LN K2SO4) was obtained from SDIC Xinjiang Lop Nur Potash Co. Ltd., China. Chemical grade polyethylene glycol 1000 (PEG 1000), sodium tripolyphosphate (STPP), and analytical grade reagents for gravimetric methods and Volhard method (sodium tetraphenylborate, ethylenediaminetetraacetic acid disodium salt, ammonium iron sulfate, BaCl2 and AgNO3) were purchased from Sinopharm Chemical Reagent Co. Ltd. Industrial grade urea phosphate (UP) was purchased from Tianjin Kemiou Chemical Reagent Co. Ltd. Tap water was used in all experiments and its physicochemical properties are shown in Table 1. The concentration of metal ions (K+, Na+, Mg2+, Ca2+) was determined by an atomic absorption spectrophotometer (AAS, AA-6880 SHIMADZU, Japan). The concentration of SO42− and Cl− anions was determined by the barium chloride gravimetric method and the Volhard method, respectively.| Physicochemical properties | K+ (mg L−1) | Na+ (mg L−1) | Mg2+ (mg L−1) | Ca2+ (mg L−1) | Cl− (mg L−1) | SO42− (mg L−1) | pH | Conductivity (μS cm−1) |
|---|---|---|---|---|---|---|---|---|
| 92.5 | 4.8 | 28.8 | 55.2 | 117 | 142 | 7.31 | 344.6 |
2.2 Characterization
The chemical composition of LN K2SO4 and purified LN K2SO4 (PLN K2SO4) are shown in Tables 2 and 3, respectively. The potassium content (wt%) was determined by the potassium tetraphenylborate gravimetric method. The SO42− and Cl− contents were determined by the barium chloride gravimetric method and the Volhard method, respectively. The Na+, Mg2+, Ca2+ metal ion contents were determined by AAS.| Sample | Weight (%) | |||||||
|---|---|---|---|---|---|---|---|---|
| K2O | SO42− | Mg2+ | Cl− | Ca2+ | Na+ | H2O | Insolubles | |
| LN K2SO4 | 49.91 ± 0.69 | 53.79 ± 1.21 | 0.213 ± 0.03 | 1.233 ± 0.27 | 0.16 ± 0.04 | 0.19 ± 0.07 | 0.21 ± 0.006 | 1.18 ± 0.37 |
| Sample | Weight (%) | ||||||
|---|---|---|---|---|---|---|---|
| K2O | SO42− | Mg2+ | Cl− | Ca2+ | Na+ | Insolubles | |
| PLN K2SO4 | 54.67 ± 0.97 | 54.52 ± 0.80 | 0.0037 ± 0.001 | 0.057 ± 0.002 | 0.0167 ± 0.006 | 0.017 ± 0.005 | 0 |
The particle size was related to the surface area, which was significant for the dissolution rate according to the Noyes–Whitney equation. The size distribution of LN K2SO4 was obtained with wet sieves. The results are listed in Table 4. It can be seen that the size distribution of LN K2SO4 was −150 + 105 μm up to 60%.
| LN K2SO4 | Size fraction (μm) | |||||||
|---|---|---|---|---|---|---|---|---|
| +450 | −450 + 300 | −300 + 150 | −150 + 105 | −105 + 74 | −74 + 45 | −45 | Total | |
| Yield (%) | 0.33 | 6.73 | 18.64 | 60.49 | 1.26 | 11.2 | 1.35 | 100 |
2.3 Purification of Lop Nur agricultural potassium sulfate
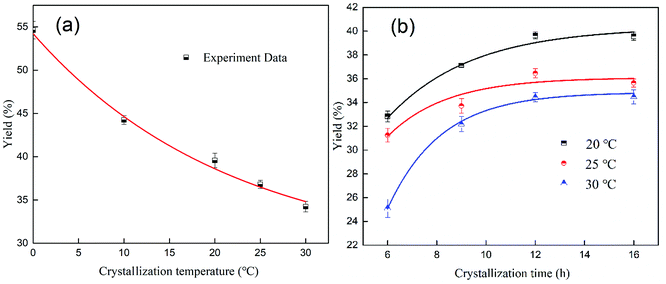
The solubility of K2SO4 was positively correlated with temperature. Purification was achieved by dissolving agricultural potassium sulfate at a high temperature, filtering to remove the insoluble content, and then crystallizing at a low temperature. The purification experiment was carried out as follows. First, a certain mass of LN K2SO4 was added to a three-necked bottle that contained 1 L of water to obtain the desired liquid to solid ratio. The mixture was then stirred at a speed of 300 rpm for 10 min to achieve a dissolution equilibrium at the desired temperature (100 °C, 80 °C or 60 °C). Afterwards, the residues were separated at the above desired temperature using a qualitative filter paper. The filtrate was placed in an alternating damp heat apparatus for spontaneous crystallization at the desired temperature (0–30 °C). After a certain crystallization time, the solid phase was separated from the solution using a qualitative filter paper. The obtained solid was dried at 105 °C in an oven until a constant weight was recorded. Finally, the purified LN K2SO4 (PLN K2SO4) was obtained. The chemical composition of PLN K2SO4 was determined using the same method as that for LN K2SO4. The crystallization yield was calculated by using the following equation:
 | (2) |
2.4 Rapid dissolution of potassium sulfate
To improve the dissolution rate of K2SO4, the purified LN K2SO4 (PLN K2SO4) product was mixed with some additives such as dispersants, wetting agents and surfactants. The procedures were as follows: first, additives with a different mass ratio (accounting for the mass of PLN K2SO4), and PLN K2SO4 were mechanically ground to form a homogeneous mixture. The mixture was then crushed at different times with a high-speed crusher (FW-100, China) to achieve a suitable granular grade. Afterwards, 100 g of the above mixture was added to 1 L of water at room temperature under a stirring speed of 150 rpm. An electrical conductivity meter (A215, ORION, USA) was used to determine the end of the dissolution process. The conductivity of the solution increased as the dissolution process progressed and then reached equilibrium when the dissolution was completed. Meanwhile, the dissolution time was recorded when the conductivity reached equilibrium. The dissolution rate was expressed in terms of dissolution time.3 Results and discussion
3.1 Purification of Lop Nur agricultural potassium sulfate
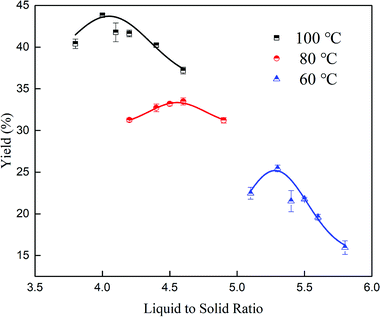
It can be seen from Table 2 that the water insoluble content in the LN K2SO4 samples was 0.76 wt%, which was higher than the national standard of 0.5 wt%. The high insoluble content had a negative effect on the dissolution of LN K2SO4. Purification significantly and efficiently solved the problem. After comparing Table 3 with Table 2, it can be obviously seen that the insoluble content was efficiently removed and that the impurity content for the ions (Mg2+, Ca2+, Na+, Cl−) decreased after purification. Moreover, the K2O content increased to 54.67% in this experiment. During the purification process, the dissolution temperature, liquid to solid ratio, crystallization temperature and time were very vital for the dissolution and crystallization process. Thus, these four factors were discussed in detail.![[thin space (1/6-em)]](https://www.rsc.org/images/entities/char_2009.gif) :
:![[thin space (1/6-em)]](https://www.rsc.org/images/entities/char_2009.gif) 1, 4.5
1, 4.5![[thin space (1/6-em)]](https://www.rsc.org/images/entities/char_2009.gif) :
:![[thin space (1/6-em)]](https://www.rsc.org/images/entities/char_2009.gif) 1 and 5.3
1 and 5.3![[thin space (1/6-em)]](https://www.rsc.org/images/entities/char_2009.gif) :
:![[thin space (1/6-em)]](https://www.rsc.org/images/entities/char_2009.gif) 1, respectively. However, the yield (25.35%) was low at 60 °C. Considerately, a high temperature meant high energy consumption and a low temperature represented a low yield. Therefore, the ideal condition was 80 °C with a corresponding 4.5
1, respectively. However, the yield (25.35%) was low at 60 °C. Considerately, a high temperature meant high energy consumption and a low temperature represented a low yield. Therefore, the ideal condition was 80 °C with a corresponding 4.5![[thin space (1/6-em)]](https://www.rsc.org/images/entities/char_2009.gif) :
:![[thin space (1/6-em)]](https://www.rsc.org/images/entities/char_2009.gif) 1 liquid–solid ratio.
1 liquid–solid ratio.
3.2 Rapid dissolution of potassium sulfate
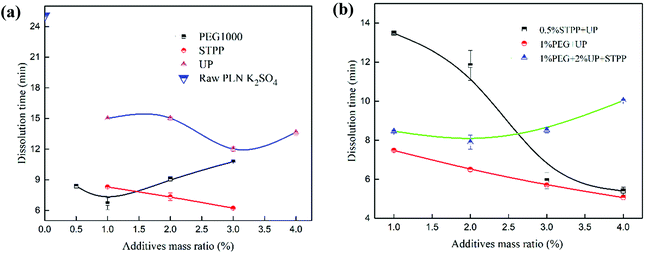
After the purification process, the purity of K2SO4 significantly improved. The rapid dissolution of K2SO4 was investigated in detail. Based on the Noyes–Whitney equation, the diffusion coefficient (D) and diffusion layer thickness (h), which were inherent properties of crystal K2SO4, were vital to the dissolution rate.18,25 Therefore, it is important to improve the D and h by changing K2SO4 crystal surface properties. Additives such as the dispersant and wetting agent could change the surface properties of K2SO4. These additives could improve the dispersity and wettability, resulting in an intrinsic change in the D and h.26Fig. 3 shows the dissolution time after the K2SO4 crystal surface modification with some additives. It can be seen from Fig. 3(a) that addition of additives like PEG, STPP or UP promoted the dissolution of K2SO4 and decreased the dissolution time from 25 min to 6.25 min for PLN K2SO4. Fig. 3(b) describes the dissolution characteristics for K2SO4 with different mass ratios of mixing additives. Only the mass ratio of one additive was changed. Results demonstrated that the dissolution time was shorter by using mixture of additives rather than using a single additive. In addition, the dissolution time for the 0.5% STPP mass ratio and the 4% UP (0.5% STPP/4% UP) with 1% PEG1000/4% UP mass ratio was 5.5 min and 5 min, respectively. When the STPP mass ratio was higher than 0.5% UP, the mixture was difficult to dissolve and the solution became turbid. Moreover, PEG1000 was an expensive organic polymer that was difficult to decompose. In addition, PEG1000 is harmful to the environment and crops. UP and STPP have dispersity and can help to disperse K2SO4. Furthermore, UP contains nutrient elements such as N and P, which can promote the growth of plants. Because STPP can be used for softening hard water, it can be applied to hard irrigation water.27 Moreover, STPP and UP are environment friendly. Therefore, after considering the price and performance of the additives, 0.5% STPP/4% UP was chosen to be the combination additives.
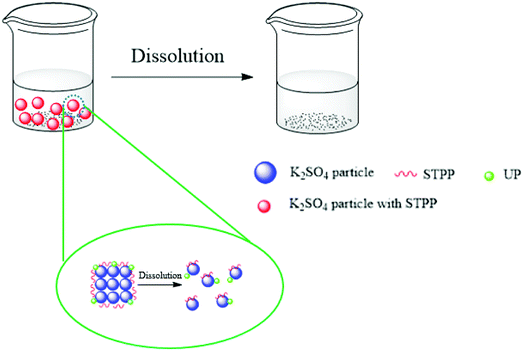
The mechanism for promoting dissolution with additives is depicted in Fig. 4. It is well-known that STPP and UP are dispersants used to prepare suspensions.28,29 STPP and UP were attached to the surface of K2SO4 particles. When the samples were in water, the additives on the surface helped the K2SO4 particles to quickly disperse. This phenomenon resulted in an increase in the D and an intrinsic decrease in the h.
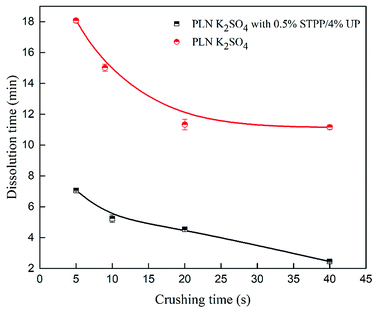
The particle size was related to the surface area (S).30–32 The particle size distribution for PLN K2SO4 with 0.5% STPP/4% UP varied with crushing time as shown in Table 5. The effect of crushing time on the dissolution time is illustrated in Fig. 5. It can be concluded that the particle size had a significant influence on the dissolution time. As the particle size decreased, the dissolution time for PLN K2SO4 and PLN K2SO4 with 0.5% STPP/4% UP decreased. In addition, additives containing 0.5% STPP/4% UP had an extremely positive effect on the decrease in the dissolution time. As the particle size decreased, the surface area significantly increased, leading to an enhanced S. As a result, the dissolution rate was enhanced.
| Size fraction (μm) | Crushing time (s) | |||
|---|---|---|---|---|
| 5 | 10 | 20 | 40 | |
| +150 | 26.16 | 14.30 | 6.78 | 2.42 |
| −150 + 74 | 14.04 | 12.95 | 10.78 | 7.36 |
| −74 | 59.80 | 72.75 | 82.44 | 90.22 |
| Total | 100.00 | 100.00 | 100.00 | 100.00 |
4 Conclusion
Water soluble potassium sulfate was successfully prepared from LN K2SO4 as the raw material. The purity of K2SO4 was nearly 100% with a yield of 36.28% after the purification process. Additionally, the rapid dissolution process for K2SO4 was realized by the addition of a 0.5% STPP/4% UP additives, which modified the surface properties of the K2SO4 particle. This modification resulted in a larger diffusion coefficient (D) and a smaller diffusion layer thickness (h) during the dissolution process. Results also demonstrated that a larger K2SO4 surface area (S) improved the dissolution rate.Conflicts of interest
There are no conflicts of interest to declare.Nomenclature
| dm/dt | Dissolution rate, kg s−1 |
| S | Surface area, m2 |
| M | Relative molecular mass, g mol−1 |
| h | Diffusion layer thickness, m |
| D | Diffusion coefficient, m2 s−1 |
| C | Concentration, mol L−1 |
| m | Mass, kg |
| t | Time, s |
| T | Temperature, °C |
Acknowledgements
The financial support for this study from the Natural Science Foundation of Hubei Province of China (2016CFA013, 2018CFB468) and Wuhan Science and Technology Bureau (2016070204020156) are gratefully acknowledged.References
- I. I. Goncharik, V. V. Shevchuk, N. P. Krut'Ko, A. D. Smychnik and O. A. Kudina, Russ. J. Appl. Chem., 2014, 87, 1804–1809 CrossRef CAS.
- K. G. Cassman, T. A. Kerby, B. A. Roberts, D. C. Bryant and S. M. Brouder, Agron. J., 1989, 6, 870–876 CrossRef.
- M. Simonsson, S. Andersson, Y. Andrist-Rangel, S. Hillier, L. Mattsson and I. Öborn, Geoderma, 2007, 140, 188–198 CrossRef CAS.
- J. Niu, W. Zhang, S. Ru, X. Chen, X. Kai, X. Zhang, M. Assaraf, P. Imas, H. Magen and F. Zhang, Field Crops Res., 2013, 140, 69–76 CrossRef.
- G. Yaldiz, Pharmacogn. Mag., 2017, 13, 102–107 CrossRef CAS PubMed.
- S. Su, H. Ma, X. Chuan and B. Cai, Int. J. Miner. Process., 2016, 155, 130–135 CrossRef CAS.
- A. V. Litvinovich, O. Y. Pavolva, A. I. Maslova and D. V. Chernov, Eurasian Soil Sci., 2006, 39, 785–791 CrossRef.
- K. Kirov, Bulg. Tyutyun, 1995, 40, 13–15 Search PubMed.
- G. I. Rumiantsev, T. M. Khodykina and V. I. Arkhangel'Skiĭ, Gig. Sanit., 1985, 8, 14–18 Search PubMed.
- S. K. Behera and R. K. Panda, Agric. Water Manag., 2009, 96, 1532–1540 CrossRef.
- S. Zhang, V. Sadras, X. Chen and F. Zhang, Field Crops Res., 2013, 151, 9–18 CrossRef.
- C. L. Liu, P. C. Jiao, M. L. Wang and Y. Z. Chen, Miner. Deposits, 2007, 26, 322–329 CAS.
- C. L. Liu, M. L. Wang and P. C. Jiao, Acta Geosci. Sin., 2009, 30, 796–802 CAS.
- M. Zheng, Y. Zhang, X. Liu, Q. I. Wen, F. Kong, N. Zhen and P. U. Linzhong, Acta Geosci. Sin., 2016, 90, 1195–1235 CrossRef.
- L. Hao, Acta Geosci. Sin., 2008, 29, 517–524 Search PubMed.
- Y. Hattori, Y. Haruna and M. Otsuka, Colloids Surf., B, 2013, 102, 227–231 CrossRef CAS PubMed.
- A. A. Noyes and W. R. Whitney, J. Am. Chem. Soc., 2002, 19, 930–934 CrossRef.
- A. Anand and G. N. Patey, J. Phys. Chem. B, 2018, 122, 1213–1222 CrossRef CAS PubMed.
- A. Dokoumetzidis, V. Papadopoulou and P. Macheras, Pharm. Res., 2006, 23, 256–261 CAS.
- A. Xiang and A. J. Mchugh, J. Membr. Sci., 2011, 366, 104–115 CrossRef CAS.
- N. Kubota, I. Uchiyama, K. Nakai, K. Shimizu and J. W. Mullin, Ind. Eng. Chem. Res., 1988, 27, 930–934 CrossRef CAS.
- N. Kubota, J. Fukazawa, H. Yashiro and J. W. Mullin, J. Cryst. Growth, 1995, 149, 113–119 CrossRef CAS.
- N. Kubota, Y. Fujisawa, M. Yokota and J. W. Mullin, J. Cryst. Growth, 1999, 197, 388–392 CrossRef CAS.
- X. Y. Ji, D. L. Chen, T. Wei, X. H. Lu, Y. R. Wang and J. Shi, Chem. Eng. Sci., 2001, 56, 7017–7024 CrossRef CAS.
- R. J. Seager, A. J. Acevedo, F. Spill and M. H. Zaman, Sci. Rep., 2018, 8, 7711 CrossRef CAS PubMed.
- O. A. Slyusar and V. M. Uvarov, Glass Ceram., 2014, 71, 140–142 CrossRef CAS.
- C. A. Hodge and T. W. Motes, Fert. Res., 1994, 39, 59–69 CrossRef CAS.
- H. Tan, Y. Guo, B. Ma, J. Huang, B. Gu and F. Zou, KSCE J. Civ. Eng., 2018, 22, 2934–2941 CrossRef.
- H. Tan, F. Zou, B. Ma, M. Liu, X. Li and S. Jian, Constr. Build. Mater., 2016, 126, 617–623 CrossRef CAS.
- S. Wu, B. Yu, Z. Wu, S. Fang, B. Shi and J. Yang, RSC Adv., 2018, 8, 8544–8551 RSC.
- J. Yu, L. Sun, C. Berrueco, B. Fidalgo, N. Paterson and M. Millan, J. Anal. Appl. Pyrolysis, 2018, 130, 127–134 CrossRef CAS.
- M. Liu, M. Shabaninejad and P. Mostaghimi, J. Pet. Sci. Eng., 2018, 170, 130–138 CrossRef CAS.
| This journal is © The Royal Society of Chemistry 2019 |

