 Open Access Article
Tunable luminescence evolution and energy transfer behavior of Na3Sc2(PO4)3:Ce3+/Tb3+/Eu3+ phosphors†
Yufeng Zhanga,
Jie Xionga,
Dingyi Shena,
Wenpeng Xiaa,
Jie Yub,
Yanfei Zhangc,
Jun Yang *a,
Shanshan Hua,
Yuxin Wand,
Haili Wend,
Hang Yed and
Yucan Liud
aSchool of Chemistry and Chemical Engineering, Southwest University, Chongqing 400715, China. E-mail: jyang@swu.edu.cn
bAcademic Affairs Office, Southwest University, Chongqing 400715, China
cSchool of Mechanical & Automotive Engineering, Qilu University of Technology, Jinan 250061, China
dChongqing Songshuqiao Middle School, Chongqing 401147, China
First published on 10th January 2019
Abstract
A series of color-tunable emitting Na3Sc2(PO4)3:Ce3+/Tb3+/Eu3+ (NSPO) phosphors were prepared by a combination of hydrothermal synthesis and low temperature calcination. The phase structure, photoluminescence and energy transfer properties of the samples were studied in detail. The tunable colors were obtained by co-doping the Tb3+ ions into the NSPO:Ce3+ or NSPO:Eu3+ phosphors with varying concentrations. Under UV excitation, the energy transfers from Tb3+ to Eu3+ in the NSPO host occurred mainly via a dipole–dipole mechanism, and the critical distances of the ion pairs (Rc) was calculated to be 17.94 Å by the quenching concentration method. And that, the emission colors of the NSPO:Tb3+,Eu3+ phosphors could be adjusted from green through yellow to red because of the energy transfer from Tb3+ to Eu3+. Based on its good photoluminescence properties and abundant emission colors, the NSPO:Ce3+/Tb3+/Eu3+ phosphors might be promising as potential candidates for solid-state lighting and display fields.
1 Introduction
When replacing cations in certain hosts, rare earth elements are important activators for modern lighting and display applications, because they have rich emission colors for spectral conversion.1–5 Recently, rare earth ion-doped inorganic materials have drawn a great deal of attention due to their many applications in optics, magnetics and catalysis.6–8 In the lighting field, compared with traditional incandescent lighting, white light-emitting diodes (w-LEDs) are favored due to their higher conversion efficiency and more flexible photometric properties.9–11 Now, the main manufacturing technology of w-LEDs relies on the combination of a blue InGaN chip and a yellow light-emitting phosphor Y3Al5O12:Ce3+ (YAG). Although this method shows high efficiency, it exhibits a high correlated color and low color rendering index (Ra < 80) because of the lack of a red component.12 Currently, a new type of w-LEDs assembly which is made by ultraviolet or near ultraviolet excitation single matrix multicolor fluorescent powders is widely used.13 Therefore, due to the need to increase the efficiency of white light emitting solid state devices, the development of the technique of combining a UV LED chip with tricolor (red, green and blue) phosphors has been proceeding. In this case, recent research has focused on finding converted luminescent phosphors with suitable emission colors, high efficiencies and high chemical stability.Researchers have studied a variety of inorganic materials, including silicates, aluminates, phosphates, nitrides, molybdates and tungstates. Among them, the rare earth ion-doped phosphate materials have attracted much attention because of their abundance, good chemical stability and low sintering temperature.14–18 Luminescence of rare earth ions in orthophosphates with the general formula MI3MII(PO4)3 or MI3MII2(PO4)3 (MI = Ca, Sr, Ba, Pb, K and Na; MII = La, Y, Gd, Sc, Bi and In) are widely researched.19–21 As early as the 1980s, scandium phosphate Na3Sc2(PO4)3 (NSPO) was reported and developed as an ion conductor.22,23 During 2013–2016, Hirohumi studied the luminescent properties of Eu2+-doped NSPO respectively.24,25 Recently, Huang's group studied the luminescent properties of Eu3+ doped NSPO phosphors and NSPO:Ce3+,Tb3+ phosphors;26,27 they also reported Dy3+ and Eu3+ co-doped NSPO phosphors.28 Among these research reports, the high temperature solid-state reaction method is the most common route to produce orthophosphates. However, it has many disadvantages such as complex experimental conditions, cumbersome procedures and high reaction temperatures (such as 1300 °C).25–31 Therefore, from the point of view of simplicity and energy saving, there is still an urgent need to develop a simple and mild solution phase method to produce pure orthophosphate micro/nanocrystals.
Luminescent lanthanide ions can be divided into two categories: 4f–4f and 5d–4f transitions, respectively. Due to the strict ban of 4f–4f transitions, their emission peak widths are very narrow and fixed. For 5d–4f transitions, the 5d orbitals are exposed to the environment and their emission spectra are strongly influenced by the host, such as the strength of the crystal field.32 We know that the energy transfer process may be affected by the presence of carrier traps or defects in the host lattice. Therefore, it is possible for the tiny dopants with different affinities to change the trap configuration and thus significantly improve the efficiency.33 It is clear that Tb3+ acts as a good sensitizer to increase the luminescence efficiency of Eu3+ ions in Na3Gd(PO4)2,34 CaYAlO4,35 SrMg2LaW2O12 (ref. 36) and Y2O3 (ref. 37) phosphors. Therefore, Tb3+ and Eu3+ ions can be used as efficient luminescent centers in real devices. Ce3+ ions with permissive 5d–4f emission transitions from 300 to 400 nm have been widely studied as efficient activators.38,39 In addition, Tb3+ may also be an important activator with only weak absorption peaks at about 300–400 nm due to the 4f–4f absorption transitions.40 Therefore, Ce3+ ions co-doped in the host can not only increase the emission intensity of Tb3+ ions but also cause excitation in the ultraviolet region of 200–400 nm, thereby overcoming the defects of the Ce3+ or Tb3+ ions doped alone. So far, many Ce3+ and Tb3+ co-doped materials have been reported including silicates, aluminates, phosphates, fluorides and oxynitrides.41–44 To the best of our knowledge, the energy transfer of Tb3+ → Eu3+ in NSPO materials by a simple method has little been reported in the previous literature.24,25,27
In this work, Tb3+–Eu3+ (Ce3+–Tb3+) co-doped NSPO phosphors were firstly synthesized by a combination of hydrothermal method and low temperature calcinations (800 °C). And we obtained tunable emission colors such as red (Eu3+), green (Tb3+), blue-violet (Ce3+), yellow (Tb3+–Eu3+) and so on. The energy transfer mechanisms, the lifetimes, luminescence properties, crystallinity and color tunability of the NSPO:Tb3+–Eu3+ phosphors were also investigated. Based on multicolor tunable luminescence, the NSPO:Ce3+/Tb3+/Eu3+ phosphors may have potential applications in the field of color displays, fluorescent lamps, solid-state lighting and UV-pumped LEDs.
2 Experimental section
2.1 Materials
The rare earth oxides including Sc2O3 (A.R.), CeO2 (99.99%), Eu2O3 (99.99%) and Tb4O7 (99.99%) were purchased from Chuandong Chemical Reagents Company (China). The raw materials sodium citrate (Na3C6H5O7·2H2O) (A.R.), sodium phosphate tribasic dodecahydrate (Na3PO4·12H2O) (A.R.) and hydrogen peroxide (H2O2) were purchased from Aladdin (China). All chemicals were used directly without further purification. The RECl3 (RE = Sc, Ce, Eu and Tb) were firstly obtained by dissolving the corresponding rare earth oxides in dilute HCl solution. In addition, it was necessary to add H2O2 when dissolving CeO2 in dilute HCl solution.2.2 Synthesis
In a typical process of preparing Na3Sc2(PO4)3 host, 2 mmol Na3C6H5O7·2H2O was added to 30 mL deionized water. After vigorous stirring for 30 min, 2 mmol ScCl3 was added into the above solution for 30 min. Then, it was kept stirring for another 30 min. Subsequently, 2 mmol Na3PO4·12H2O was added into the above reaction solution. After additional agitation for 15 min, the obtained mixing solution was transferred into a 50 ml Teflon-lined stainless steel autoclave and maintained at 180 °C for 24 h. When autoclave cooled to room temperature naturally, the obtained samples were collected by centrifugation, washed several times with deionized water and ethanol and then dried at 60 °C for 24 h. Finally, the obtained precipitates were transferred to muffle stove with the temperature at 800 °C for 2 h to get the final products Na3Sc2(PO4)3 (marked as NSPO). A series of NSPO:Ce3+/Tb3+/Eu3+ and NSPO:Tb3+,Eu3+/Ce3+,Tb3+ phosphors have been synthesized using the same method above except for different stoichiometric amounts of RECl3 (RE = Sc, Ce, Eu and Tb). Our sample synthesis has good reproducibility, which can also be seen from the XRD, SEM and PL results of the samples in the Results and discussion section.2.3 Characterization
X-ray power diffraction (XRD) measurements were performed on a Purkinje General Instrument MSALXD3 using Cu Kα radiation (λ = 0.15406 nm). The morphology analysis was carried out on a field emission scanning electron microscopy (FESEM, Hitachi, S-4800). The PL excitation and emission spectra were detected by an F-7000 spectrophotometer (Hitachi, Japan) equipped with a 150 W xenon lamp as excitation source. The decay lifetimes were measured by FLS980 (Edinburgh Instrument).3 Results and discussion
3.1 Phase, structure and morphology
The crystal structure and phase composition of the samples were studied by X-ray diffraction (XRD). Fig. 1A shows the XRD patterns of pure NSPO (a), NSPO:0.1Ce3+ (b), NSPO:0.1Tb3+ (c), NSPO:0.1Eu3+ (d), NSPO:0.1Tb3+,0.1Eu3+ (e) and NSPO:0.1Ce3+, 0.01Tb3 (f), respectively. All diffraction peaks can be attributed to the pure monoclinic NSPO phase, which is consistent with the standard card (JCPDS#44–0567). No other impurities are detected, indicating that the resulting products consist of a microscopic substructure with high crystallinity. The results show that the doped Ln3+ ions do not change the phase of the matrix significantly, and the dopant ions have been successfully dissolved in the lattice of NSPO host. It is well known that the chemical properties and ionic radius of the rare earth ions are similar, so we confirm that the Ce3+, Tb3+, Eu3+, Ce3+/Tb3+ or Tb3+/Eu3+ are well incorporated into the NSPO host lattice. It is worth noting that the characteristic diffraction peak (112) is shifted to a lower diffraction angle. This means that the incorporated ions cause the lattice to expand and the doped rare earth ions have replaced the ions in the body. This further shows that Ce3+, Tb3+ and Eu3+ are successfully constructed into NSPO host material by doping strategy. Fig. 1B presents the cell structure of the NSPO crystal and the coordination environment of cation Sc3+/Na+ with O atoms. The detailed structural parameters and crystallographic data for NSPO crystal are listed in Table S1 (ESI†). In the monoclinic NSPO structure, each Sc3+ ion is coordinated by its nearest six oxygen atoms to form a regular quadrangular pyramid where Sc3+ ion is located in the symcenter. The Na+ ion is coordinated by eight oxygen atoms. The NSPO compound with lattice constants a = b = 8.931 and c = 22.3267 crystallizes in the R![[3 with combining macron]](https://www.rsc.org/images/entities/char_0033_0304.gif) c space group. The relevant atomic parameter data are listed in Table S2 (ESI†). As shown in Fig. 1C, we found that the NSPO products are relatively uniform nanoparticles with smaller size of 300 nm comparing with the literature reports26–28 (Fig. S1, ESI†).
c space group. The relevant atomic parameter data are listed in Table S2 (ESI†). As shown in Fig. 1C, we found that the NSPO products are relatively uniform nanoparticles with smaller size of 300 nm comparing with the literature reports26–28 (Fig. S1, ESI†).
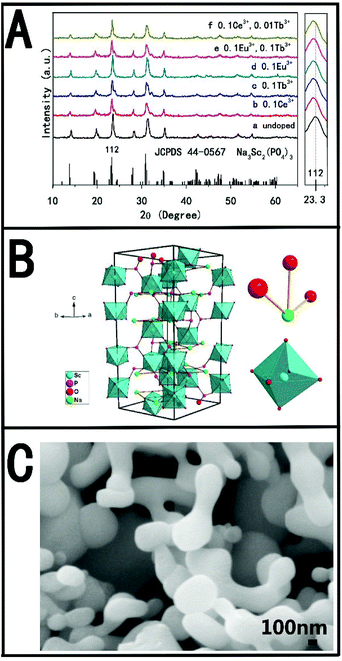 | ||
| Fig. 1 (A) XRD patterns of pure NSPO (a) and NSPO:Ln3+ (b–f); (B) the structure of the NSPO crystals and the sites of Na+ and Sc3+ polyhedrons, respectively; (C) SEM of the prepared NSPO samples. | ||
3.2 Photoluminescence properties
A series of independently doped NSPO:Ln3+ (Ln = Ce/Tb/Eu) and double doped NSPO:Ln3+ (Ln = Tb,Eu/Ce,Tb) phosphors were synthesized and their respective luminescence spectra were studied. Eu3+ ions are noted activators in various host lattices. Fig. 2a displays the PLE and PL spectra of NSPO:0.1Eu3+ phosphors. Monitored at 619 nm, the excitation spectrum includes a weak broad band at 275 nm, which can be attributed to the charge-transfer (CT) band from O2− to Eu3+ ions. There are some sharp peaks in the ultraviolet range of 300–400 nm, which can be assigned to the f → f characteristic transition of Eu3+ (7F0 → 5H5 at 323 nm, 7D0 → 5D4 at 358 nm, 5D0 → 5L7 at 380 nm and 7F0 → 5L6 at 394 nm).45 The strongest one is located at near-UV region of 394 nm which indicates that the phosphor is suitable for excitation of UV LED chips. Upon excitation at 394 nm, the PL spectrum includes two emissions peaks at 594 and 619 nm originating from the 5D0 → 7F1 and 5D0 → 7F2 transitions of Eu3+ activator, respectively. We know that the relative intensity of emission is affected obviously by the replaced position of activator Eu3+ in host lattice. The 5D0 → 7F1 transition corresponding to the magnetic dipole moment is less sensitive to the crystallographic site symmetry of activator Eu3+ than the 5D0 → 7F2 transition corresponding to the electrical dipole moment transition. Therefore, if Eu3+ occupies a high symmetry site, the 5D0 → 7F1 emission will be stronger; whereas the 5D0 → 7F2 emission dominates the emission spectrum if Eu3+ ions locate in a low symmetry site (Fig. 2a).46,47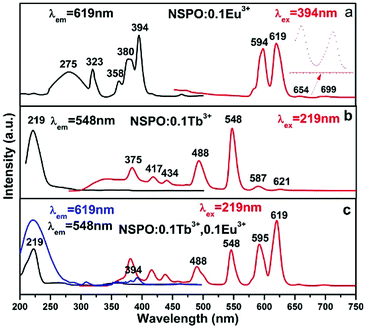 | ||
| Fig. 2 PL and PLE spectra of the NSPO:0.1Eu3+ phosphor (a), NSPO:0.1Tb3+ phosphor (b) and NSPO:0.1Tb3+,0.1Eu3+ phosphor (c), respectively. | ||
We compared the PL and PLE of the Na3Sc2(PO4)3 doped with Eu3+ by both methods (ceramic and hydrothermal) in Fig. S2 (ESI†). Under excitation of 394 nm, the PL spectra of Na3Sc2(PO4)3:Eu3+ phosphors by both methods both exhibited four characteristic emission bands with 594(593), 619(621), 654 and 699 nm corresponding to 5D0 → 7F1, 5D0 → 7F2, 5D0 → 7F3 and 5D0 → 7F4 transitions, respectively. The emission spectrum of the sample by ceramic method appears to be more refined and has higher luminous intensity at 654 and 699 nm, which can be attributed to higher crystallinity caused by the ceramic method at higher temperature. In the PLE spectra of Na3Sc2(PO4)3:Eu3+ phosphors by both methods, the broad band in the 250–300 nm region was both attributed to the CTB transition from the fully filled 2p orbitals of O2− ions to the partially filled 4f orbitals of Eu3+. Furthermore, these narrow PLE peaks located at around 323(318), 358(364), 380(384) and 394 nm were all attributed to the intra-4f transitions of Eu3+ ions from 7F0 level to 5H6, 5D4, 5L7 and 5L6 level, respectively. Compared with Fig. S2A(a),† there was no peak at 297 nm in Fig. S2B(a)† because of the overlap of the CTB band and the 7F0 → 5FJ transition of Eu3+. The excitation spectrum of the sample by ceramic method appears to be more refined, which can be also attributed to higher crystallinity caused by the ceramic method at higher temperature.
Fig. 2b shows the PLE and PL spectra of NSPO:0.1Tb3+. We know that Tb3+ has a simple 4f configuration energy level structure with low energy state 7FJ (J = 6, 5, …, 0) and excited states 5D3,4. The excitation spectrum (left) at room temperature (RT) is recorded by monitoring with bright green emission at 548 nm, which showed a strong spectral band at 219 nm owing to the 4f8 → 4f75d1 transition of the Tb3+ ions. Here, we can see several weak peaks in the range of 300–500 nm, which are caused by the spin and orbital forbidden intra-4f transitions (enlarged and shown in Fig. S3†). Excited at the wavelength of 219 nm, the NSPO:0.1Tb3+ samples have two emission groups, one is the blue emission caused by the 5D3 → 7FJ transitions, and the other is the green emission caused by the 5D4 → 7FJ transitions. Four typical transitions from 5D4 level down to 7FJ levels of 4f8 configuration of Tb3+ were observed, that is, 5D4 → 7F6 at 488 nm, 5D4 → 7F4 at 587 nm, 5D4 → 7F3 at 621 nm and 5D4 → 7F5 at 548 nm (the strongest one). Furthermore, there are three weaker emission peaks at 375 nm, 417 nm and 434 nm, which can be attributed to the 5D3 → 7F6, 5D3 → 7F5 and 5D3 → 7F4 transitions of Tb3+, respectively. The emission spectra illustrate that phosphor NSPO:0.1Tb3+ shows an intense green emission. Comparing the excitation band of NSPO:0.1Eu3+ with the emission band of NSPO:0.1Tb3+ (Fig. 2a and b), a meaningful spectral overlap was observed, which facilitated the transfer energy from Tb3+ to Eu3+.
Fig. 2c shows the PLE and PL spectra of the typical NSPO:0.1Tb3+,0.1Eu3+ sample. The excitation spectra under the detection wavelength of 619 nm and 548 nm (Fig. 2c) are both the same as the excitation spectra of the single doped Tb3+ in Fig. 2b (219 nm), indicating that double doped NSPO phosphors can be used as a green and red two-color phosphors in near-UV pumped white LEDs. On the other hand, the emission peaks of the Tb3+–Eu3+ co-doped phosphors under 219 nm excitation were observed at 619 nm (5D0–7F2) and 548 nm (5D4–7F5), which are attributed to the Eu3+ and Tb3+ ions, respectively. Moreover, 595 nm (5D0–7F1) in the orange region of Eu3+ as well as 488 nm (5D4–7F6) in the blue region of Tb3+ can be also observed in the NSPO:0.1Tb3+,0.1Eu3+ phosphors. From the Fig. 2, we can see that the co-doping of the Tb3+ ions have greatly improved the Eu3+ emission under same irradiation by comparing the emission spectra of the NSPO:0.10Tb3+,0.1Eu3+ (Fig. 2c) and NSPO:0.1Eu3+ phosphors (Fig. 2a). Most notably, the intensity of the characteristic emitter region of Tb3+ is weaker than that of Eu3+, which provides sufficient evidence for effective energy transfer from the donor Tb3+ to the receptor Eu3+. Therefore, adjusting the concentrations of the two activators can change the relative intensities of the two emissions by the principle of energy transfer, which is a viable way to get multicolor light emission.
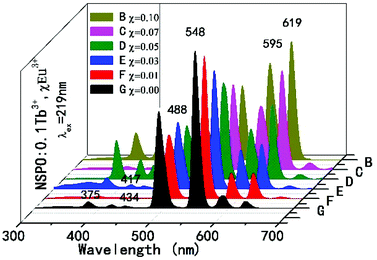
In order to further understand the energy transfer between the Tb3+ and Eu3+ ions, a series of composition-controlled samples were prepared. Fig. 3 displays the emission spectra of NSPO:0.1Tb3+,xEu3+ phosphors with x varying from 0 to 0.1. Under excitation at 219 nm UV light, the phosphors show the characteristic emissions of Tb3+ as well as sharp emission peaks of Eu3+. Keeping the concentration of Tb3+ at 0.1, the emission intensity of Eu3+ at 595/619 nm gradually increases with the increase of Eu3+ concentration, while the emission intensity of Tb3+ at 488/548 nm decreases. Under excitation of characteristic excitation peaks of Tb3+ at 219 nm, the changing of Tb3+ and Eu3+ emission relative intensity in NSPO:0.1Tb3+,xEu3+ phosphors can further prove the efficient energy transfer from Tb3+ to Eu3+ ions. In addition, the variations of the Eu3+ and Tb3+ emission intensity in NSPO:0.1Eu3+,yTb3+ phosphors is displayed in Fig. S4,† which also reflect the same result of energy transfer from Tb3+ to Eu3+.
For more directly observing the changes of relative emission intensity, Fig. 4 presents the variations of Tb3+ at 548 nm and Eu3+ at 619 nm upon changing the Eu3+ content. It is found that the emission intensity of Tb3+ ions decreases monotonically with increasing the content of the Eu3+ ions; whereas the emission intensity of Eu3+ ions as well as the energy transfer efficiency gradually increases. These results further support the generation of effective energy transfer from Tb3+ to Eu3+ ions. Here, the energy transfer efficiency (ηT) of Tb3+ → Eu3+ in the NSPO host can be estimated using the following formula:48
| ηT = 1 − IS/IS0 |
Here V is the unit cell volume, xc is the critical concentration and N refers to the number of formula units per unit cell. For the NSPO host, V = 1542.20 Å3, xc = 0.085 and N = 6. Based on the above formula, the critical distance for energy transfer is estimated to be about 17.94 Å. The value is longer than 3–4 Å, indicating that the energy transfer mechanism is controlled by electrical multipolar interaction in this system. We have further discussed the energy transfer mechanism for electrical multipolar interaction, which can be determined using the following relationship:52,53
| η0/η ∝ Cn/3 |
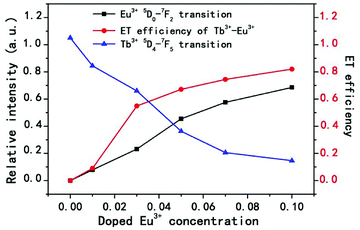 | ||
| Fig. 4 Relative emission intensities of Eu3+ at 619 nm and Tb3+ at 548 nm, and the ET efficiency of Tb3+ → Eu3+ in NSPO:0.1Tb3+,xEu3+ phosphors (x = 0–0.1). | ||
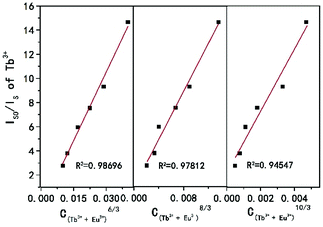 | ||
| Fig. 5 Dependence of IS0/IS of Tb3+ on C(Tb3++Eu3+)6/3, C(Tb3++Eu3+)8/3 and C(Tb3++Eu3+)10/3, respectively. | ||
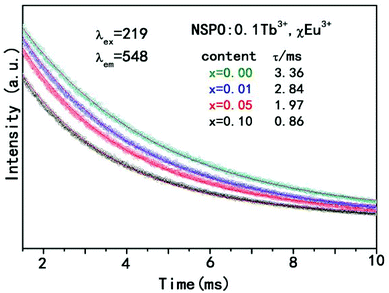
To further validate the energy transfer phenomenon, the decay curves of Tb3+ emission of NSPO:0.1Tb3+,xEu3+ (x = 0, 0.01, 0.05, 0.10) phosphors are shown in Fig. 6. We can see that all decay curves can be well fitted by the first order exponential decay method using the formula:54,55
I(t) = I0![[thin space (1/6-em)]](https://www.rsc.org/images/entities/char_2009.gif) exp(−t/τ) exp(−t/τ) |
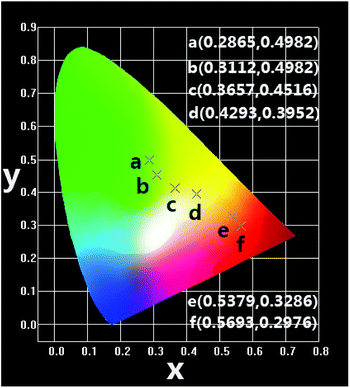 | ||
| Fig. 7 CIE chromaticity coordinates of NSPO:0.1Tb3+,xEu3+ (x = 0–0.1) phosphors under 219 nm excitation. | ||
Fig. 8 displays the PLE and PL spectra of Ce3+ or Tb3+ solely doped and Ce3+/Tb3+ co-activated NSPO phosphors. Ce3+ ions have been doped into the host as activator, and the luminescent properties have been explored. As shown in Fig. 8a, the excitation spectrum monitored at 367 nm for NSPO:0.1Ce3+ phosphors exhibit a broad band centered at 278 nm, which corresponds to the transition from the 4f state of Ce3+ ions to the excited Ce3+ ions 5d state. Under the irradiation at 278 nm, the phosphors can emit intense blue-violet light with a peak wavelength at 367 nm which can be attributed to the lowest Ce3+ 5d excited state to the ground state 2F5/2 in the Ce3+ 4f configuration. Generally, with a low doping concentration of Tb3+ in the host matrix, the character emission of Tb3+ is rather weak. Fig. 8b displays the excitation and emission spectra of NSPO:0.01Tb3+. The excitation spectrum shows a strong broad absorption band (219 nm) with shoulders at 257/273 nm arising from an allowed 4f8–4f75d transition and some weak narrow absorption peaks from 300 to 500 nm due to intra-(4f) transitions of Tb3+. The shoulders may originate from the forbidden component of the 4f8–4f75d transition.56 Based on the above PL spectrum of the Ce3+ single-doped sample and the PLE spectrum of the Tb3+ single-doped sample (Fig. 8a and b), the spectral overlap between the broad emission band of Ce3+ and the Tb3+ excitation within the spectral range of 300–400 nm. Thus, it is expected that a resonance-type ET from Ce3+ to Tb3+ may occur in the NSPO host. As shown in Fig. 8c, the PLE and PL spectra of NSPO:0.1Ce3+,0.01Tb3+ phosphors were studied. When monitored at 548 nm of Tb3+, the excitation spectrum consists of an excitation band (219 nm) of Tb3+ ions assigned to f-d transitions and a strongest excitation band (278 nm) of Ce3+ ions, indicating the possible energy transfer from Ce3+ to Tb3+ ions. Moreover, when excited at 278 nm, the PL spectra show not only the broad emission peak in the blue-violet region from the electric-dipole-allowed 4f–5d transitions of Ce3+ (367 nm), but also the strong emission of Tb3+at 488 nm and 548 nm (5D4–7FJ=6,5), which also provides another evidence for the energy transfer from Ce3+ to Tb3+. To know the energy transfer process, a series of samples with different concentrations of Ce3+ were prepared. Fig. S5† shows the emission spectrum of the NSPO:0.01Tb3+,yCe3+(y = 0, 0.05, and 0.10) phosphors upon an excitation wavelength of 278 nm. When the Tb3+ doping concentration is fixed, the Tb3+ emission intensity increases monotonously and the Ce3+ emission intensity decreases as the Ce3+ ion concentration increases. This should be due to the enhancement of energy transfer from Ce3+ ions to Tb3+ ions.
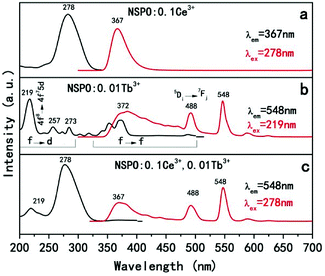 | ||
| Fig. 8 PLE and PL spectra of NSPO:0.1Ce3+ (a), NSPO:0.01Tb3+ (b) and NSPO:0.1Ce3+,0.01Tb3+ (c), respectively. | ||
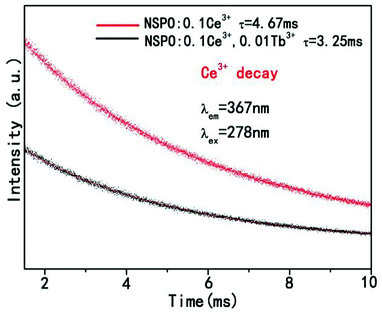
The decay curves and lifetime of Ce3+ in NSPO:0.1Ce3+,yTb3+ (y = 0, 0.01) are showed in Fig. 9 According to the decay behavior of Ce3+, their corresponding luminescence decay curve can be best fitted to the typical second-order decay method by the following equation:57
I(t) = A1![[thin space (1/6-em)]](https://www.rsc.org/images/entities/char_2009.gif) exp(−t/τ1) + A2 exp(−t/τ1) + A2![[thin space (1/6-em)]](https://www.rsc.org/images/entities/char_2009.gif) exp(−t/τ2) exp(−t/τ2) |
| τ = (A1τ12 + A2τ22)2/(A1τ1 + A2τ2) |
The lifetime of Ce3+ is 4.67 ms when doped only with Ce3+ ions in NSPO phosphors. However, the lifetime of Ce3+ decreases to 3.25 ms with the introduction of Tb3+, demonstrating the energy transfer from Ce3+ to Tb3+ by non-radiative processes.58
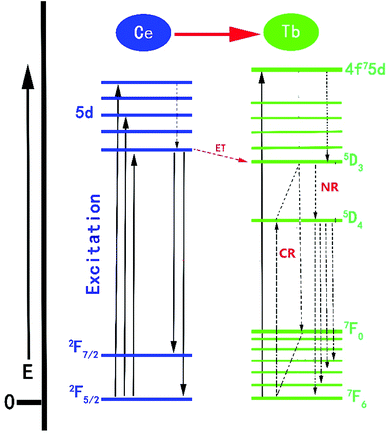
The proposed Ce3+ → Tb3+ ET process in the NSPO host is shown in Fig. 10. Firstly, Ce3+ ions can effectively absorb UV light from the ground state (2F5/2) to the excited state (5d energy levels) by UV irradiation. Secondly, these electrons relax to the lowest vibrational level of the excited state to release excess energy into the surrounding environment and then either return to the ground states to produce the Ce3+ emissions; or efficiently transfers the energy to the 5D3 level of Tb3+, followed by non-radiative relaxation to 5D4 level (5D3 + 7F6 = 5D4 + 7F0) due to the same energy difference between 5D3 → 5D4 and 7F0 → 7F6 in Tb3+ ions.56,59 Finally, as a result of the electrons moving from the 5D4 excited state to the 7FJ (J = 3, 4, 5, 6) ground state, the green light is obtained.
4 Conclusions
In summary, we have successfully synthesized a series of color tunable NSPO:Ce3+/Eu3+/Tb3+ phosphors by a combination of hydrothermal method and low temperature calcinations (800 °C). The obtained NSPO:Ce3+/Eu3+/Tb3+ phosphors were relatively uniform nanoparticles with size of 300 nm. The energy transfer of Tb3+/Eu3+ co-doping as well as their tunable multicolor luminescence in Na3Sc2(PO4)3 host lattices were realized. Due to energy transfer of Tb3+ → Eu3+, the emission colors of the resulting phosphor can be changed from green (0.2865, 0.4982) to red (0.5693, 0.2976) through yellow (0.3657, 0.4516) by adjusting the concentration of Eu3+. The obtained NSPO:Ce3+/Eu3+/Tb3+ phosphors can be promising as a potential candidate for the applications for solid-state lighting and display fields.Conflicts of interest
There are no conflicts to declare.Acknowledgements
This project is financially supported by the Fundamental Research Funds for the Central Universities (XDJK2016C147 and XDJK2018C050) and the National Natural Science Foundation of China (51302229).Notes and references
- P. Pust, V. Weiler, C. Hecht, A. Tucks, S. A. Wochnik, K. A. Henss, D. Wiechert, C. Scheu, J. P. Schmidt and W. Schnick, Nat. Mater., 2014, 13, 891–896 CrossRef CAS PubMed.
- A. A. Setlur, E. V. Radkov, C. S. Henderson, J. H. Her, A. M. Srivastava, N. Karkada, M. S. Kishore, N. P. Kumar, D. Aesram, A. Deshpande, B. L. Kolodin, S. Grigorov and U. Happek, Chem. Mater., 2010, 22, 4076–4082 CrossRef CAS.
- K. A. Denault, J. Brgoch, M. W. Gaultois, A. Mikhailovsky, R. Petry, H. Winkler, S. P. DenBaars and R. Seshadri, Chem. Mater., 2014, 26, 2275–2282 CrossRef CAS.
- Z. Ci, Q. Sun, S. Qin, M. Sun, X. Jiang, X. Zhang and Y. Wang, Phys. Chem. Chem. Phys., 2014, 16, 11597–11602 RSC.
- X. Li, F. Liu, J. Y. Howe, J. Zhang, X. J. Wang, Z. Gu, C. Sun, R. S. Meltzer and Z. Pan, Light: Sci. Appl., 2013, 2, 3250–3257 Search PubMed.
- Y. Q. Li, A. C. A. Delsing, G. D. With and H. T. Hintzen, Chem. Mater., 2005, 17, 3242–3248 CrossRef CAS.
- K. Hanaoka, K. Kikuchi, T. Terai, T. Komatsu and T. Nagano, Chemistry, 2008, 14, 987–995 CrossRef CAS PubMed.
- C. H. Liang, F. B. Li, C. S. Liu, J. Lu and X. G. Wang, Dyes Pigm., 2008, 76, 477–488 CrossRef CAS.
- H. A. Höppe, Angew. Chem., Int. Ed., 2009, 48, 3572–3582 CrossRef PubMed.
- E. F. Schubert and J. K. Kim, Science, 2005, 308, 1274–1278 CrossRef CAS PubMed.
- T. Justel, H. Nikol and C. Ronda, Angew. Chem., 1998, 37, 3084–3103 CrossRef CAS.
- W. Y. Tian, K. X. Song, F. F. Zhang, P. Zheng, J. X. Deng and J. Jiang, et al., J. Alloys Compd., 2015, 638, 249–253 CrossRef CAS.
- Z. G. Xia, H. Y. Du, J. Y. Sun, D. M. Chen and X. F. Wang, Mater. Chem. Phys., 2010, 119, 7–10 CrossRef CAS.
- J. K. Sheu, S. J. Chang, C. Kuo, Y. K. Su, L. Wu, Y. Lin, W. Lai, J. Tsai, G.-C. Chi and R. Wu, IEEE Photonics Technol. Lett., 2003, 15, 18–20 Search PubMed.
- T. S. Chan, R. S. Liu and I. Baginskiy, Chem. Mater., 2008, 20, 1215–1217 CrossRef CAS.
- N. Guo, W. Lü, Y. Jia, W. Lv, Q. Zhao and H. You, ChemPhysChem, 2013, 14, 192–197 CrossRef CAS PubMed.
- D. Geng, M. Shang, Y. Zhang, H. Lian and J. Lin, Inorg. Chem., 2013, 52, 13708–13718 CrossRef CAS PubMed.
- W. Wu and Z. Xia, RSC Adv., 2013, 3, 6051–6057 RSC.
- C. C. Lin, C. C. Shen and R. S. Liu, Chem.–Eur. J., 2013, 19, 15358–15365 CrossRef CAS PubMed.
- H. B. Liang, Y. Tao, J. H. Xu, H. He, H. Wu and W. X. Chen, J. Solid State Chem., 2004, 117, 901–908 CrossRef.
- Z. J. Wang, S. Q. Lou and P. L. Li, J. Alloys Compd., 2014, 586, 536–541 CrossRef CAS.
- V. V. Tkachev, V. I. Ponomarev and L. O. Atovmyan, Zhurnal Strukturnoj Khimii, 1984, 25, 128–134 CAS.
- B. I. Lazoryak, V. B. Kalinin, S. Y. Stefanovich and V. A. Efremov, Dokl. Akad. Nauk SSSR, 1980, 250, 861–864 CAS.
- N. Guo, Y. H. Zheng, Y. C. Jia, H. Qiao and H. P. You, J. Phys. Chem. C, 2012, 116, 1329–1334 CrossRef CAS.
- K. Hirohumi, Master thesis, Niigata University, 2013.
- H. Guo, X. Y. Huang and Y. J. Zeng, J. Alloys Compd., 2018, 741, 300–306 CrossRef CAS.
- H. Guo, B. Devakumar, B. Li and X. Y. Huang, Dyes Pigm., 2018, 151, 81–88 CrossRef CAS.
- R. Vijayakumar, H. Guo and X. Y. Huang, Dyes Pigm., 2018, 156, 8–16 CrossRef CAS.
- X. C. Wang, Z. Y. Zhao, Q. S. Wu, C. Wang, Q. Wang, Y. Y. Li and Y. H. Wamg, J. Mater. Chem. C, 2016, 4, 8795–8801 RSC.
- Y. S. Liu, D. T. Tu, H. M. Zhu and X. Y. Chen, Chem. Soc. Rev., 2013, 42, 6924–6958 RSC.
- X. Teng, Y. H. Zhu, W. Wei, S. C. Wang, J. F. Huang, R. Naccache, W. B. Hu, A. L. Y. Tok, Y. Han, Q. C. Zhang, Q. Y. Fan, W. Huang, J. A. J. Capobianco and L. Huang, J. Am. Chem. Soc., 2012, 134, 8340–8343 CrossRef CAS PubMed.
- Y. J. Ding, X. Teng, H. Zhu, L. L. Wang, W. B. Pei, J. J. Zhu, L. Huang and W. Huang, Nanoscale, 2013, 5, 11928–11932 RSC.
- H. Y. Jiao and Y. H. Wang, J. Electrochem. Soc., 2009, 156, 117–120 CrossRef.
- H. Yamamoto and K. Urade, J. Electrochem. Soc., 1982, 129, 2069–2074 CrossRef CAS.
- D. Wang, Y. Wang and J. W. He, Mater. Res. Bull., 2012, 47, 142–145 CrossRef CAS.
- D. Q. Geng, G. G. Li, M. M. Shang, C. Peng, Y. Zhang, Z. Y. Cheng and J. Lin, Dalton Trans., 2012, 41, 3078–3086 RSC.
- K. Pavani, J. Suresh Kumar and L. Rama Moorthy, J. Alloys Compd., 2014, 586, 722–729 CrossRef CAS.
- M. Back, M. Boffelli, A. Massari, R. Marin, F. Enrichi and P. Riello, J. Nanopart. Res., 2013, 15, 1753–1758 CrossRef.
- N. Guo, Y. H. Song, H. P. You, G. Jia, M. Yang and K. Liu, et al., Eur. J. Inorg. Chem., 2010, 29, 4636–4642 CrossRef.
- W. P. Chen, H. B. Liang, B. Han, J. P. Zhong and Q. Su, J. Phys. Chem. C, 2009, 113, 17194–17199 CrossRef CAS.
- J. Ding, Q. Zhang, J. Cheng and X. Liu, J. Alloys Compd., 2010, 495, 205–208 CrossRef CAS.
- Z. G. Xia and R. S. Liu, J. Phys. Chem. C, 2012, 116, 15604–15609 CrossRef CAS.
- L. E. Muresan, Y. Karabulut, A. I. Cadis, I. Perhaita, A. Canimoglu and J. Garcia Guinea, J. Alloys Compd., 2016, 658, 356–366 CrossRef CAS.
- Q. H. Zhang, H. Y. Ni, L. L. Wang and F. M. Xiao, Ceram. Int., 2016, 42, 6115–6120 CrossRef CAS.
- Z. F. Yang, Y. H. Hu, L. Chen, X. J. Wang and G. F. Ju, Mater. Sci. Eng,. B: Solid State. Mater. Adv. Technol., 2015, 193, 27–31 CrossRef CAS.
- L. Macalik, P. E. Tomaszewski, R. Lisiecki and J. Hanuza, J. Solid State Chem., 2008, 181, 2591–2600 CrossRef CAS.
- Z. X. Tao, T. Tsuboi, Y. L. Huang, W. Huang, P. Q. Cai and H. J. Seo, Inorg. Chem., 2014, 53, 4161–4168 CrossRef CAS PubMed.
- S. Y. Xin, Y. H. Wang, G. Zhu, X. Ding, W. Y. Geng and Q. Wang, Dalton Trans., 2015, 44, 16099–16106 RSC.
- P. I. Paulose, G. Jose, V. Thomas, N. V. Unnikrishnan and M. K. R. Warrier, J. Phys. Chem. Solids, 2003, 64, 841–846 CrossRef CAS.
- R. Reisfeld, E. Greenberg, R. Velapoldi and B. Barnett, J. Chem. Phys., 1972, 56, 1698–1705 CrossRef CAS.
- B. M. Antipeuko, I. M. Bataev, V. L. Ermolaev, E. I. Lyubimov and T. A. Privalova, Opt. Spectrosc., 1970, 29, 177–184 Search PubMed.
- G. Blasse, J. Solid State Chem., 1986, 62, 207–211 CrossRef CAS.
- H. Jiao, F. Liao, S. Tian and X. J. Jing, J. Electrochem. Soc., 2003, 150, 220 CrossRef.
- D. L. Dexter and J. A. Schulman, J. Chem. Phys., 1954, 22, 1063–1070 CrossRef CAS.
- Z. G. Xia, J. Q. Zhuang, A. Meijerink and X. P. Jing, Dalton Trans., 2013, 42, 6327–6336 RSC.
- J. Hao, S. A. Studenikin and M. Cocivera, J. Appl. Phys., 2001, 90, 5064–5069 CrossRef CAS.
- H. L. Li, Z. L. Wang, S. J. Xu and J. H. Hao, J. Electrochem. Soc., 2009, 156, 112–116 CrossRef.
- J. Y. Sun, X. Y. Zhang, Z. G. Xia and H. Y. Du, Mater. Res. Bull., 2011, 46, 2179–2182 CrossRef CAS.
- D. W. Wen and X. J. Shi, Dalton Trans., 2013, 42, 16621–16629 RSC.
Footnote |
| † Electronic supplementary information (ESI) available. See DOI: 10.1039/c8ra07827k |
| This journal is © The Royal Society of Chemistry 2019 |

