
 Open Access Article
 This Open Access Article is licensed under a
 Creative Commons Attribution 3.0 Unported Licence
Enhanced antibacterial properties of biocompatible titanium via electrochemically deposited Ag/TiO2 nanotubes and chitosan–gelatin–Ag–ZnO complex coating
Linling Yin†
a,
Zhenxuan Fu†c,
Yuan Lib,
Bin Liuc,
Zongjian Lina,
Jiayu Lua,
Xu Chenc,
Xiaopeng Han b,
Yida Dengb,
Wenbin Hub,
Derong Zou*a and
Cheng Zhong*b
b,
Yida Dengb,
Wenbin Hub,
Derong Zou*a and
Cheng Zhong*b
aDepartment of Stomatology, Shanghai Jiao Tong University Affiliated Sixth People's Hospital, Shanghai, 310000, China. E-mail: drzou@sjtu.edu.cn
bKey Laboratory of Advanced Ceramics and Machining Technology (Ministry of Education), Tianjin Key Laboratory of Composite and Functional Materials, School of Materials Science and Engineering, Tianjin University, Tianjin 300072, China. E-mail: cheng.zhong@tju.edu.cn
cState Key Laboratory of Metal Matrix Composites, Shanghai Jiao Tong University, Shanghai, 200240, China
First published on 5th February 2019
Abstract
A novel double-layered antibacterial coating was fabricated on pure titanium (Ti) via a simple three-step electrodeposition process. Scanning electronic microscopy (SEM) images show that the coating was constructed with the inner layer of TiO2 nanotubes doped with silver nanoparticles (TNTs/Ag) and the outer layer of chitosan–gelatin mixture with zinc oxide and silver nanoparticles (CS–Gel–Ag–ZnO). In comparison, we also investigated the composition, structure and antibacterial properties of pure Ti coated with TNTs, TNTs/Ag or TNTs/Ag + CS–Gel–Ag–ZnO, respectively. The TNTs was about 100 nm wide and 240 nm to 370 nm tall, and most Ag nanoparticles (Ag NPs) with diameter smaller than 20 nm were successfully deposited inside the tubes. The CS–Gel–Ag–ZnO layer was continuous and uniform. Antibacterial activity against planktonic and adherent bacteria were both investigated. Agar diffusion test against Staphylococcus aureus (S. aureus) shows improved antibacterial capacity of the TNTs/Ag + CS–Gel–Ag–ZnO coating, with a clear zone of inhibition (ZOI) up to 14.5 mm wide. Dead adherent bacteria were found on the surface by SEM. The antibacterial rate against planktonic S. aureus was as high as 99.2% over the 24 h incubation period.
1. Introduction
Titanium (Ti) and its alloys as biomedical materials have gained much attention over recent decades due to their superior biocompatibility as well as low cytotoxicity, high wear and corrosion resistance, and high fatigue strength.1 More importantly, the relatively low modulus of elasticity compared with biomedical stainless steels and cobalt-based alloys could effectively reduce the stress shielding caused by the mismatch in modulus between bone and implant.2–4 Therefore, Ti and its alloys are primarily used as orthopedic and dental implants.5–10 Besides, the relative inactivity of Ti in human body environment and its capability of osseointegration make Ti-based materials possible for long-term implantation.1,4,11–14 Unfortunately, such biocompatibility also gives rise to bacterial adhesion which could cause severe post-surgical infections.15Many surface modification techniques have been promoted to enhance the antibacterial property of Ti and its alloys.14–21 According to the antibacterial agent and mechanism, these techniques can be categorized as: antibiotic modification, non-antibiotic antimicrobial modification, and anti-adhesion modification.20 Among the many non-antibiotic antimicrobial agents, silver (Ag) is believed to be one of the strongest with a broad spectrum of antibacterial activities.22–27 Depending on the modification process, Ag can be introduced as either metallic or ionic state.28 Silver nanoparticles (Ag NPs) outreach other existing form of Ag in that the extremely large surface area and small particle size render them highly reactive with proteins and DNAs and easy to penetrate the cell wall of bacteria.26 However, silver nanoparticles are reported to be cytotoxic due to the burst release of Ag ions.15
A common approach is to load Ag NPs onto Ti which has a modified surface structure. As it is difficult for body fluids to infiltrate into the complex structure of the host, slow Ag ions release and consequently controlled cytotoxicity are expected. In our previous work,29 TiO2 nanotubes (TNTs) on Ti foil was successfully prepared through electrochemical deposition process. One advantage of such structure is that vertically aligned TNTs are of considerably high surface area,30,31 where the Ag NPs are more dispersive than on flat surfaces. As a result, Ag NPs are potentially highly available whilst keeping a long-lasting antibacterial activity. However, the release rate of Ag ions in TNTs/Ag is not efficiently high due to the complex structure of TNTs, limiting the antibacterial performance of the coating. Amin Yavari et al.32 developed a porous Ti implant coated with Ag-doped TNTs. The Ag ion concentration during in vitro test dropped sharply after 3 days. Consequently, antibacterial rates against planktonic and adherent bacteria both dropped. In addition, Zhao et al.33 prepared Ag NPs loaded TNTs with different diameters via anodization and heat treatment followed by photo-reduction. The antibacterial rate against S. aureus after 24 h incubation was up to 82.9% (in the dark) demonstrating a limited antibacterial rate.
Another approach is to dope Ag NPs in polymer matrix to form continuous coatings. Chitosan (CS) is a kind of antimicrobial polymers that is frequently employed as scaffold and implant coating material.34 For instance, Li et al.15 fabricated CS/Ag complex coatings on NiTi alloy via electrochemical codeposition. They compared the antibacterial properties of Ag, CS and CS/Ag coated Ti and found that antibacterial rates of Ag and CS were very close, whereas the CS/Ag coating exhibited strongest antibacterial activity due to the highest release rate of Ag ions. CS is compatible with human cells due to its molecule structure similar to those of hyaluronic acid and glycosaminoglycan extracellular matrix molecules.12 Regiel et al.21 studied the influence of CS on the formation of Ag NPs. They found that a high deacetylation degree could help nucleation and prevent agglomeration so as to form small and dispersed Ag NPs. In addition, CS is pH-dependent soluble so as to keep an efficient release rate of Ag NPs or Ag ions. Given the intrinsic biocompatibility and antibacterial nature of CS, it is hence desirable to incorporate Ag NPs into CS to enhance the antibacterial property whereas reducing the cytotoxicity of Ag NPs and retaining biocompatibility.
Compared with CS/Ag coating, although the TNTs/Ag coating is possible to suffer from limited biocompatibility for the higher exposure of reactive Ag-NPs, it is remarkable for a larger Ag capacity. Therefore, in the present work, we propose a novel hierarchical structure combining TNTs and the biocompatible CS to ensure both the durability and biocompatibility. The composite structure and the complex coatings in our work provide a combination of several advantages. First, the combined coating was fabricated on pure Ti via a simple three-step electrodeposition process, where in the last step CS + Gel + Ag-NPs + ZnO-NPs are co-electrodeposited onto TNTs/Ag layer. The electrochemical deposition as an in situ formation technique is especially suitable for biomedical implants due to the good adherence and high purity at the coating/substrate interface. Second, in the present work, Ag nanoparticles were grown inside TNTs by simple electrodeposition method with the size of less than 20 nm. Third, the complex coatings in our work are combined with several compositions with antibacterial activity and can play the synergistic role for further enhancing the activity. Gelatin (Gel) is added into the CS-based composites for rigid adhesion between CS and TNTs. To further increase the antibacterial activity of the coatings, ZnO nanoparticles, another strong non-toxic bactericide35 is introduced into the chitosan matrix. It was found that ZnO and Ag could mutually enhance the antimicrobial activities through synergistic effect.36 In addition, ZnO nanoparticles are more effective against Gram-positive bacteria like S. aureus than Gram-negative ones, such as Escherichia coli, whereas Ag nanoparticles are the opposite,35 which makes the bactericidal effect of Ag/ZnO nanohybrid even enhanced. Due to the intrinsic antibacterial activity against planktonic bacteria of the CS, ZnO and Ag NPs, and the synergistic effect between ZnO and Ag, the novel composite coating in our work reaches a significantly high antibacterial rate of 99.2%, which shows the promising applications in the fields of orthopedic and dental implants. The Ti substrates coated with anodic TNTs/Ag complex, and TNTs/Ag + CS–Gel–Ag–ZnO were separately prepared and characterized by scanning electron microscopy (SEM), energy dispersive X-ray (EDX) spectroscopy, X-ray diffraction (XRD), and X-ray photoelectron spectroscopy (XPS). The adhesion strengths of the coatings were investigated by cross-cut tape test. The in vitro antibacterial properties of the four samples (including one bare Ti as the control) were investigated by agar diffusion method and plate counting method, and their results are presented in the form of inhibition zones, SEM micrographs and antibacterial rates.
2. Experimental
2.1 Sample preparation
![[thin space (1/6-em)]](https://www.rsc.org/images/entities/char_2009.gif) :HNO3 = 1:3 vol) for a few seconds to remove the oxidized layer.
:HNO3 = 1:3 vol) for a few seconds to remove the oxidized layer.2.2 Characterization
 | (1) |
3. Results and discussion
3.1 Surface morphology and structural characterizations
 | ||
| Fig. 1 SEM micrographs of the TNTs on Ti substrate: surface morphology with (a) low and (b) high magnification, and cross-sectional morphology of TNTs with (c) low and (d) high magnification. | ||
 | ||
| Fig. 2 SEM micrographs of the TNTs loaded with Ag NPs: (a) surface morphology from top view and corresponding EDS results where quantitative composition data are enclosed, and cross-sectional morphology with (b) low and (c) high magnifications and (d) corresponding Ag nanoparticle size distribution histogram. | ||
 | ||
| Fig. 3 SEM micrographs of TNTs/Ag coated (a) with CS–Gel and (b) with TNTs/Ag + CS–Gel–Ag–ZnO composite. | ||
Fig. 4 shows the EDS results of TNTs/Ag + CS–Gel and TNTs/Ag + CS–Gel–Ag–ZnO coatings. In Fig. 4a and b, the gold (Au) content come from the sprayed Au in preparation of samples for SEM observation. In comparison to the TNTs/Ag coating, carbon (C) and nitrogen (N) elements are found in the two complex coatings, in accordance with the existence of CS and Gel. The C and N contents in the results obtained by EDS method were just for qualitatively analysing since EDS measurements have the limitation for quantitative determination of the light elements.39,40 Ti is still found in the two coatings since the stimulated X-ray used for EDS measurement came from the area up to several micrometers deep. It can be seen in Fig. 4d and e, both the thickness of the layer of TNTs/Ag + CS–Gel and TNTs/Ag + CS–Gel–Ag–ZnO is less than 2 μm, which is thin enough for the detection of X-ray from the Ti element. The Ag–ZnO free coating where the pre-deposited Ag in TNTs should be the only source of Ag exhibited lowest Ag contents (only 0.39 at%), whilst the Ag–ZnO containing coating contained 1.32 at% Ag, still lower than the 2.58 at% Ag content in the TNTs/Ag coating (Fig. 2a). In addition, Zn occurred in the TNTs/Ag + CS–Gel–Ag–ZnO coating and its content was about 11.74 at%. For further investigating the distribution of elements on the TNTs/Ag + CS–Gel–Ag–ZnO coating, its EDS mapping images were given in Fig. 4c. The EDS mapping images exhibit uniformly distributed C, N, O, Zn and Ag, which indicates that ZnO and Ag NPs were highly dispersive throughout the whole surface.
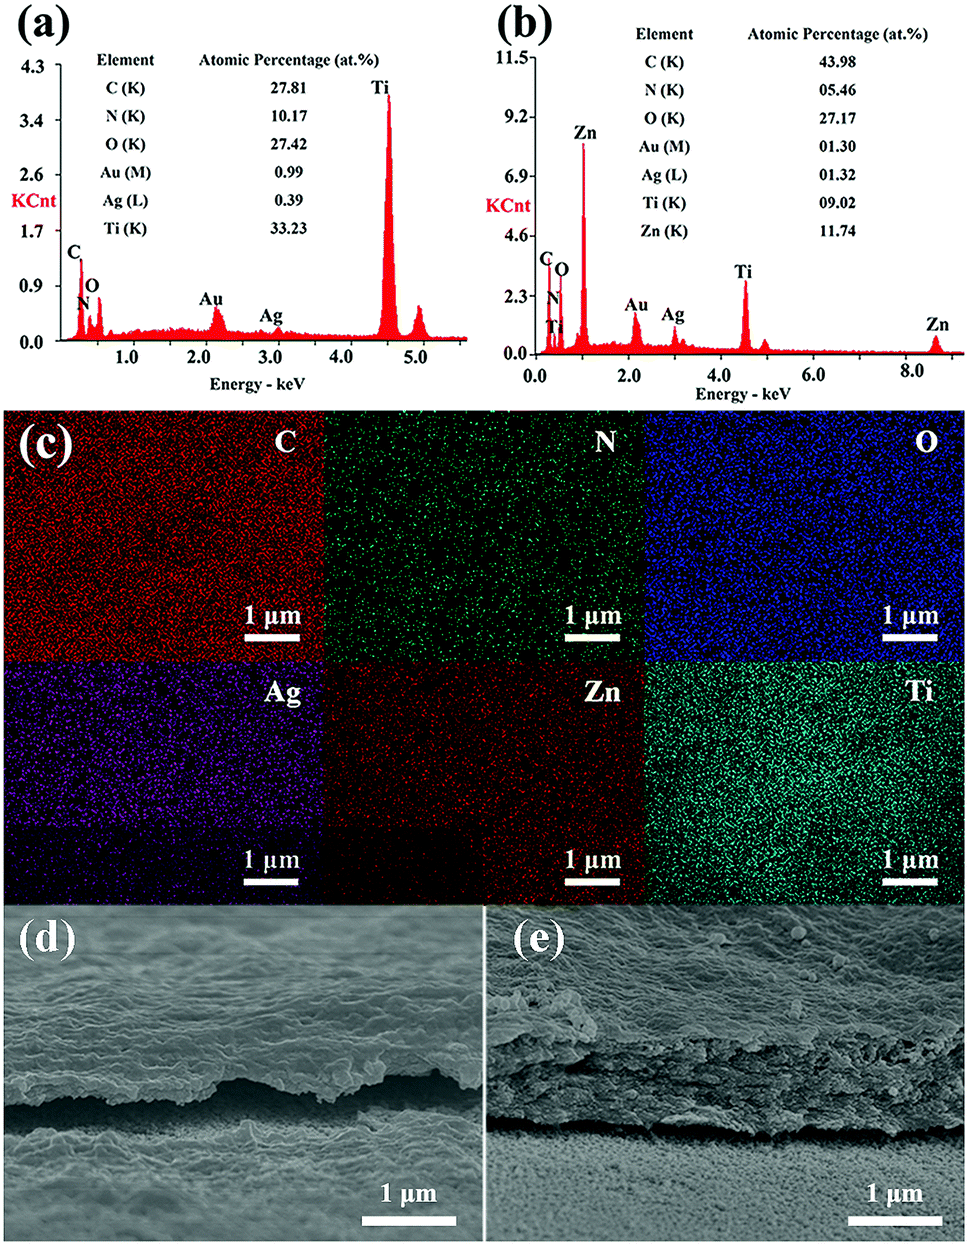 | ||
| Fig. 4 EDS point scanning spectra with quantitative composition data for the (a) TNTs/Ag + CS–Gel and (b) TNTs/Ag + CS–Gel–Ag–ZnO complex coatings and (c) corresponding EDS mappings for the latter of the area of interest and cross-sectional SEM images of (d) TNTs/Ag + CS–Gel and (e) TNTs/Ag + CS–Gel–Ag–ZnO. | ||
Besides, to analyse the contents of Ag and Zn in the TNTs/Ag + CS–Gel–Ag–ZnO complex coating, XPS measurements were carried out. According to the results in Table 1, the contents of Ag, Zn, C, N, and O in the coating are 1.91 at%, 10.93 at%, 55.47 at%, 10.31 at%, and 21.38 at%, respectively. In addition, the C, N and O element contents of TNTs/Ag + CS–Gel from XPS are 72.38 at%, 13.52 at%, and 14.10 at%, respectively. Compared with TNTs/Ag + CS–Gel, the TNTs/Ag + CS–Gel–Ag–ZnO coating exhibits additional Ag and Zn contents, which demonstrates that Ag and Zn have been successfully co-deposited with CS and Gel.
| Samples | Ag (at%) | Zn (at%) | C (at%) | N (at%) | O (at%) |
|---|---|---|---|---|---|
| TNTs/Ag + CS–Gel–Ag–ZnO | 1.91 | 10.93 | 55.47 | 10.31 | 21.38 |
| TNTs/Ag + CS–Gel | — | — | 72.38 | 13.52 | 14.10 |
The XRD spectra of bare and coated Ti samples are shown in Fig. 5. The peaks of the bare Ti (marked black) are coincident with the XRD pattern of α-Ti, with the first three characteristic peaks at 2θ = 35.2°, 38.5° and 40.2°. The position and intensity of substrate Ti peaks remain stable at coated samples. A new peak at about 2θ = 25.4° occurs in the spectrum of calcinated Ti (marked red), which is attributed to anatase TiO2. Freshly deposited TNTs via anodization process are amorphous with no peaks in the XRD results. After calcinated at 450 °C in nitrogen atmosphere, the amorphous TiO2 converts to crystallize TiO2 with the peak at about 2θ = 25.4°, indicating that the TNTs are successfully formed by the simple electrodeposition process. There are two broad peaks at 2θ = 11.8° and 20.4° in the XRD pattern of TNTs/Ag + CS–Gel coating (marked pink), corresponding to the semi-crystalline nature of chitosan. The peaks are wider when compared to the XRD pattern of pure chitosan, which should be caused by the presence non-crystalline gelatin that reduced the crystallinity of the blending. ZnO were found in the TNTs/Ag + CS–Gel–Ag–ZnO coating for the unique peaks occurring at around 2θ = 31.9°, 36.3° and 56.6° in the spectrum (marked green). On the other hand, the characteristic peaks of Ag were found neither in the TNTs/Ag or TNTs/Ag + CS–Gel–Ag–ZnO coated samples. We suppose that the Ag content was too scarce to be detected by XRD, though it was detectable for EDS.
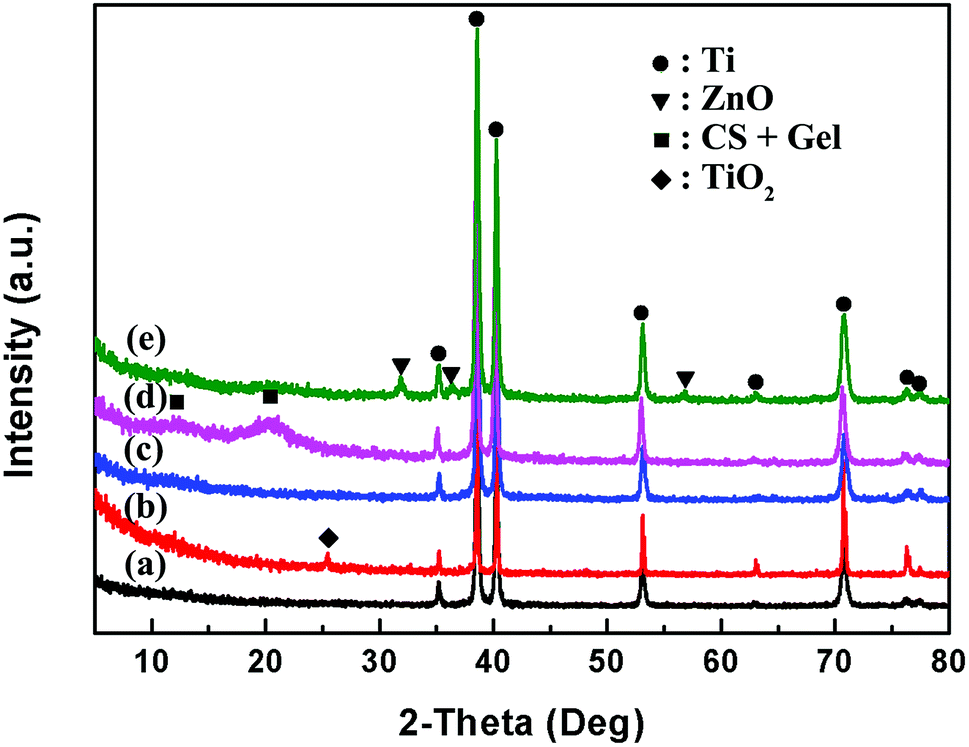 | ||
| Fig. 5 XRD spectra of (a) Ti, (b) TNTs coating after calcination at 450 °C, (c) TNTs/Ag coating, (d) TNTs/Ag + CS–Gel and (e) TNTs/Ag + CS–Gel– Ag–ZnO complex coatings. | ||
XPS spectra of TNTs/Ag on Ti samples with and without CS–Gel–Ag–ZnO coating were provided as Fig. 6 XPS is a semi-quantitative tool frequently used for characterizing the species and chemical states of elements on the surface. Fig. 6a and c show full-scale scans for the two samples from 0 to 1300 eV binding energy. The peaks of O 1s, Ti 2p and Ag 3d occurred in the spectrum of TNTs/Ag, and peaks of Zn 2p, O 1s, N 1s, Ag 3d were detected in the spectrum of TNTs/Ag + CS–Gel–Ag–ZnO. For the TNTs/Ag + CS–Gel–Ag–ZnO, it is obvious that the signal of Ti disappeared and a new N signal corresponding to CS occurred. Therefore, the TNTs/Ag layer was successfully covered by the CS–Gel–Ag–ZnO coating, which was continuous and undestroyed. Fig. 6c shows the narrow scan of Ag 3d peaks of TNTs/Ag. The Ag 3d5/2 peak occurred at 367.8 eV, and the Ag 3d3/2 peak occurred at 373.8 eV, 6.0 eV higher than the d5/2 peak. These values highly match the XPS data of metallic Ag, hence indicating merely physical bond of Ag NPs with the TNTs. Fig. 6d shows the narrow scan at Ag peaks of TNTs/Ag + CS–Gel–Ag–ZnO. The 3d5/2 peak occurred at 367.99 eV, and the 3d3/2 peak occurred at 374 eV. While the peak interval almost equal to the value of TNTs/Ag, the two peaks slightly shifted toward high binding energy, suggesting there were electron transfers between Ag and other electron donors. Thus Ag could be either bonded with ZnO or chelated with CS.41 The narrow scan at Zn 2p peaks (Fig. 6e) shows that the Zn 2p3/2 was at 1021.74 eV and Zn 2p1/2 was at 1044.85 eV, which should be the pattern of ZnO. Therefore, ZnO was successfully co-deposited with CS and Gel.
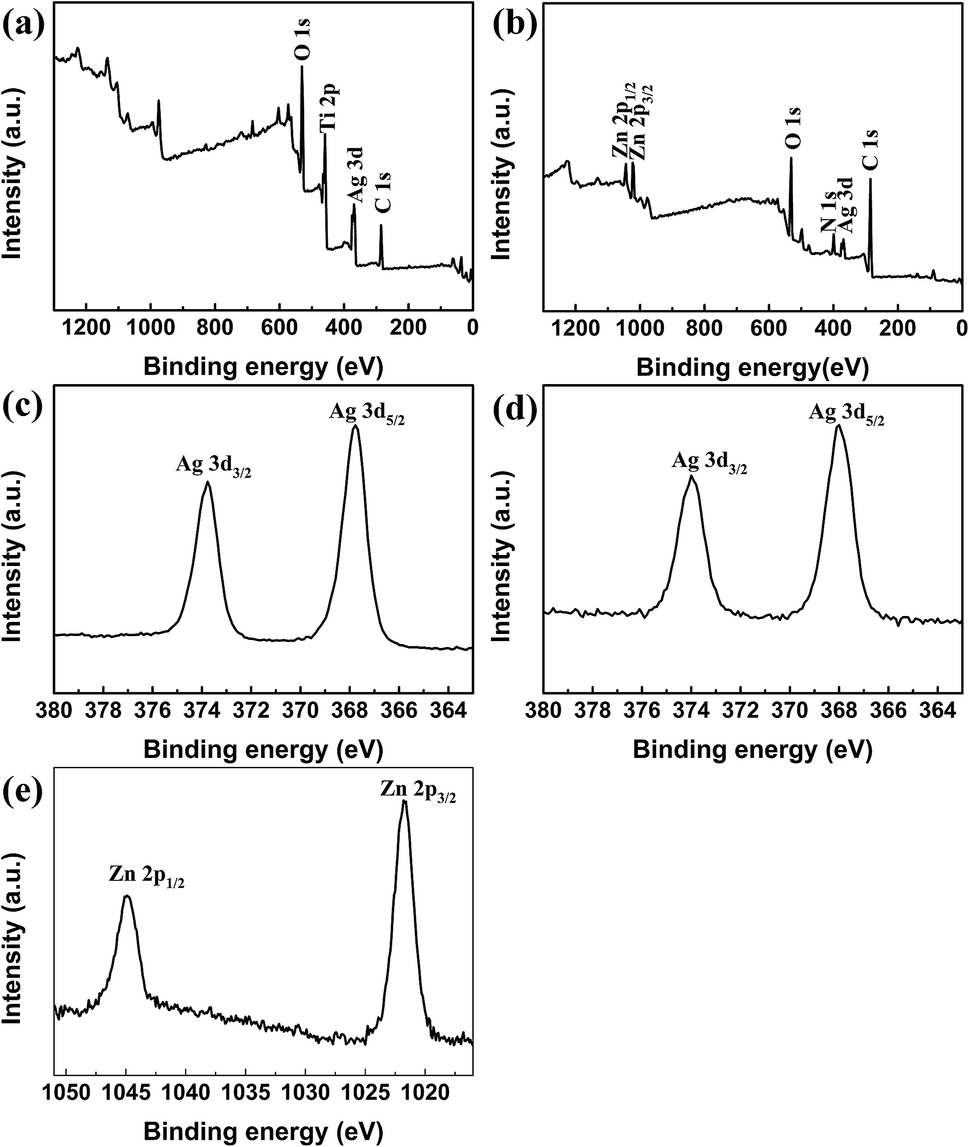 | ||
| Fig. 6 XPS spectra of Ti samples coated with (a) TNTs/Ag and (b) TNTs/Ag + CS–Gel–Ag–ZnO and narrow scans for (c) Ag 3d peaks of TNTs/Ag and (d) Ag 3d and (e) Zn 2p peaks of TNTs/Ag + CS–Gel–Ag–ZnO coating. | ||
3.2 Adhesion strength
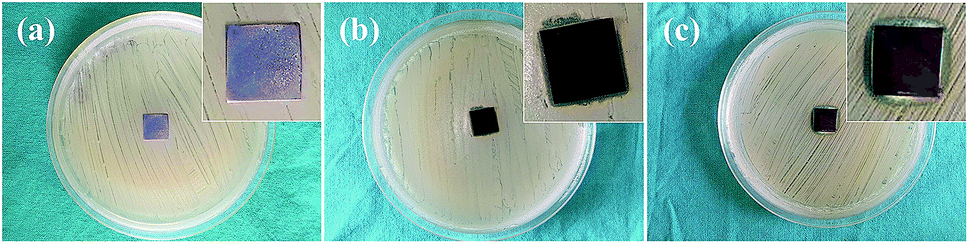
The adhesion strengths of the TNTs, TNTs/Ag and TNTs/Ag + CS–Gel–Ag–ZnO coatings were separately tested by cross-cut tape test. Fig. 7 shows the optical images of the coatings' surfaces before and after the test, and the results are listed in Table 2. After the test, no damages occurred on both the TNTs and TNTs/Ag coatings, indicating excellent adhesion strength between the TNTs and the substrate. This is because TNTs were generated from the substrate during the electrochemical anodization process, and that tube walls are condensed (as Fig. 1c and d show). As we can see from the SEM cross-sectional graphs (Fig. 2b and c), Ag NPs are mostly deposited inside the TNTs, so that the additional Ag NPs will not change the adherence feature of the coating. The TNTs/Ag + CS–Gel–Ag–ZnO coating, however, was not as firm as the other two. The original surface of TNTs/Ag + CS–Gel–Ag–ZnO coated pure Ti, as Fig. 7c shows, was dark brown. After the test, some grids were damaged, and as Fig. 7f shows, their colour slightly turned red. Based on the number of damaged grids, the percentage of damaged area was about 52.8%. According to the ASTM D 3359-02, the adhesion strength of TNTs and TNTs/Ag both reaches 5B, and the adhesion strength of TNTs/Ag + CS–Gel–Ag–ZnO fits in the class of 1B. Considering the microstructure of TNTs, such adherence is probably owing to the large interface area between TNTs and CS–Gel.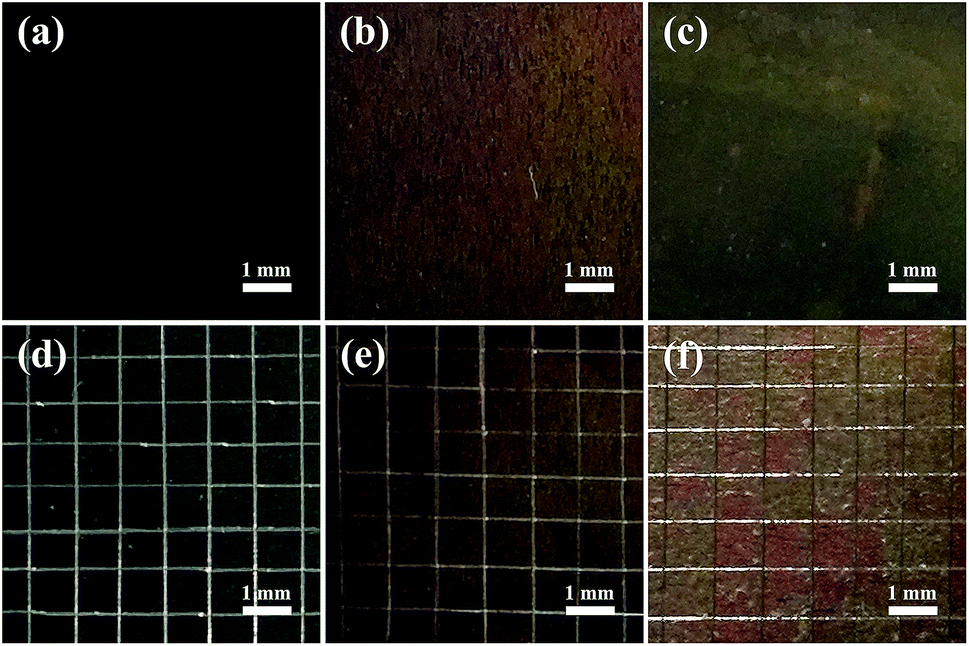 | ||
| Fig. 7 Optical images of the original coatings and the coatings after cross-cut tape test for (a and d) TNTs, (b and e) TNTs/Ag and (c and f) TNTs/Ag + CS–Gel–Ag–ZnO coated Ti samples. | ||
| Sample coating | Damaged area (approx. %) | Adhesion strength class |
|---|---|---|
| TNTs | 0 | 5B |
| TNTs/Ag | 0 | 5B |
| TNTs/Ag + CS–Gel–Ag–ZnO | 52.8 | 1B |
3.3 In vitro antibacterial properties
 | ||
| Fig. 8 Photographs and close-up images of the ZOI for (a) TNTs, (b) TNTs/Ag and (c) TNTs/Ag + CS–Gel–Ag–ZnO coated Ti samples after agar diffusion test against S. aureus. | ||
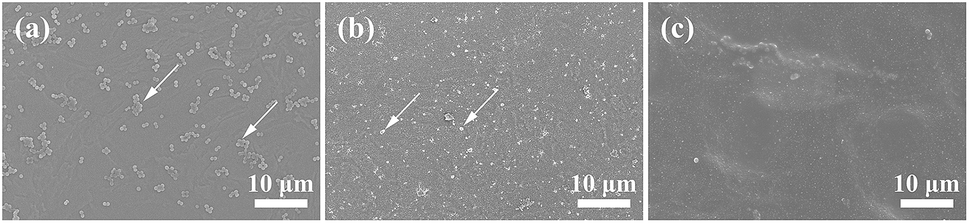 | ||
| Fig. 9 SEM surface micrographs of (a) TNTs, (b) TNTs/Ag and (c) TNTs/Ag + CS–Gel–Ag–ZnO coated samples after 24 h incubation at 2000× magnification. | ||
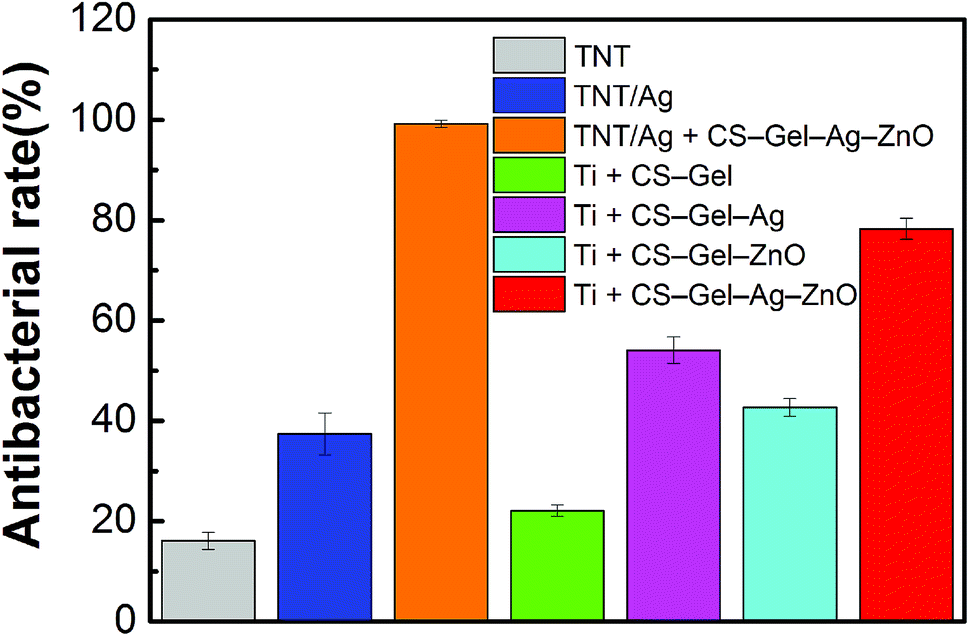 | ||
| Fig. 10 Antibacterial rates of TNTs, TNTs/Ag, TNTs/Ag + CS–Gel–Ag–ZnO, Ti + CS–Gel, Ti + CS–Gel–Ag, Ti + CS–Gel–ZnO, and Ti + CS–Gel–Ag–ZnO coated samples against planktonic S. aureus after 24 h incubation. The antibacterial rate data are presented as mean ± SD. | ||
On the other hand, the antibacterial rate of TNTs/Ag did not show much increase (Ra = 37.4%) compared to the TNTs (Ra = 16.1%). With regard to the bactericidal capability of ZnO and CS as mentioned before, hence it is reasonable to assume that the reinforced antibacterial property of TNTs/Ag + CS–Gel–Ag–ZnO coating was attributed to the additional Ag, ZnO and CS contents in the CS–Gel–Ag–ZnO outlayer. The result is coincident with that of agar diffusion test, and provides evidence for the synergistic effect between ZnO and Ag.
In addition, the antibacterial rate of the control without TNTs/Ag (Ti + CS–Gel–Ag–ZnO) is up to 78.3%, which is lower than that of the TNTs/Ag + CS–Gel–Ag–ZnO (99.2%). Therefore, the TNTs/Ag layer combined with the CS–Gel–Ag–ZnO coating can be used for further enhancing the antibacterial rate. The sample without Ag (Ti + CS–Gel–ZnO) shows an antibacterial rate value of 42.7%, which is lower than that of Ti + CS–Gel–Ag–ZnO (78.3%), indicating that the Ag content in the CS greatly enhances the antibacterial ability of the coating. Besides, compared with Ti + CS–Gel–Ag–ZnO (78.3%), the Ti + CS–Gel–Ag sample has a lower antibacterial rate of 54.1%, indicating that the ZnO content in the CS also effectively improves the antibacterial ability of the coating. The Ti + CS–Gel sample still shows an antibacterial rate value of 22.1%, indicating that CS has certain ability of antibacterial activity. Furthermore, compared with Ti + CS–Gel, the antibacterial rate of Ti + CS–Gel–Ag increases, suggesting that both CS and Ag in the CS play important roles in killing planktonic bacteria.
According to Wang et al.,42 the antibacterial mechanism of Ag NPs embedded in TNTs can be divided into two modes: contact mode and non-contact mode. In the contact mode, the Ag NPs contact with bacteria and cause a series of lethal reactions. One of the most popular configurations for this process is the interaction between Ag NPs and the bacterial cell walls and membranes, which induces structural changes in the cell walls and membranes, increasing the permeability, and eventually leads to the death of the bacterium.24 Also, metallic silver is known to be reactive with sulfur and phosphorus containing compounds.26 The reactivity of Ag NPs is even higher due to the extremely high specific surface area. Therefore, the Ag NPs could also kill bacteria via binding to the thiol group of respiratory enzymes which inhibits respiratory process or penetrating inside the cell membrane where there are sulfur-containing proteins and phosphorus-containing DNAs.22,25 The SEM micrographs (Fig. 2) show randomly distributed Ag NPs (metallic, so as Fig. 6c indicates) adherent to the inner wall and top of TNTs. According to the agar diffusion test of TNTs/Ag coating (Fig. 8b) and its SEM micrographs (Fig. 9), there is no significant ZOI and no undistorted bacteria adhesion on the surface. Therefore, the Ag NPs in the TNTs/Ag sample should mainly undergo the contact-sterilizing mechanism. In the non-contact mode, the Ag NPs kill bacteria through releasing silver ions (Ag+) that dissolve into the surrounding fluid and interact with bacteria. However, the antibacterial rate of TNTs/Ag did not exhibit significant increase compared with TNTs, which indicates a low release rate of Ag+ of TNTs/Ag. Hence the burst release of Ag toward ambient environment is controlled. The TNTs/Ag is of low cytotoxic and shall not cause severe damages to the surrounding cells.
The antibacterial rate of TNTs/Ag + CS–Gel–Ag–ZnO is significantly higher than the TNTs/Ag and TNTs, due to the additional CS–Gel–Ag–ZnO outer layer. Chitosan alone is a strong bactericide, which releases amino ions (NH2)+ that could interact to the cell wall and increase its permeability. Gelatin alone do not have efficient antibacterial properties, but it could increase the viscosity of the CS matrix and help the ZnO and Ag NPs uniformly mixed. ZnO is also a strong bactericide. Besides, it is important to note that ZnO and Ag NPs could mutually enhance their antibacterial efficacy following a synergistic mechanism.35,41,43,44 Jin et al.19 co-implanted Zn and Ag into Ti via plasma immersion ion implantation (PIII). The antibacterial rates of Zn/Ag co-implanted Ti against both E. coli and S. aureus were higher than those of Zn or Ag implanted Ti. Acting as the host of Ag NPs, ZnO prevents Ag NPs from aggregation and thus increases the relative exposure area for contact-sterilization. Also, ZnO as an electron accepter reduces the charge density of Ag NPs, as is validated by XPS data (Fig. 6). The antibacterial activity is enhanced by strong electrostatic forces between positively charged Ag NPs and negatively charged bacteria. On the other hand, the increase of antibacterial activity does not necessarily lead to strong cytotoxicity. Since the many amide and hydroxyl groups in the chitosan molecule produce an affinity for metal ions such as Ag+, which reduces cytotoxic metal ions to metallic state, the cytotoxicity of TNTs/Ag + CS–Gel–Ag–ZnO coating is controlled.
4. Conclusions
Using pure titanium as a substrate, we obtained a TNTs/Ag + CS–Gel–Ag–ZnO coating with excellent antibacterial properties by anodization and electrodeposition. The results of SEM and other characterization method indicate that the Ag NPs firmly adhered to and were evenly distributed in the TNTs, and the Ag+ release rate was significantly reduced, which should be helpful for reducing the cytotoxicity and prolonging its life-span. The introduction of the CS–Gel–Ag–ZnO layer greatly improved the antibacterial properties of the surface. The cross-cut tape test showed that the coating adhered firmly to the substrate probably due to the large interface area between TNTs and CS–Gel. In subsequent microbiological tests, we compared the antibacterial properties of three systems: TNTs, TNTs/Ag, and TNTs/Ag + CS–Gel–Ag–ZnO. The results show that the Ag NPs in TNTs were very effective against adherent bacteria, but their ability to inhibit planktonic bacteria was very limited, while the CS–Gel–Ag–ZnO layer made up for this: The antibacterial rate reached a satisfactory 99.2%, thanks to the intrinsic antibacterial activity against planktonic bacteria of the CS, ZnO and Ag NPs, and the synergistic effect between ZnO and Ag. We expect that the antibacterial properties provided by this novel coating are sufficient for the application of titanium in orthopedic and dental implants.Conflicts of interest
There are no conflicts to declare.Acknowledgements
This work was supported by the National Natural Science Foundation (51771134, 81470714, 81870806 and 81800935), National Natural Science Foundation for Excellent Young Scholar (51722403), Science and Technology Commission of Shanghai Municipality (15410722600), Shanghai Pujiang Program (17PJD030), Collaborative Research Program of Collaborative Innovation Center in Translational Medicine (TM201819), Shanghai Jiaotong University “Translational Medicine Cross-Fund” (ZH2018ZDB09), Tianjin Natural Science Foundation (18JCJQJC46500 and 16JCYBJC17600), the National Youth Talent Support Program, and the Pre-Research Foundation of Shanghai Jiao Tong University Affiliated Sixth People’s Hospital (LYNYLC-0030).References
- M. A. Surmeneva, A. Vladescu, R. A. Surmenev, C. M. Pantilimon, M. Braic and C. M. Cotrut, RSC Adv., 2016, 6, 87665–87674 RSC.
- X. Dai, X. Zhang, M. Xu, Y. Huang, B. C. Heng, X. Mo, Y. Liu, D. Wei, Y. Zhou, Y. Wei, X. Deng and X. Deng, RSC Adv., 2016, 6, 43685–43696 RSC.
- W. Simka, A. Krząkała, M. Masełbas, G. Dercz, J. Szade, A. Winiarski and J. Michalska, RSC Adv., 2013, 3, 11195 RSC.
- M. Geetha, A. K. Singh, R. Asokamani and A. K. Gogia, Prog. Mater. Sci., 2009, 54, 397–425 CrossRef CAS.
- P. I. Brånemark, B. O. Hansson, R. Adell, U. Breine, J. Lindström, O. Hallén and A. Ohman, Scand. J. Plast. Reconstr. Surg. Suppl., 1977, 16, 1–132 Search PubMed.
- R. Van Noort, J. Mater. Sci., 1987, 22, 3801–3811 CrossRef CAS.
- M. Long and H. J. Rack, Biomaterials, 1998, 19, 1621–1639 CrossRef CAS PubMed.
- V. Prabu, P. Karthick, A. Rajendran, D. Natarajan, M. S. Kiran and D. K. Pattanayak, RSC Adv., 2015, 5, 50767–50777 RSC.
- Z. Wang, M. Xing and O. Ojo, RSC Adv., 2014, 4, 55790–55799 RSC.
- M. Niinomi, M. Nakai and J. Hieda, Acta Biomater., 2012, 8, 3888–3903 CrossRef CAS PubMed.
- T. Albrektsson, P. I. Brånemark, H. A. Hansson and J. Lindström, Acta Orthop. Scand., 1981, 52, 155–170 CrossRef CAS PubMed.
- A. Di Martino, M. Sittinger and M. V. Risbud, Biomaterials, 2005, 26, 5983–5990 CrossRef CAS PubMed.
- L. Le Guéhennec, A. Soueidan, P. Layrolle and Y. Amouriq, Dent. Mater., 2007, 23, 844–854 CrossRef PubMed.
- K. Ma, X. Cai, Y. Zhou, Y. Wang and T. Jiang, Macromol. Biosci., 2017, 17, 1600130 CrossRef PubMed.
- P. Li, X. Zhang, R. Xu, W. Wang, X. Liu, K. W. K. Yeung and P. K. Chu, Surf. Coat. Technol., 2013, 232, 370–375 CrossRef CAS.
- B. e. Nie, T. Long, H. Li, X. Wang and B. Yue, RSC Adv., 2017, 7, 34321–34330 RSC.
- S. M. Hunagund, V. R. Desai, J. S. Kadadevarmath, D. A. Barretto, S. Vootla and A. H. Sidarai, RSC Adv., 2016, 6, 97438–97444 RSC.
- P. Huang, K. Ma, X. Cai, D. Huang, X. Yang, J. Ran, F. Wang and T. Jiang, Colloids Surf., B, 2017, 160, 628–638 CrossRef CAS PubMed.
- G. Jin, H. Qin, H. Cao, S. Qian, Y. Zhao, X. Peng, X. Zhang, X. Liu and P. K. Chu, Biomaterials, 2014, 35, 7699–7713 CrossRef CAS PubMed.
- Z. Lingzhou, K. C. Paul, Z. Yumei and W. Zhifen, J. Biomed. Mater. Res., Part B, 2009, 91B, 470–480 CrossRef PubMed.
- A. Regiel, S. Irusta, A. Kyziol, M. Arruebo and J. Santamaria, Nanotechnology, 2013, 24, 015101 CrossRef PubMed.
- Q. L. Feng, J. Wu, G. Q. Chen, F. Z. Cui, T. N. Kim and J. O. Kim, J. Biomed. Mater. Res., 2000, 52, 662–668 CrossRef CAS PubMed.
- A. Kahru and H. C. Dubourguier, Toxicology, 2010, 269, 105–119 CrossRef CAS PubMed.
- J. S. Kim, E. Kuk, K. N. Yu, J. H. Kim, S. J. Park, H. J. Lee, S. H. Kim, Y. K. Park, Y. H. Park, C. Y. Hwang, Y. K. Kim, Y. S. Lee, D. H. Jeong and M. H. Cho, Nanomedicine, 2007, 3, 95–101 CrossRef CAS PubMed.
- J. R. Morones, J. L. Elechiguerra, A. Camacho, K. Holt, J. B. Kouri, J. T. Ramírez and M. J. Yacaman, Nanotechnology, 2005, 16, 2346–2353 CrossRef CAS PubMed.
- M. Rai, A. Yadav and A. Gade, Biotechnol. Adv., 2009, 27, 76–83 CrossRef CAS PubMed.
- X. Wan, L. Wu, H. Pei, H. Ke, G. Yang and J. Tang, RSC Adv., 2018, 8, 19420–19425 RSC.
- S. Ferraris and S. Spriano, Mater. Sci. Eng., C, 2016, 61, 965–978 CrossRef CAS PubMed.
- J. Liu, B. Liu, Z. Ni, Y. Deng, C. Zhong and W. Hu, Electrochim. Acta, 2014, 150, 146–150 CrossRef CAS.
- H. Luo, P. Xiong, J. Xie, Z. Yang, Y. Huang, J. Hu, Y. Wan and Y. Xu, Adv. Funct. Mater., 2018, 28, 1803075 CrossRef.
- Y. Wan, Z. Yang, G. Xiong, R. Guo, Z. Liu and H. Luo, J. Power Sources, 2015, 294, 414–419 CrossRef CAS.
- S. Amin Yavari, L. Loozen, F. L. Paganelli, S. Bakhshandeh, K. Lietaert, J. A. Groot, A. C. Fluit, C. H. E. Boel, J. Alblas, H. C. Vogely, H. Weinans and A. A. Zadpoor, ACS Appl. Mater. Interfaces, 2016, 8, 17080–17089 CrossRef CAS PubMed.
- C. Zhao, B. Feng, Y. Li, J. Tan, X. Lu and J. Weng, Appl. Surf. Sci., 2013, 280, 8–14 CrossRef CAS.
- V. Porchezhiyan and S. E. Noorjahan, RSC Adv., 2016, 6, 95564–95573 RSC.
- S. Ghosh, V. S. Goudar, K. G. Padmalekha, S. V. Bhat, S. S. Indi and H. N. Vasan, RSC Adv., 2012, 2, 930–940 RSC.
- Y. Liu and H. I. Kim, Carbohydr. Polym., 2012, 89, 111–116 CrossRef CAS PubMed.
- K. Xie, L. Sun, C. Wang, Y. Lai, M. Wang, H. Chen and C. Lin, Electrochim. Acta, 2010, 55, 7211–7218 CrossRef CAS.
- S. Zhang, F. Peng, H. Wang, H. Yu, S. Zhang, J. Yang and H. Zhao, Catal. Commun., 2011, 12, 689–693 CrossRef CAS.
- C. U. Ro, J. Osán and G. R. Van, Anal. Chem., 1999, 71, 1521–1528 CrossRef CAS PubMed.
- I. Szalóki, J. Osán, A. Worobiec, J. de Hoog and R. Van Grieken, X-Ray Spectrom., 2001, 30, 143–155 CrossRef.
- S. Chen, G. Wu and H. Zeng, Carbohydr. Polym., 2005, 60, 33–38 CrossRef CAS.
- J. Wang, J. Li, S. Qian, G. Guo, Q. Wang, J. Tang, H. Shen, X. Liu, X. Zhang and P. K. Chu, ACS Appl. Mater. Interfaces, 2016, 8, 11162–11178 CrossRef CAS PubMed.
- W. Lu, G. Liu, S. Gao, S. Xing and J. Wang, Nanotechnology, 2008, 19, 445711 CrossRef PubMed.
- I. Matai, A. Sachdev, P. Dubey, S. Uday Kumar, B. Bhushan and P. Gopinath, Colloids Surf., B, 2014, 115, 359–367 CrossRef CAS PubMed.
Footnote |
| † The authors contributed equally to this work. |
| This journal is © The Royal Society of Chemistry 2019 |