 Open Access Article
Probing of complex carbon nanofiber paper as gas-diffusion electrode for high temperature polymer electrolyte membrane fuel cell†
Igor I. Ponomarev *a,
Kirill M. Skupov
 a,
Alexander V. Naumkin
 a,
Victoria G. Basu
 bc,
Olga M. Zhigalinabd,
Dmitry Y. Razorenov
 a,
Ivan I. Ponomareva and
Yulia A. Volkovaa
aNesmeyanov Institute of Organoelement Compounds, Russian Academy of Sciences, Vavilova St., 28, Moscow, 119991, Russia. E-mail: gagapon@ineos.ac.ru
bShubnikov Institute of Crystallography of Federal Scientific Research Centre “Crystallography and Photonics” of Russian Academy of Sciences, Leninsky Av., 59, Moscow, 119333, Russia
cNational Research Center “Kurchatov Institute”, Akademika Kurchatova Sq., 1, Moscow, 123182, Russia
dBauman Moscow State Technical University, 2nd Baumanskaya St., 5, Moscow, 105005, Russia
First published on 10th January 2019
Abstract
The development of fuel cells is an important part of alternative energy studies. High-temperature polymer electrolyte membrane fuel cell (HT-PEMFC) is a very promising and commercialized type of fuel cell since it allows the use of hydrogen contaminated with CO. However, current advances in HT-PEMFC are based on searching for more sustainable materials for the membrane electrode assembly. The key issue is to find new, more stable carbonaceous Pt-electrocatalyst supports instead of the traditional carbon black powder. In the present study, we primarily demonstrate a new electrode design concept. Complex carbon nanofiber paper (CNFP) electrodes, obtained by polyacrylonitrile (PAN) electrospinning with further pyrolysis at 900–1200 °C, are suitable for platinum deposition and were probed as the gas-diffusion electrode for HT-PEMFC. Complex composite electrodes were obtained by introducing zirconium and nickel salts into the electrospinning PAN solution. After pyrolysis, ZrOx and Ni(0) nanoparticles were distributed in the CNFP throughout the whole nanofiber volume, as it is seen in the high-resolution transmission electron microscopy images. The samples were thoroughly studied by X-ray photoelectron, Raman and impedance spectroscopy, cyclic voltammetry, and elemental analysis. The MEAs designed on platinized composite CNFPs demonstrate higher performance at 180 °C compared to non-composite ones and are comparable with commercial Celtec® P1000.
Introduction
The polymer electrolyte membrane fuel cell (PEMFC) is a clean energy-converting device that has attracted significant attention in the last two decades due to its high efficiency, high energy density, and low or zero emissions.1–7 PEMFC has several important application areas including transportation, stationary as well as portable and micro-power devices. However, major technological gaps that hinder its commercialization have been revealed, namely high cost and low durability. Increasing the durability of the electrocatalyst carbon support by replacement of the carbon black powder with more sustainable materials is the major challenge. Current efforts in this field are focused on searching for cost effective, active, and stable fuel cell catalysts for both the anodic hydrogen oxidation reaction and the cathodic oxygen reduction reaction (ORR), which takes place within the active catalyst layers.High-temperature polymer electrolyte membrane fuel cell (HT-PEMFC) based on a polybenzimidazole (PBI)/H3PO4 membrane, usually operated at 150–200 °C, is considered to be the next generation of fuel cell technology due to the reduced cost and reliability in terms of improved reaction kinetics, catalyst tolerance, heat rejection and water management.2–7 One of the main challenges hindering their success is material degradation, particularly that of the highly porous carbon Pt support with further detachment, loss and aggregation of the metal electrocatalyst particles.8 The fabrication of a new electrode for hydrogen–air HT-PEMFC with PBI type membrane is a complex fundamental, scientific and technical challenge.8–11 Increase in the fuel cell performance directly depends on the quality of the gas-diffusion electrodes.
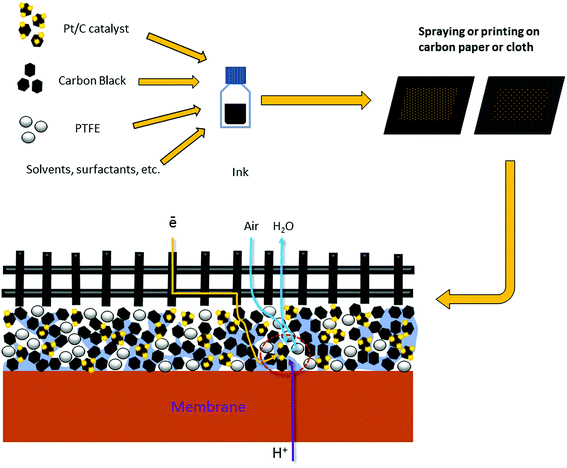
Approaches towards the gas-diffusion electrode (GDE) design are quite versatile (Fig. 1), but generally include the application of a catalytic ink (aqueous/alcohol dispersions of perfluoropolymers and electrocatalysts Pt/C) on carbon paper or tissue with a perfluorinated hydrophobic microporous layer.1,4
For the first time, we proved the possibility of fabricating platinum GDEs based on a carbon nanofiber non-woven self-supporting material for the membrane electrode assembly (MEA) of a hydrogen–air HT-PEMFC12–14 where the PBI-O-Pht/H3PO4 membrane, namely a membrane of PBI type, developed by our group in the Institute of Organoelement Compounds (INEOS RAS)15–17 was used. For this, the electrospinning method from a polymer solution was applied; the method has been used to prepare carbon nanofibers (CNF) in many applications.18–23 By the electrospinning method, polyacrylonitrile was electrospun on a flat surface providing polymer nanofiber (50–300 nm in diameter) mats. For the next step, during oxidation (stabilization) in air at 250–350 °C, partially oxidized nanofiber polymer mats with nitrogen containing heterocycles in their structure were obtained as described in literature.24 Finally the carbon nanofiber paper (CNFP) was formed when the stabilized polymer mats were pyrolyzed (carbonized) at 900–1200 °C under vacuum to form CNFP sheets. The aforementioned CNFPs are suitable for nanocrystalline platinum (1.5–5 nm) deposition by dipping directly into an H2[PtCl6] aqueous solution as confirmed by scanning and transmission electron microscopy.25 As a result, a new type of FC electrodes is formed (Fig. 2), which avoids some of the drawbacks of the traditional “ink-type” electrode preparation method.
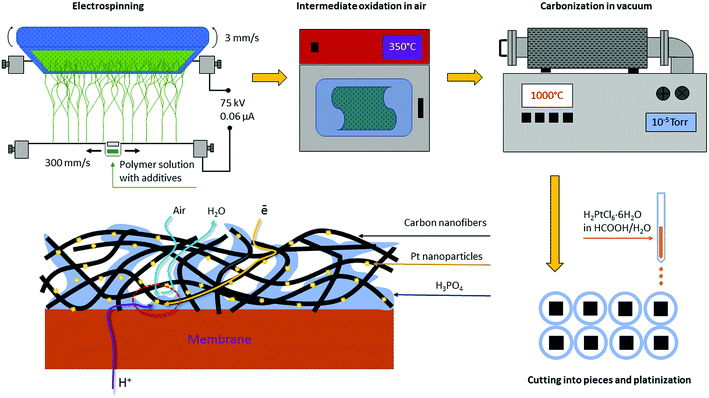 | ||
| Fig. 2 CNFP electrode preparation scheme. Integrity, high air permeability, low electrical resistance and residual nitrogen content (1.5–8.0%) are indispensable for organizing triple-phase boundary. | ||
Earlier we have demonstrated that this type of non-composite GDEs could be used as anodes14 and cathodes12 for HT-PEMFC, but in spite of the GDE advantages, the electrodes showed a performance that was lower compared to that of the commercial Celtec® P1000.
In this study, we probe a complex composite carbonized electrospun material on the basis of platinized PAN CNF with Zr and Ni distributed throughout the nanofibers as HT-PEMFC electrode.
Experimental
Electrospinning
100 g DMF solution of polyacrylonitrile (PAN) polymer (7% wt) and 0.57 g of carbon black Vulcan® XC72 (Vulcan) were sonicated in an ultrasonic bath at 50–60 °C. A separate solution was prepared using 0.89 g nickel(II) acetate tetrahydrate and 0.058 g zirconium(IV) chloride in 2 mL of DMF (amounts of Ni(OAc)2·4H2O and ZrCl4 were varied to obtain PAN/Vulcan/Zr/Ni nanofiber mats with different Ni and Zr content). The two solutions were mixed under vigorous stirring and sonicated in an ultrasonic bath at 50–60 °C. Electrospinning was carried out on an Elmarco Nanospider™ NS LAB setup (Czech Republic). The electrospinning was performed at 28 °C with a relative humidity of 12–18%, a distance of 190 mm between the electrodes, a linear carrier velocity of 3 mm s−1 and carriage velocity of 300 mm s−1. The electrospinning was processed at 75 kV and 0.06 μA. Finally, a PAN/Vulcan/Zr/Ni nanofiber polymer composite precursor mat was obtained.Electrode preparation
| Sample | C, % | N, % | H, % | Zr, % | Ni, % | σ, S cm−1 |
|---|---|---|---|---|---|---|
| 1 | 85.91 | 1.83 | 0.25 | 0.98 | 5.98 | 25.0 |
| 2 | 88.47 | 1.61 | — | 2.3 | 5.6 | 22.5 |
| 3 | 86.88 | 2.34 | 0.71 | 1.1 | 4.5 | 10.1 |
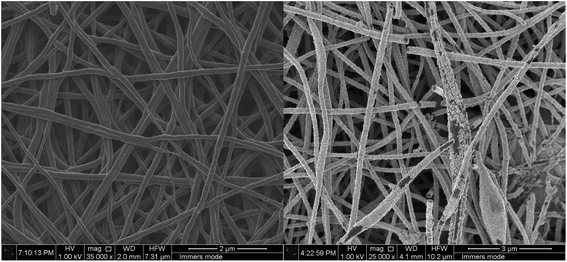
Scanning electron microscopy (SEM) top view images before and after platinization are shown in Fig. 3.
As seen in Fig. 3, the nanofiber surface is covered by a uniform platinum layer. More detailed images of the platinated nanofiber structures for similar nanofibers were reported in our previous study.25
Fuel cell testing
Just before testing the fuel cell, samples 1a–3a were hydrophobized by Teflon® AF by dipping the sample in octafluorotoluene (10 mg of Teflon® AF/10 mL of octafluorotoluene) for 1 min and treating at 280 °C under vacuum for 2 h.For cathode testing, cells with active surface areas of 5 cm2 were assembled and samples 1a–3a were used as the cathodes (BET specific surface area for 1 is 60.5 m2 g−1, Fig. S2 in ESI†). Standard commercial anode Celtec® P1000 (BASF)26 based on carbon black Vulcan® XC-72 (BET specific surface area of carbon black is 213 m2 g−1 according to ref. 27) with a Pt load of 1 mg cm−2 (40% Pt/C ratio15) was used. For the commercial sample, a standard commercial cathode Celtec® P1000 (BASF) was used (containing Vulcan® XC-72 supported Pt-alloy with 0.75 mg cm2 of Pt). A polymer electrolyte proton conducting membrane, PBI-OPht,15 which was developed earlier in our group, was used for MEA assembling. The membrane was modified by zirconium acetylacetonate and doped with o-phosphoric acid by 350–400%, which corresponds to 25 o-phosphoric acid molecules per polymer unit. Since these anodes and membranes were found to provide quite reproducible results, they were used to achieve a reliable comparison for different cathodes. MEAs were assembled within standard fuel cell hardware units (Arbin Instruments) such as graphite bipolar plates with an electrical current collector and gas supplies. Fuel cell tests were performed at 180 °C. Hydrogen was supplied from a hydrogen generator GVCh-6 (Khimelektronika) at 100 mL min−1. Atmospheric air was supplied at 300 mL min−1 (stoichiometry 6 at 0.6 A cm−2) in order to prevent oxygen mass-transfer limitations15 without additional humidification at atmospheric pressure. Polarization curves were obtained at a current density range of 0–0.8 A cm−2 at 180 °C with a current step of 0.02 A cm−2. The voltage measurements were performed after 5 s of current setting. The time test was performed at a current density of 0.6 A cm−2 at 180 °C for 170 h. Electrochemical impedance measurements of the fuel cells were conducted in a galvanostatic mode through a range of frequencies (from 100 kHz to 0.1 Hz) for different current density values with a magnitude of current perturbation of 2 mA cm−2.
Material characterization
The specific surface area data for the carbon materials were obtained by performing multi-point BET analysis using NOVAe® Series Surface Area Analyzer (Quantachrome Instruments). Electrical conductivity measurements of the nanofiber mats were performed with a 4-point digital setup LCR E7-8 (Russia). Raman spectra were obtained using Horiba-Jobin Yvon LabRAM Raman laser spectrometer with ×50 and ×100 microscope. A He–Ne laser of 0.1–0.01 mW was used as an excitation source.XPS studies
The X-ray photoelectron spectra were recorded using an Omicron spectrometer (UK) with Mg Kα radiation in the fixed analyzer transmission mode. The analyzer pass energy was set at 100 eV for registration of the survey and 40 eV for measuring high-resolution spectra. The spectra were measured with a step size of 0.1 eV at room temperature. The energy scale of the spectrometer was calibrated according to the standard procedure taking into account the following binding energies: 932.7, 368.3 and 84.0 eV for Cu 2p3/2, Ag 3d5/2, and Au 4f7/2, respectively. The residual pressure inside the analysis chamber was lower than 1.0 × 10⁻⁹ mbar. The photoelectron spectra were approximated by a Gauss function or the sum of Gauss functions, and the background caused by secondary electrons and photoelectrons that lost energy was approximated by Shirley-type background line. Quantification was performed using atomic sensitivity factors included in the software of the spectrometer. The samples were fixed to the sample holder by double-sided adhesive tape. Sample charging was corrected by referencing to the sp2 state in the C 1s spectrum (284.44 eV).28Electron microscopy
Nanofiber images were obtained by scanning electron microscopy (SEM) on a FEI Quanta 250 FEG and FEI Helios 600. Transmission electron microscopy (TEM), scanning transmission electron microscopy (STEM) images and EDX elemental mapping were obtained on a FEI Tecnai Osiris equipped with Super-X EDX detection system (FEI) based on Silicon Drift Detector (SDD) technology and high angle annular dark field (HAADF) detector. The high sensitivity system allows for the detection of all elements down to and including boron; high output count rates and maximum collection efficiency provide quick time-to-data even for low intensity EDX signals. For electron microscopy studies, nanofiber samples were dispersed in acetone using an ultrasonic bath for 5–30 min to obtain single nanofibers. The resulting suspensions were dropped onto Cu lacey carbon grids. To visualize structure details, low voltage immersion mode (FEI Helios 600) and environmental mode (FEI Quanta 250 FEG) were applied for obtaining SEM images.See ESI† for additional information on cyclic voltammetry (CV), electrochemical impedance spectroscopy (EIS), and BET specific surface area data.
Results and discussion
Fuel cell performance
For effective performance, a hydrogen–air HT-PEMFC MEA generally requires a balance between gas (hydrogen, air) permeability, proton conductivity and electron conductivity. In the traditional so-called “ink-type” electrode (Fig. 1), carbon black plays the role of the electron conductor where protons are conducted through pores distributed in the carbon black in a phosphoric acid media. To organize gas permeability, polytetrafluoroethylene (PTFE) is added to the “ink”. Due to its high hydrophobicity, the gases move through the electrode along the border between the hydrophobic PTFE and the phosphoric acid media. In this case, the required triple boundary point for electrocatalysis appears. For our new CNFP electrode, the organization and optimization of balance between gas permeability, proton conductivity and electron conductivity on the triple boundary point is also a very important task. The CNFs definitely improve the percolating network for electron conductivity (Fig. 4 and 5). Our 3D investigations of single carbon nanofibers using the electron tomography method have visualized large pores in the fiber volume (which corresponds to around 20% of the CNF diameter). Cavities and pores are formed by loops of parallel graphene layer sets, which appear as a result of the fiber crystallization during the annealing process.25 For proton conductivity, the phosphoric acid is distributed in the pores (total specific pore surface is 60–300 m2 g−1) on the CNF. Protonation of residual nitrogen atoms (which still exist in CNF after polymer composite mat pyrolysis) also occurs, and it helps better proton conductivity. Our previously studied materials14 were obtained by electrospinning of the PAN/carbon black solution with further pyrolysis, and showed some limitations with proton transport according to the EIS Nyquist plot (see ESI, Fig. S3†). To overcome this difficulty, a composite electrode was produced, in which a solution of PAN with a low content of carbon black and of Zr and Ni salts were used for electrospinning followed by pyrolysis. As expected, after the two step thermal treatment (oxidation and pyrolysis), Zr appeared in the electrode in the form of ZrOx distributed homogeneously throughout the nanofibers, which interacted with phosphoric acid leading to the formation of acid sites to improve proton transport. After pyrolysis, Ni is expected to be present in the form of Ni(0), distributed throughout the nanofibers. It may play the role of small sized seeds to improve platinum deposition on the PAN/Vulcan/Zr/Ni-350-1000 support, and as a doping metal for platinum to promote ORR on the cathode. The “improved” shape of the EIS Nyquist plot was registered (see ESI, Fig. S4†), which can be related to the improved proton transport. The results of the fuel cell performance are shown in Fig. 4.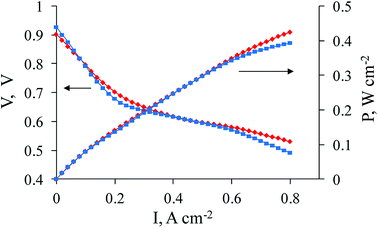 | ||
| Fig. 4 Polarization and power density curves (180 °C) for commercial cathode Celtec® P1000 (BASF) (blue line, squares) and for sample 1a as a cathode (red line, rhombi). | ||
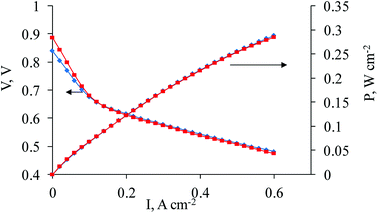 | ||
| Fig. 5 Polarization and power density curves (180 °C) for sample 2a (blue line, rhombi) and sample 3a (red line, squares) as cathodes. | ||
As seen in Fig. 4, the fuel cell performance reaches that of the best commercial sample (Celtec® P1000). Three regions can be observed on the polarization curves for 1a and the commercial sample. An activation polarization region (1st) is observed at low current density values (approximately <0.15 A cm−2 in the given case) and is related to the activation energy barrier on the electrode. A slightly lower voltage for 1a from 0–0.1 A cm−2 might be related to the slightly higher overpotential for the oxygen reduction reaction. Ohmic losses are predominantly responsible for further potential decrease at approximately 0.15–0.7 mA cm−2 in the ohmic polarization region (2nd). These losses are very similar for both samples and could be evaluated to be 50–70 mΩ. The R value corresponds to that taken from the EIS measurement at 0.4 A cm−2 in the low frequency region, which is found to be ∼65 mΩ. A concentration polarization region (3rd) is observed at current densities > 0.7 A cm−2, where losses related to gas transfer limitations predominantly on the cathode take place, especially in the case where air is used instead of oxygen. It can be noticed that mass-transfer losses are lower for 1a, which points to the better performance of the nanofiber based cathode at >0.7 A cm−2, probably, due to its better gas-diffusion properties. At the same time, the exact quantification of the losses corresponding to these regions on the polarization curves might be complicated because of the multiple overlapping processes involved.
It is interesting to mention that the variation of Zr and Ni content, such as the increase of Zr and decrease of Ni content in the cathode composition (samples 2a and 3a) of Pt/PAN/Vulcan/Zr/Ni-350-1000 leads to a lower fuel cell performance (Fig. 5).
We suppose that the increase of Ni content up to 6%, incorporated into the electrocatalyst support (1, Table 1), is responsible for the better fuel cell performance. This is due to the decrease in the overpotential of the oxygen reduction reaction at high temperature in the phosphoric acid media. However, the complete explanation for the increase in the fuel cell performance is not clear so far and needs further investigation. At the same time, the low Ni content for samples 2 and 3 leads to a lower fuel cell performance. In spite of the difference in the Zr content (2.3% for 2 and 1.1% for 3, Table 1), the fuel cell performances do not differ much except for the activation loss regions shown on the polarization curves; where the fuel cell performance is slightly lower for 2 and can be explained by the fact that the excess of Zr triggers the lower electrode performance. Also, as can be seen from the experimental results, the increasing Zr content does not improve the cell performance and it means that the Zr content should not exceed 1%.
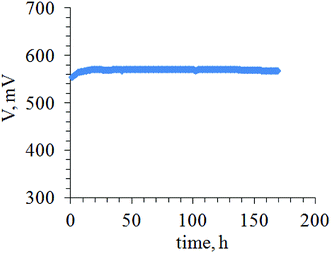
In terms of durability, a time-test at 0.6 A cm−2 conducted in galvanostatic mode shows quite stable value of about 570 mV during 170 h of fuel cell operation at 180 °C (Fig. 6). The fuel cell power was found to be up to 342 mW cm−2.
Electron microscopy
The method of electrospinning from a polymer solution followed by pyrolysis allows the achievement of a perfect distribution of nickel and zirconium throughout the carbon nanofibers. Using TEM, SEM, electron diffraction and energy-dispersive X-ray spectroscopy (EDX), it was shown that in 1a, the platinum nanocrystals have a uniform distribution on the nanofiber surface (Fig. 7).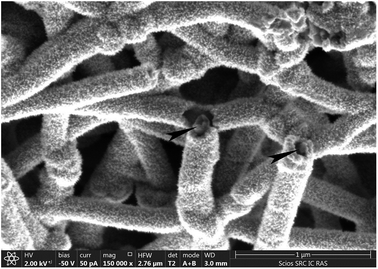 | ||
| Fig. 7 SEM of nanofibers for 1a. Arrows indicate the carbon nanofiber cracks. Pt nanoparticles cover the surface of the nanofibers. | ||
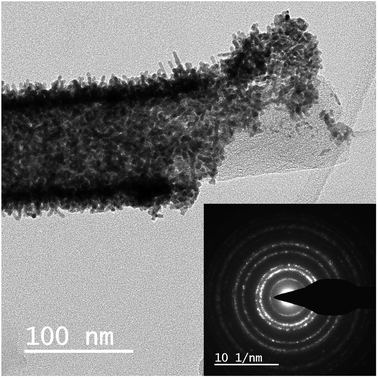
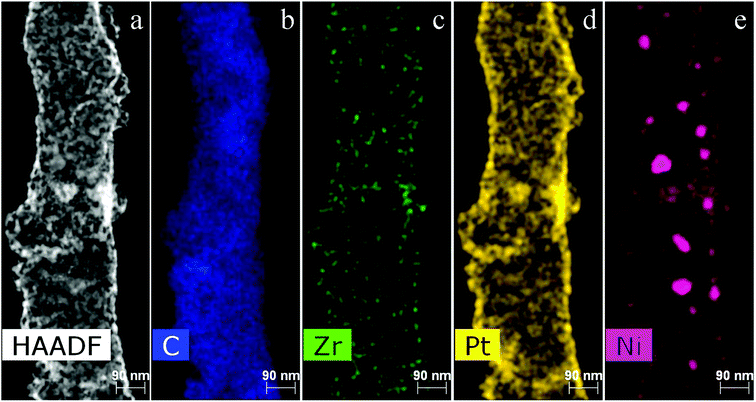
Zirconium and nickel are homogeneously distributed throughout the nanofiber volume. As for Ni, we observe its homogeneous distribution in combination with nanoparticles, with a size of several tens of nanometers, on the CNFs (Fig. 8).
Fig. 9 provides additional information about the Pt morphology on the nanofibers and additionally confirms its uniform distribution.
As seen in Fig. 9, the Ni and Pt distribution is similar. However, Ni also forms large nanoparticles in addition to the smaller ones. It, most probably, confirms that Pt deposits on Ni seeds during the process of Pt deposition from the aqueous solution in the presence of formic acid. The Zr distribution is slightly different; it corresponds to separate Zr particles that are probably in the form of ZrOx.
To investigate the Pt morphology, HAADF STEM images and corresponding elemental (Pt) maps were obtained for sample 1a, before and after 7 days of fuel cell testing (Fig. 10).
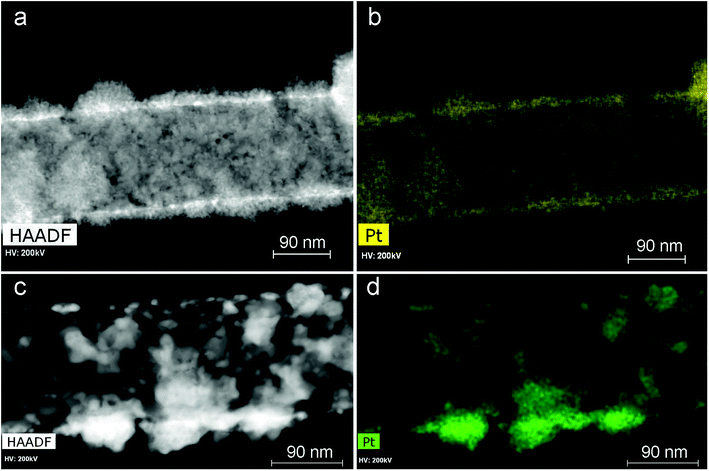 | ||
| Fig. 10 HAADF STEM images and corresponding elemental maps before (a and b) and after 7 days of fuel cell testing (c and d). | ||
It was found that coarsening of the platinum particles does not lead to immediate degradation of the fuel cell performance. The time test (Fig. 6) shows that the fuel cell can operate over long periods of time without a significant performance loss.
Raman spectroscopy
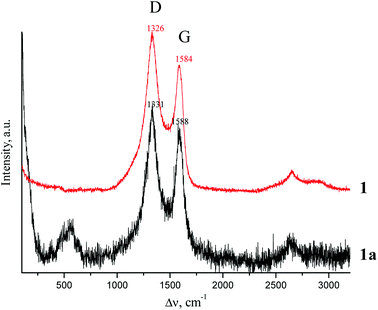
Raman spectra for samples 1 and 1a are shown in Fig. 11.The D and G bands are clearly seen in the Raman spectra. These bands are related to partially graphitized sp2-carbon materials. In our case, it also suggests incomplete graphitization of the carbon material after pyrolysis at 1000 °C.
XRD analysis
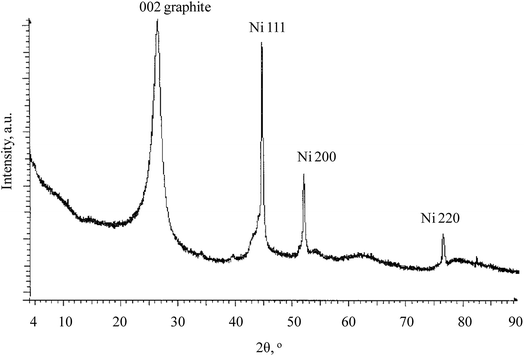
XRD of the electrocatalyst support (sample 1) is shown in Fig. 12.In Fig. 8, the graphite and nickel related lines are clearly seen. Particularly, a peak at 26° corresponds to the 002 graphite line. Peaks at 45°, 52°, 76° correspond to the 111, 200, 220 nickel(0) lines. This clearly confirms the partially graphitized structure of the sample and also Ni(0) presence in the sample.
XPS studies
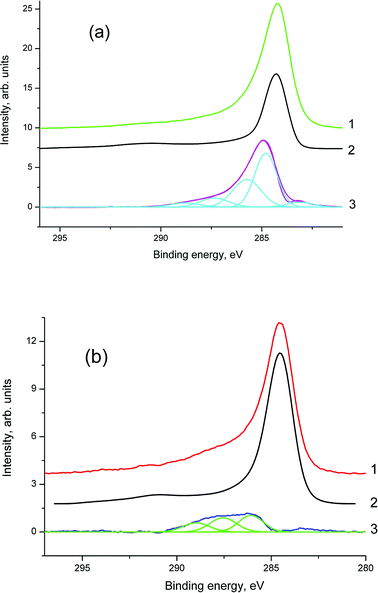
Due to the heterogeneity of the CNFP electrode morphology and the demonstrated fuel cell performance dependence on the elemental content, X-ray photoelectron spectroscopy (XPS) studies were performed in order to obtain more information concerning the surface of the composite electrode.No contamination peaks were recorded in the survey spectra of the examined samples. According to the XPS quantitative analysis, the compositions of samples 1 and 1a are C91.55N4.55O3.59Ni0.11Zr0.21 and C65.92N2.54O9.40Pt21.60Ni0.29Zr0.25 (on the surface), respectively. The high-resolution C 1s spectra (Fig. 12 and 13) were fitted using the procedure described elsewhere.29
The C 1s spectra of samples 1 and 1a were fitted with six and four states. Their characteristics are presented in Table 2.
| Sample | C–Ni | C![[double bond, length as m-dash]](https://www.rsc.org/images/entities/char_e001.gif) C C |
C–C/CH | C–O | O–C–O | C(O)O | |
|---|---|---|---|---|---|---|---|
| BE, eV | 283.3 | 284.44 | 285.0 | 286.0 | 287.55 | 289.0 | |
| 1 | Irel, a.u. | 0.03 | 0.49 | 0.25 | 0.16 | 0.05 | 0.02 |
| 1a | Irel, a.u. | — | 0.84 | — | 0.06 | 0.06 | 0.04 |
Fig. 13 and Table 2 clearly demonstrate that the chemical states of the carbon atoms change after platinum deposition. Two carbon groups, namely C–Ni and C–C/CH, are not observed in the C 1s spectrum of sample 1a, the relative intensity of the sp2 state (C![[double bond, length as m-dash]](https://www.rsc.org/images/entities/char_e001.gif) C) is about twice as that in sample 1.
C) is about twice as that in sample 1.
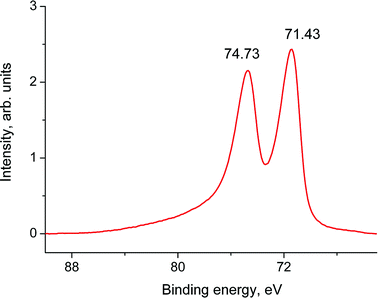
Fig. 14 shows the Pt 4f spectrum of sample 1a. The binding energy of the Pt 4f7/2 peak referenced to the graphitic C 1s core level at 284.44 eV is 71.44 eV. Both the binding energy and the Pt 4f5/2–4f7/2 spin–orbit splitting of 3.30 eV indicate that Pt is in a zero oxidation state. The energy shift of 0.31 eV relative to the spectrum of the Pt foil26 may be assigned to the size effect in the photoelectron spectra.30 According to TEM data, the size of Pt nanoparticles is about 2 nm.
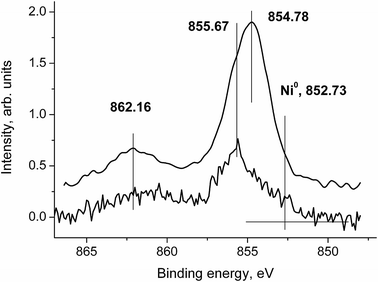
Fig. 15 shows the Ni 2p3/2 spectra of samples 1 and 1a.
The main peaks at 854.78 and 855.67 eV indicate that the Ni atoms are predominantly in the oxide state.31 The intense satellites at around 862 eV characterize the oxide state as well. Asymmetry observed in the Ni 2p3/2 peak of sample 1a may be an indicator of two different chemical states. Taking into account the size effect, one can propose that some Ni atoms may be in the Ni0 state. Moreover, the energy difference between the main peak and the satellite in spectrum 1 (ΔE = 6.38 eV) does not correspond to those in NiO, Ni2O3·6H2O, Ni(OH)2, α-Ni(OH)2, β-Ni(OH)2 and γ-NiOOH2, which are in the range of 5.6–6.1 eV.31–36 A comparison of these ΔE values reveals a two-component structure in the Ni 2p3/2 spectrum 1 as in spectrum 2.
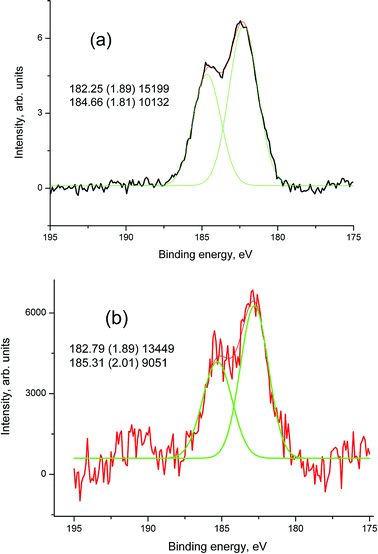
The Zr 3d spectra presented in Fig. 16 and 17 correspond to the ZrO2 state.28
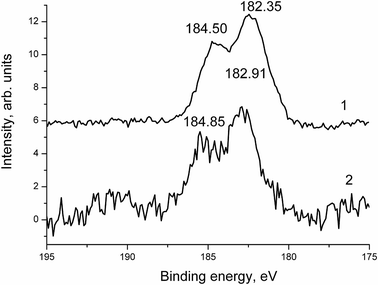
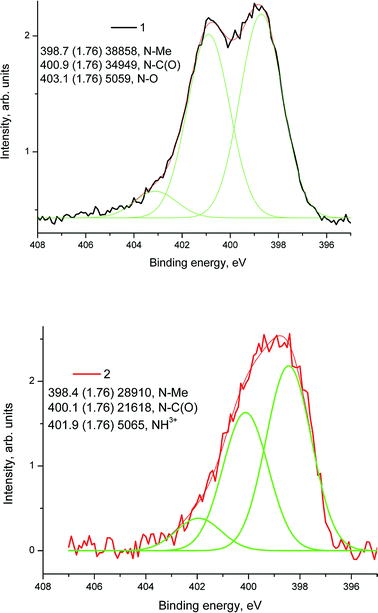
The difference in binding energies may be assigned to either the size effect or the different surroundings. Fig. 18 shows high resolution XPS N 1s spectra of samples 1 (1) and 1a (2) fitted with some components.
The N 1s spectra of samples 1 and 1a were fitted with three components related to the nitrogen–metal (N–Me) bond (1, 2), N–C(O) group (1, 2), N–Ox (1) and NH3+ groups.37 XPS studies confirm the presence of ZrOx, Ni(0), N and Pt on the surface of the composite HT-PEMFC electrode and provide important information about their chemical states.
Conclusions
A new concept for carbon nanofiber paper-based fuel cell gas-diffusion electrode design was proposed and demonstrated to be useful for HT-PEMFC on a polybenzimidazole membrane. The electrodes are produced by the electrospinning method from a polymer solution with further pyrolysis, in order to finally obtain a more durable nanofiber electrode compared with carbon black ones. Introduction of ZrOx and Ni(0) into the carbon nanofiber paper platinum support during the electrospinning step leads to a higher fuel cell performance comparable to Celtec® P1000, one of the best commercial electrodes.Conflicts of interest
There are no conflicts of interest to declare.Acknowledgements
The authors would like to thank V. V. Emets, S. S. Bukalov and M. Kondratenko for their help. The study was financially supported by Russian Science Foundation, grant # 18-13-00421.References
- J. Zhang, PEM Fuel Cell Electrocatalysts and Catalyst Layers, Fundamentals and Applications, Springer-Verlag, London, 2008 Search PubMed.
- R. E. Rosli, A. B. Sulong, W. R. W. Daud, M. A. Zulkifley, T. Husaini, M. I. Rosli, E. H. Majlan and M. A. Haque, Int. J. Hydrogen Energy, 2017, 42, 9293–9314 CrossRef CAS.
- R. K. A. Rasheed, Q. Liao, Z. Caizhi and S. H. Chan, Int. J. Hydrogen Energy, 2017, 42, 3142–3165 CrossRef.
- Q. Li, D. Aili, H. A. Hjuler and J. O. Jensen, High Temperature Polymer Electrolyte Membrane Fuel Cells, Approaches, Status and Perspectives, Springer, Cham, Heidelberg, New York, Dordrecht, London, 2016 Search PubMed.
- R. Zeis, Beilstein J. Nanotechnol., 2015, 6, 68–83 CrossRef PubMed.
- S. S. Araya, F. Zhou, V. Liso, S. L. Sahlin, J. R. Vang, S. Thomas, X. Gao, C. Jeppesen and S. K. Kaer, Int. J. Hydrogen Energy, 2016, 41, 21310–21344 CrossRef CAS.
- A. Chandan, M. Hattenberger, A. El-kharouf, S. Du, A. Dhir, V. Self, B. G. Pollet, A. Ingram and W. Bujalski, J. Power Sources, 2013, 231, 264–278 CrossRef CAS.
- X. X. Wang, Z. H. Tan, M. Zeng and J. N. Wang, Sci. Rep., 2014, 4, 4437 CrossRef PubMed.
- J. Lobato, H. Zamora, J. Plaza, P. Canizares and M. A. Rodrigo, Appl. Catal., B, 2016, 198, 516–524 CrossRef CAS.
- H. Zamora, J. Plaza, P. Canizares, J. Lobato and M. A. Rodrigo, ChemSusChem, 2016, 9, 1187–1193 CrossRef CAS PubMed.
- Z. Xia, S. Wang, L. Jiang, H. Sun, S. Liu, X. Fu, B. Zhang, D. S. Su, J. Wang and G. Sun, Sci. Rep., 2015, 5, 16100 CrossRef PubMed.
- K. M. Skupov, I. I. Ponomarev, D. Y. Razorenov, V. G. Zhigalina, O. M. Zhigalina, I. I. Ponomarev, Y. A. Volkova, Y. M. Volfkovich and V. E. Sosenkin, Russ. J. Electrochem., 2017, 53, 728–733 CrossRef CAS.
- I. I. Ponomarev, I. I. Ponomarev, I. Y. Filatov, Y. N. Filatov, D. Y. Razorenov, Y. A. Volkova, O. M. Zhigalina, V. G. Zhigalina, V. V. Grebenev and N. A. Kiselev, Dokl. Phys. Chem., 2013, 448, 23–27 CrossRef CAS.
- I. I. Ponomarev, K. M. Skupov, D. Y. Razorenov, V. G. Zhigalina, O. M. Zhigalina, I. I. Ponomarev, Y. A. Volkova, M. S. Kondratenko, S. S. Bukalov and E. S. Davydova, Russ. J. Electrochem., 2016, 52, 735–739 CrossRef CAS.
- M. S. Kondratenko, I. I. Ponomarev, M. O. Gallyamov, D. Y. Razorenov, Y. A. Volkova, E. P. Kharitonova and A. R. Khokhlov, Beilstein J. Nanotechnol., 2013, 4, 481–492 CrossRef PubMed.
- A. I. Fomenkov, I. V. Blagodatskikh, I. I. Ponomarev, Y. A. Volkova, I. I. Ponomarev and A. R. Khokhlov, Polym. Sci., Ser. B, 2009, 51, 166–173 CrossRef.
- I. I. Ponomarev, D. Y. Razorenov, I. I. Ponomarev, Y. A. Volkova and K. M. Skupov, Russ. J. Electrochem., 2014, 50, 694–699 CrossRef CAS.
- Z. Dong, S. J. Kennedy and Y. Wu, J. Power Sources, 2011, 196, 4886–4904 CrossRef CAS.
- M. Ignaki, Y. Yang and F. Kang, Adv. Mater., 2012, 24, 2547–2566 CrossRef PubMed.
- B. Zhang, F. Kang, J.-M. Tarascon and J.-K. Kim, Prog. Mater. Sci., 2016, 76, 319–380 CrossRef CAS.
- T. K. Tenchurin, A. N. Krasheninnikov, A. S. Orekhov, S. N. Chvalun, A. D. Shepelev, S. I. Belousov and A. I. Gulyaev, Fibre Chem., 2014, 46, 151–160 CrossRef CAS.
- M. V. Rylkova, E. S. Bokova, G. M. Kovalenko and I. Y. Filatov, Fibre Chem., 2012, 44, 146–148 CrossRef CAS.
- L. Ji, Z. Lin, A. J. Medford and X. Zhang, Carbon, 2009, 47, 3346–3354 CrossRef CAS.
- N. Yusof and A. F. Ismail, J. Anal. Appl. Pyrolysis, 2012, 93, 1–13 CrossRef CAS.
- V. G. Zhigalina, O. M. Zhigalina, I. I. Ponomarev, K. M. Skupov, D. Y. Razorenov, I. I. Ponomarev, N. A. Kiselev and G. Leitinger, CrystEngComm, 2017, 19, 3792–3800 RSC.
- T. J. Schmidt and J. Baurmeister, J. Power Sources, 2008, 176, 428–434 CrossRef CAS.
- T. Chen, Y. Tang, Y. Qiao, Z. Liu, W. Guo, J. Song, S. Mu, S. Yu, Y. Zhao and F. Gao, Sci. Rep., 2016, 6, 23289 CrossRef CAS PubMed.
- A. V. Naumkin, A. Kraut-Vass, S. W. Gaarenstroom and C. J. Powell, NIST X-ray Photoelectron Spectroscopy Database, Version 4.1, National Institute of Standards and Technology, Gaithersburg, 2012, https://srdata.nist.gov/xps/, accessed June 2018 Search PubMed.
- N. S. Komarova, A. G. Krivenko, A. G. Ryabenko and A. V. Naumkin, Carbon, 2013, 53, 188–196 CrossRef CAS.
- W. Eberhardt, P. Fayet, D. M. Cox, Z. Fu, A. Kaldor, R. Sherwood and D. Sondericker, Phys. Rev. Lett., 1990, 64, 780–783 CrossRef CAS PubMed.
- A. N. Mansour, Surf. Sci. Spectra, 1994, 3, 231–238 CrossRef CAS.
- A. N. Mansour and C. A. Melendres, Surf. Sci. Spectra, 1994, 3, 263–270 CrossRef CAS.
- A. N. Mansour and C. A. Melendres, Surf. Sci. Spectra, 1994, 3, 247–254 CrossRef CAS.
- A. N. Mansour and C. A. Melendres, Surf. Sci. Spectra, 1994, 3, 255–262 CrossRef CAS.
- A. N. Mansour, Surf. Sci. Spectra, 1994, 3, 239–246 CrossRef CAS.
- A. N. Mansour and C. A. Melendres, Surf. Sci. Spectra, 1994, 3, 271–278 CrossRef CAS.
- G. Beamson and D. Briggs, High Resolution XPS of Organic Polymers. The Scientia ESCA300 Database, Wiley, Chichester, 1992 Search PubMed.
Footnote |
| † Electronic supplementary information (ESI) available: CV, EIS, and BET specific surface area data. See DOI: 10.1039/c8ra07177b |
| This journal is © The Royal Society of Chemistry 2019 |

