DOI:
10.1039/C9QM00404A
(Review Article)
Mater. Chem. Front., 2019,
3, 2207-2220
Sparks fly when AIE meets with polymers
Received
22nd June 2019
, Accepted 2nd August 2019
First published on 5th August 2019
Abstract
Biological and synthetic polymers play important roles in human life and modern society. Understanding their properties and dynamic processes are thus particularly crucial. However, modern instruments suffer from ex situ, tedious sample preparation, and even show “blindness” to the testing process. Fortunately, fluorescent technology based on aggregation-induced emission (AIE) luminogens is cutting-edge and holds great potential to address this challenge. Owing to their twisted flexible structures, the emission of AIE luminogens (AIEgens) is sensitive to the surrounding microenvironmental changes, enabling them to function as sensitive fluorescent probes based on the mechanism of restriction of intramolecular motion (RIM). AIEgens can even detect subtle polarity variation when imparting them with donor–acceptor structures to trigger the twisted intramolecular charge transfer effect. In this short review, we have briefly described the recent applications of AIEgens in polymer-related fields for monitoring protein conformation, fibrillation, and enzyme activity, DNA synthesis, sequence and G-quadruplexes, analyzing a polymerization reaction, glass transition, and phase separation, and detecting humidity, and heat, etc. The outlook on the further applications of AIE technology in the polymer field is also discussed.

Yuanyuan Li
| Yuanyuan Li received her PhD degree under the supervision of Prof. Lehui Lu from Changchun Institute of Applied Chemistry, Chinese Academy of Science in 2017. Currently, she is a postdoctoral fellow under the guidance of Prof. Ben Zhong Tang at the Hong Kong University of Science and Technology. Her research interest lies in AIE-active materials for biomedical theronostics. |

Shunjie Liu
| Shunjie Liu obtained his PhD degree under the supervision of Prof. Xianhong Wang from Changchun Institute of Applied Chemistry, Chinese Academy of Science in 2016. He is currently a postdoctoral fellow under the guidance of Prof. Ben Zhong Tang at the Hong Kong University of Science and Technology. His research interests focus on design and synthesis of organic/polymeric semi-conducting materials and exploration of their biomedical applications. |

Jacky W. Y. Lam
| Jacky W. Y. Lam received his PhD degree from HKUST in 2003 under the supervision of Prof. Tang. He is currently a research associate professor in the Department of Chemistry at HKUST. His research interests include macromolecular chemistry and materials science. Lam has been listed by Thomson Reuters and Clarivate Analytics as a Highly Cited Researcher in the area of Chemistry in 2014–2018. |

Ben Zhong Tang
| Prof. Tang received his bachelor and PhD degrees from South China University of Technology and Kyoto University in 1982 and 1988, respectively. He conducted his postdoctoral work at the University of Toronto in 1989–1994. He joined HKUST in 1994 and was promoted to chair professor in 2008 and Stephen K. C. Cheong Professor of Science in 2013. He was elected to Chinese Academy of Sciences in 2009. His research interests include the exploration of new advanced materials, new luminescent processes, fluorescent bioprobes, and new polymerization reactions. |
1. Introduction
Polymers are large molecules composed of many repeated subunits. Generally, polymers are either classified as biological polymers, such as DNA and proteins, or synthetic polymers, such as polyethylene and polystyrene. Living organisms produce biological polymers, which are vital to support the infrastructures required to live.1–4 Notably, the chemical and physical processes, such as cell mitosis, DNA synthesis, DNA folding, and enzyme activity of biopolymers, can affect their biological functions. On the other hand, synthetic polymers are found everywhere in modern societies. Their synthesis process, supramolecular self-assembly, chain motion and phase separation influence the final properties of these materials.5–10 However, we can seldom see these processes. As seeing is believing, the visualization of these processes has received considerable attention for a more in-depth evaluation of the structure–property relationships.
Traditional techniques for detecting structural or morphological changes in polymers rely on specific instruments, such as differential scanning calorimetry (DSC), Fourier transform infrared (FTIR), gel permeation chromatography (GPC), mass spectroscopy (MS), and nuclear magnetic resonance (NMR) spectroscopy. However, these techniques provide only indirect information and fail to see the processes. Electron microscopy, such as atomic force microscopy (AFM), cryo-electron microscopy (cryo-EM), scanning electron microscopy (SEM), and transmission electron microscopy (TEM), on the other hand, can visualize these processes but suffer from ex situ characterizations and complicated sample preparations.11 Fluorescent techniques have found promising potential in this field owing to their significant contrast, high sensitivity, fast response and non-invasive characteristic.12,13 The fluorescent dyes utilized usually possess planar structures and are highly emissive as isolated molecules. However, their emission is partially or completely quenched in the aggregate state, especially in aqueous biological environments. Such uncontrollable aggregation-caused quenching (ACQ) severely hinders the applications of these dyes.14
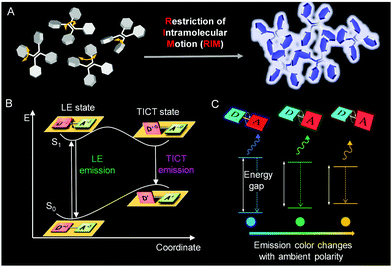
Contrary to ACQ, aggregation-induced emission (AIE) is an unusual photophysical phenomenon coined by our group in 2001.15–20 AIE luminogens (AIEgens) display weak or negligible photoluminescence (PL) in dilute solutions but emit strongly in the aggregate or solid state.21–26 The isolated, propeller-like AIEgens can dissipate the excited-state energy through active intramolecular motions in solution. When these motions are restricted in aggregates, intense fluorescence was obtained (Fig. 1A). Thus, the restriction of intramolecular motion (RIM) has been identified as the cause of AIE. According to this mechanism, aggregation is not necessary for fluorescence enhancement. Structural rigidification of AIEgens by external factors, such as high viscosity or supramolecular interactions, can trigger strong fluorescent emission.27,28 Thus, AIE technology embodies a sharp fluorescence “turn-on” transition, showing enhanced detection sensitivity and decreased background interference.29–34 In addition, the intrinsic properties of polymers remain unaffected in the presence of a low dye loading, but make them highly fluorescent for visualizations.12,27,35,36 These attributes are particularly useful for microenvironment detections.
 |
| | Fig. 1 A Schematic illustration showing the mechanisms of the AIE phenomenon (A). Jablonski diagrams of TICT dynamics in the donor–acceptor system (B) and (C). Reproduced from ref. 82 with permission from Wiley-VCH. | |
Conjugated molecules with donor–acceptor structures often display an excited-state electron transfer process, termed twisted intramolecular charge transfer (TICT) (Fig. 1B).37–42 In a nonpolar environment, the fluorophore exists in the locally excited (LE) state to display a sharp emission spectrum. In a polar environment, the fluorophore transits to the TICT state from the LE state by intramolecular rotations. The emissions of the TICT state red-shift gradually with an increase in solvent polarity as the fluorophore undergoes a notable change in geometry (Fig. 1C). Therefore, AIEgens with TICT properties can sense not only processes involving RIM but also external polarity variations, which stands for another promising outlook for visualizing processes.
A systematic review on AIE technology has not been conducted although it has been widely explored as a detection tool in polymer science.43–45 In this work, we summarize the recent progress on the applications of AIEgen in the polymer field by our group since 2016. Firstly, we introduce the applications of AIEgens in bio or bio-based polymers, involving the topics of protein conformations, protein fibrillation, enzyme activity, DNA synthesis, DNA sequences, and DNA G-quadruplexes. Then, the advancements of AIE technology in the synthetic polymer field are illustrated, such as visualization of polymerization reactions, polymer self-assembly, physical property investigations (solubility parameter, crystallization, glass transition, and phase separation), response to multi-stimuli (humidity, heat, pH and others), and energy conversion. Lastly, perspectives on the further development of AIE technology in the polymer field are given. We hope that the results presented in this paper will create sparking inspiration for the combination of AIE technology with polymers.
2. AIEgens in biological polymers
Biological polymers, such as lipids, nucleic acids, proteins, and starch, make up the building materials necessary for life. These 3D polymers undergo conformational changes and transitions at the level of secondary, tertiary and quaternary structures associated with the processes of unfolding, folding, dissociation, denaturation, aggregation, fibrillation and so on.20 Due to the recognition of their biological significance, great efforts have been carried out to develop techniques to gain a deeper understanding of these processes. Thus, AIE-based fluorescence methods are designed to monitor the conformation and structure of proteins and DNA for the high sensitivity of their emissions to the environment and to the changes of protein/DNA conformation and interaction.
2.1 Protein conformation
The conformations of proteins involve folding and unfolding processes and alter under a subtle environmental change to affect their properties.46 To decipher how the change occurs and shed light on the relationship between structural dynamics and protein function, monitoring the protein conformation in real-time and in situ is of great importance. Utilizing the RIM mechanism of AIEgens caused by hydrophobic interactions, the unfolding process of human serum albumin was found to involve molten globule intermediates amidst a multistep transition.47 To further monitor unfolded and folded proteins in a biological environment, tetraphenylethylene maleimide (TPE-MI) was designed to measure the proteostasis process.48 The emission of TPE-MI was specifically activated by reacting with the exposed thiols group. When the protein was unfolded, thiols buried in the core were exposed to the surface, enabling proxy reporters to qualitatively evaluate the unfolded level (Fig. 2A). To confirm the feasibility of TPE-MI for probing protein unfolding, its reactivity to different proteins was investigated. As shown in Fig. 2B, β-lactoglobulin, which contains thiol buried in the core of the folded state, displayed a far greater reactivity to TPE-MI when unfolded with guanidine hydrochloride. However, ubiquitin with no thiol groups showed no reactivity to TPE-MI in both the folded and unfolded state. Amidst environment changes, how TPE-MI monitors the unfolded protein in cells was then investigated. After heat shock treatment, the fluorescence of TPE-MI increased dramatically and then recovered (Fig. 2C and D). This process was proved to be advantageous when compared with other methods that required an ectopic expression of protein reporters. The AIE-based strategy to evaluate the conformation of proteins is facile, in real-time, in situ, and visual, thus holding promise to probe proteostasis mechanisms in diseases.
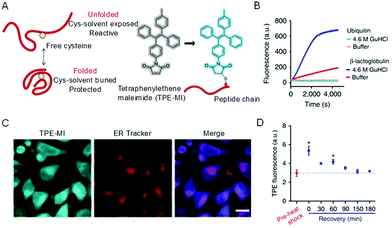 |
| | Fig. 2 Strategy for assaying protein folding via access to buried cysteine thiols. (A) Proposed differentiated cysteine labeling in folded and unfolded states and the labeling reaction. (B) Tests on two proteins (β-lactoglobulin and ubiquitin) in folded native (in buffer) and unfolded (treated with 4.6 m GndHCl) states. (C) Confocal microscopic images of HeLa cells stained with TPE-MI and ER Tracker, respectively, and their merged images. Scale bar = 20 μm. (D) Heat-shock treatment of HeLa cells at 42 °C for 45 min and subsequent time course of recovery at 37 °C. Reproduced from ref. 48 with permission from Nature Publishing Group. | |
2.2 Protein fibrillation
Protein fibrils, filaments, and fibers are large ordered protein aggregates and are involved in the transition of soluble, functional proteins into insoluble aggregates. They are associated with various debilitating disorders, such as Parkinson's disease, Alzheimer's disease, and Huntington's disease.49 Undeniably, understanding the mechanics in molecular detail of the process of protein deposition and the sensitive detection of plaques and protein tangles is essential for diagnostics due to its involved therapeutic implications. It is worth mentioning that soluble oligomers are the significantly toxic substances associated with the pathology of the disease.50,51 Thus, monitoring the early stages of protein aggregation is of great importance. The fibrillation process of α-synuclein (α-Syn) was followed by utilizing TPE-TPP as a fluorescent probe (Fig. 3).52 TPE-TPP showed a stronger fluorescence in the presence of protein fibrils and demonstrates a higher sensitivity to α-Syn oligomers than the traditional ThT due to its AIE characteristics (Fig. 3A). Using sensitive TPE-TPP, a stepwise increase in the progression of insulin amyloid fibril from monomers was observed. Each fluorescence polarization (FP) of TPE-TPP had similar magnitudes.53 Therefore, the fibrillary assembly of proteins can be monitored in situ, while the oligomeric assemblies are mapped based on FP measurements of TPE-TPP (Fig. 3B). Based on the AIE technology, different model fibrillation processes have been carried out, including insulin, α-Syn, and alpha-beta amyloids. Importantly, the AIE-based fluorescent probes not only observe the amyloidogenesis kinetics but also impede the nucleation process and act as an anti-amyloid inhibitor in vivo.54 Therefore, AIEgens can provide an effective strategy for real-time and in situ monitoring of different processes involved in protein aggregation and fibrillation.
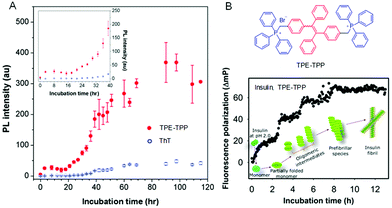 |
| | Fig. 3 Monitoring of protein fibrillation by AIE-active TPE-TPP and commercial ThT. (A) PL intensity of TPE-TPP (red, 15 mM) and ThT (blue, 15 mM) monitoring α-Syn (5 mM) fibrillation. Inset: α-Syn fibrillation from t = 0 to 40 h. (B) Structure of TPE-TPP and the time-dependent change of FP (ΔmP) of TPE-TPP (20 μM) during amyloid fibril formation of insulin. Reproduced from ref. 53 with permission from ACS Publications. | |
2.3 Enzyme activity
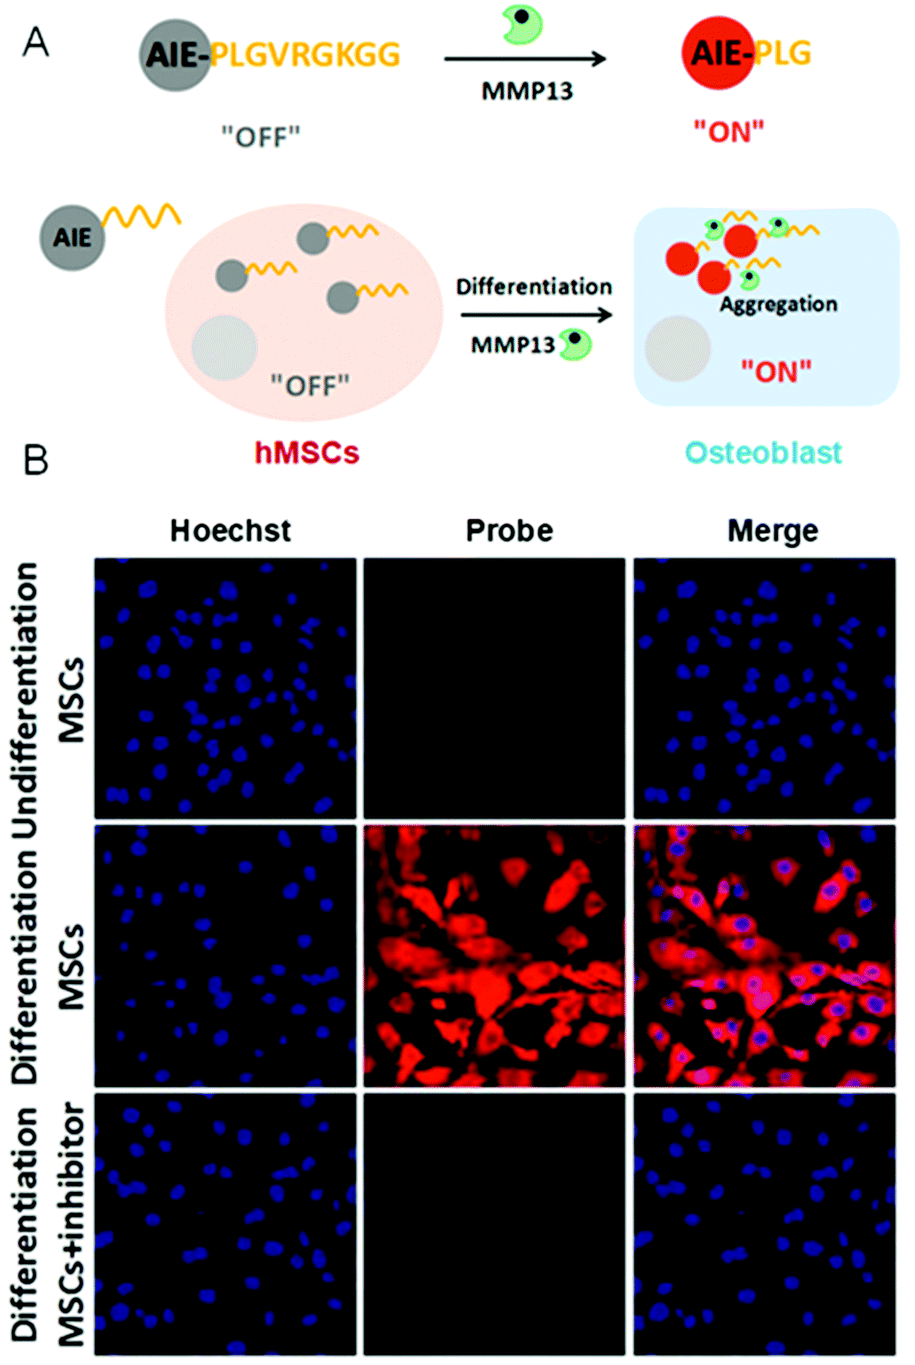
Enzymes are composed of proteins with complicated structures and perform essential tasks to keep us alive.55 Notably, some enzymes appear to be directly involved with specialized processes and the development of some diseases, such as cancer, diabetes, neurogenic disease, and so on. Thus, it is indispensable to study their biological fundamentals. In other words, monitoring the enzyme activity in some sense is to visualize the enzyme-related physiological processes. There are two general strategies to monitor the enzyme activity by AIE-based probes. They are: AIEgen (1) as part of the enzyme substrate or (2) as a probe to monitor the enzyme products. For the first one, the hydrophobic AIEgen was linked to a hydrophilic motif by a group that could be cleaved by the enzyme, triggering the aggregation of AIEgens. Using this strategy, the activity of matrix metallopeptidase 13 (MMP-13) was monitored (Fig. 4A).56 Osteoblastic lineage was differentiated by osteogenic inductive factors induced in mesenchymal stem cells (MSCs) to make MMP-13 remarkably expressed. As shown in Fig. 4B, AIEgen probes detected the enhanced MMP-13 activity in cells that underwent osteogenic induction treatment. However, no fluorescence was detected in undifferentiated cells and cells with inhibitor. Such an approach enables facile, semi-quantitative and real-time evaluation to determine the extent of differentiation in stem cells. Using this principle, many critical physiological processes were studied by monitoring the associated enzyme activity. For instance, cell apoptosis was observed in real-time by lighting up AIE probes through caspase-3/-7 detections.57 In the second method, the AIEgens are lit up by enzymatic products through which the enzyme activity could be assessed. For example, L-lactate oxidase activity was quantified by the byproduct (H2O2) of the lactate oxidant using a reaction-based AIE-active turn-on bioprobe in a real-time manner.58 The obtained information was used to study enzyme efficiency. In short, the AIE-based strategy shows high efficiency, low cost and simplicity, and provides powerful support for real-time imaging of a variety of live cell physiology processes by measuring the related enzyme activity. To effectively evaluate the enzyme activity in vivo, further development of specific bioprobes with emissions in the near-IR and red regions will be needed.
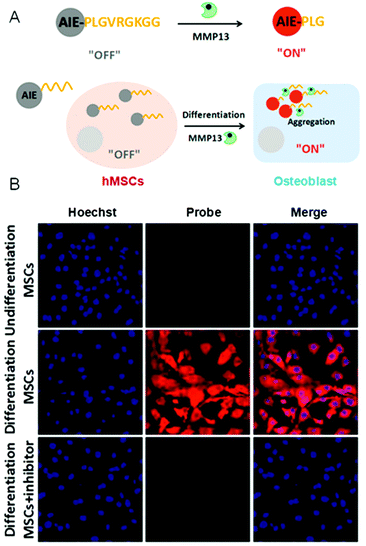 |
| | Fig. 4 (A) A schematic illustration of the AIEgen probe for MMP-13 detection. (B) Confocal images of undifferentiated and differentiated hMSCs after incubation with AIEgen probe. Reproduced from ref. 56 with permission from Wiley-VCH. | |
2.4 DNA synthesis
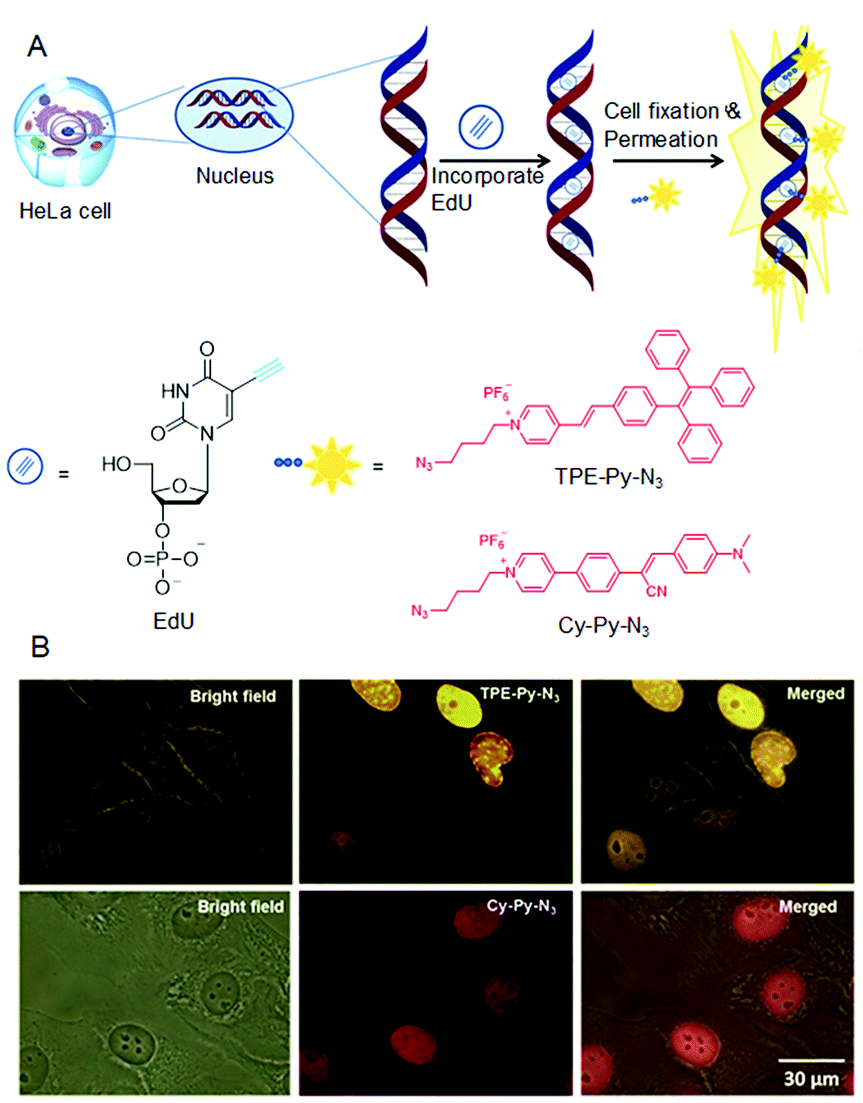
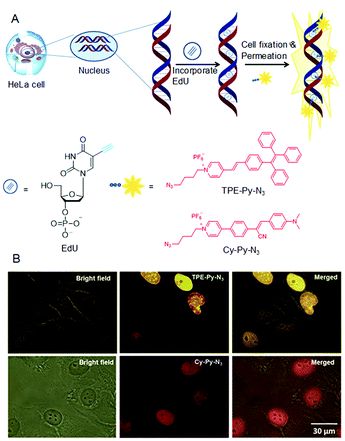
DNA synthesis and replication occur during the “S-phase” in eukaryotic cell cycles. In a complicated system, it is imperative to understand the molecular mechanisms of DNA synthesis. Although radioactive probes are successful for labelling of mitotically active cells, their hazardous nature, high-cost and poor resolution limit their use for rapid high-throughput studies. This tough problem was addressed by using azide-functionalized AIEgens, which could detect DNA synthesis and cell proliferation based on 5-ethynyl-2′-deoxyuridine (EdU) assay techniques.59 In this method, the alkyne modified EdU will be incorporated into newly synthesized DNA before the azide–alkyne cycloaddition reaction with the azide functionalized dyes catalyzed by Cu(I) complex. Sequentially, dye-labelled double-stranded DNA had been generated (Fig. 5A). As shown in Fig. 5B, the nuclei were discernible because the EdU was pre-labelled with TPE-Py-N3/Cy-Py-N3. Hence the DNA synthesis during cell proliferation was able to be monitored in situ. Alexa-azide is presently used to detect DNA synthesis. However, the current AIEgens exhibited better performances. Therefore, the AIE-based strategy has potential for many high-throughput studies due to its simple accessibility, high brightness, low cost and superior photostability.
 |
| | Fig. 5 (A) DNA synthesis detection by AIEgens through EdU assay. (B) Detection of S-phase DNA synthesis in HeLa cells by fluorescence microscopy. The HeLa cells were labelled with EdU by incubating with EdU in modified essential medium for 6 h. Reproduced from ref. 59 with permission from RSC Publishing. | |
2.5 DNA sequence
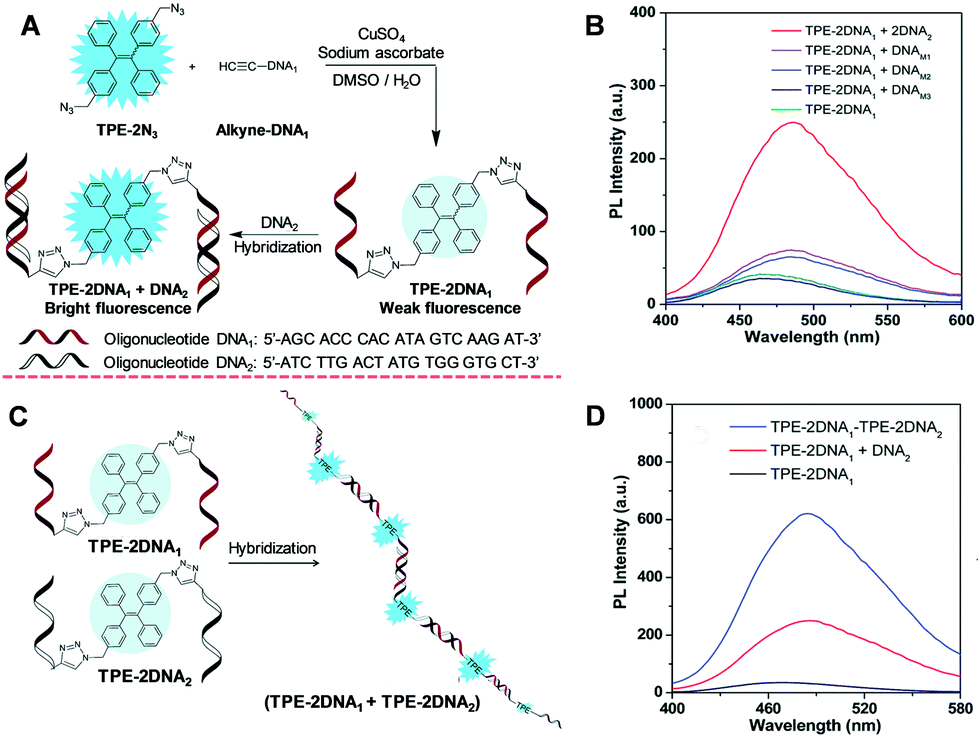
Specific DNA sequence analysis hold promise for early diagnosis of diseases because a large variety of human diseases are related closely to gene mutations. Thus, specific sequence fluorescent probes with a specific sequence were designed to differentiate strands that are perfectly complementary from those of mutation points. The fluorescence signal varied due to the hybridization. Molecular beacon and binary probes are the common designs of the hybridization probes, and a variety of probes are developed based on further extension of these principles. The proof-of-concept work has successfully demonstrated the feasibility of sequence-specific detection by AIE-oligonucleotide conjugates.60 Of course, there is much room for improvement. To increase the sensitivity, two-armed oligonucleotide conjugated AIEgens were designed and their emission was enhanced by complexation with a complementary strand by up to 6.1-fold.61 The PL enhancement of one-base mismatch and two-base mismatches were 2.1 and 1.8-fold, respectively (Fig. 6A and B). These results suggest that there is a respectable promise for homogenous specific-sequence detection of DNA, and these AIE-oligonucleotide conjugation probes can discriminate one base mutation. Additionally, the DNA self-assembly was investigated with enhanced fluorescence (Fig. 6C and D). Compared with the fluorophore/quencher mechanism or FRET dual-labelled based probes, the AIE-DNA probes possessed the advantages of good tolerance, low cost and ready availablity for an extensive array of oligonucleotide sequences.
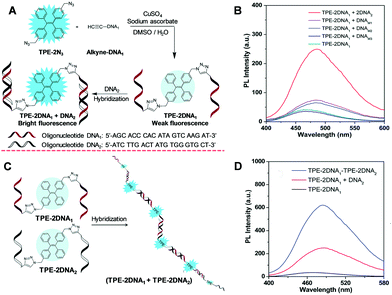 |
| | Fig. 6 (A) A schematic illustration of the application of TPE-2N3 for nucleic acid hybridization detection. (B) PL intensity of TPE–2DNA1 in the absence and presence of complementary DNA2, one-base mismatched single-stranded DNAM1, two-base mismatched single-stranded DNAM2 and random single-stranded DNAM3. (C) Schematic diagram of the self-assembled duplex (TPE–2DNA1 + TPE–2DNA2) upon hybridization. (D) PL spectra of the TPE–2DNA1 duplex with a complementary strand and self-assembled duplex. Reproduced from ref. 61 with permission from RSC Publishing. | |
2.6 G-quadruplex
Nucleic acids can fold to form non-canonical or fully paired secondary nucleic acid structures with diverse biological functions. G-quadruplex DNA/RNA formed by genomic sequences are abundant in guanine and due to their biological significance, they have encountered substantial attention. It is a widespread acknowledgment that the unfolding and folding of RNA G-quadruplex structures plays an essential role in biological on–off switches for controlling various cellular events.62 DNA G-quadruplexes are related to DNA replication, oncogene transcriptional regulation and telomere stability.63 Thus, deciphering the relationship between the formation of G-quadruplexes and their cellular consequences allows us to better understand their processes.
A label-free and water-soluble AIEgen called TTAPE was used as a light-up probe for a DNA assay.64 The non-emissive TTAPE becomes luminescent when bound to G1 through electrostatic attraction due to RIM. After the formation of a G-quadruplex structure induced by K+ addition, the emission red-shifted. However, the G-quadruplex unfolded when hybridization occurred with a complementary ssDNA (C1) to produce a duplex. Thus, the dye was released to the solution to cease the emission. Using TTAPE, different phases of mitotic cell division of onion root-tip cells could be observed clearly (Fig. 7B).64,65 Although TTAPE can be utilized to study conformational structures and monitor folding processes of G-rich stranded sequences, it is necessary to track the G-quadruplex dynamics in cells. Thus, there is still room for further improvements. The criteria of an exemplary probe for monitoring G-quadruplex structures in living cells should include fluorescence detectability, good membrane permeability, high photostability, low toxicity and high selectivity for G-quadruplexes with a variety of nucleic acid structures. Due to the prosperity of the AIE and RIM mechanism, it is suitable to develop novel AIEgens for monitoring the secondary structure of DNA/RNA, which will, in turn, discover additional features regarding biological roles.
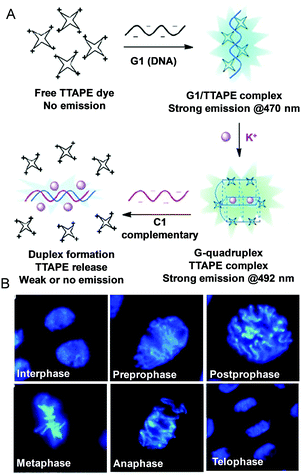 |
| | Fig. 7 (A) Fluorescent bioprobing processes of TTAPE. (B) Fluorescence images of cells from onion root tips at different stages of the cell cycle stained by TTAPE. Reproduced from ref. 64 and 65 with permission from Wiley-VCH. | |
3. AIEgens in synthetic polymers
Synthetic polymers are of vital importance for modern society. Monitoring how synthesis occurs and what characteristics they possess plays essential roles in industrial examinations and daily life. Despite this, strategies are required for visualizations in real-time and in situ as traditional techniques currently used for characterizations are inconvenient in giving an accurate synthetic portrayal.
3.1 Polymerization reaction
Industrial and academic fields place great efforts on understanding and monitoring polymerization mechanisms in situ mainly to prevent explosive reactions. However, methods currently employed, such as dilatometry, rheometry or viscometry, can merely gain the macroscopic viscosity. Indeed, information at the molecular level is more favored.66
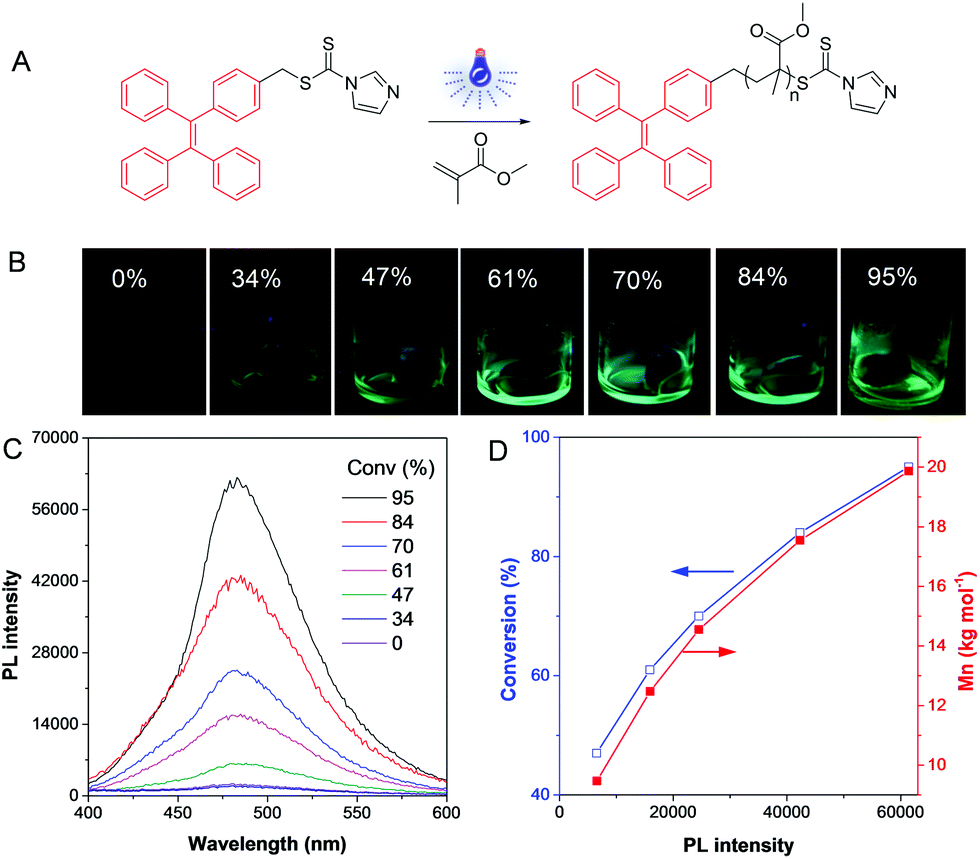
Recently, some polymerization processes were able to be monitored and visualized in situ directly based on AIE technology. TPE-containing dithiocarbonates were synthesized and screened as agents for reversible addition fragmentation chain transfer (RAFT) polymerizations (Fig. 8A).27 The TPE-based RAFT agents were non-emissive in both solution and solid states as the carbonyl sulfur groups quenched the emission of the molecules via photoinduced electron transfer (PET). To ensure in situ visualization, we used visible light to initiate the RAFT polymerization at room temperature owing to the characteristic of spatial-temporal control of photochemistry. When the polymerization proceeded, the PET effect disappeared as the TPE unit was no longer linked to the dithiocarbonate group. Accordingly, the system emitted strongly with an increase of the medium viscosity (Fig. 8B). It should be noted that this dye chain-end labeling method could reflect the quantitative information of the polymerization system rather than affecting the intrinsic properties of the polymers. In addition, the fluorescence turn-on character provided high-contrast PL signal, so that accurate information about polymerization, such as molecular weight and conversion could be facilely obtained (Fig. 8C and D). This approach was applicable to various polymerization systems, and even the gel content could be achieved without destroying the reaction system. Thus, by incorporation of AIEgens into catalysts, various types of polymerizations were able to be visualized.
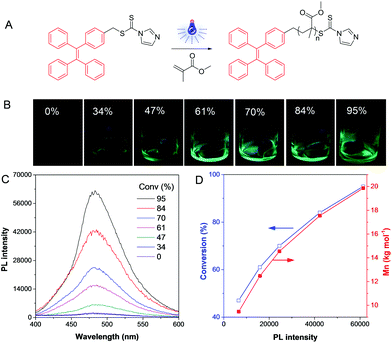 |
| | Fig. 8 Visualization of visible light-induced RAFT polymerization. (A) Illustration of the reaction process. (B) Fluorescent photos of the polymer solutions at different conversions taken under 365 nm UV irradiation from a hand-held UV lamp. (C) PL spectra of the polymerization mixtures at different conversions. (D) The exponential relationship of conversion and Mn with PL intensity. Reproduced from ref. 27 with permission from Wiley-VCH. | |
3.2 Self-assembly
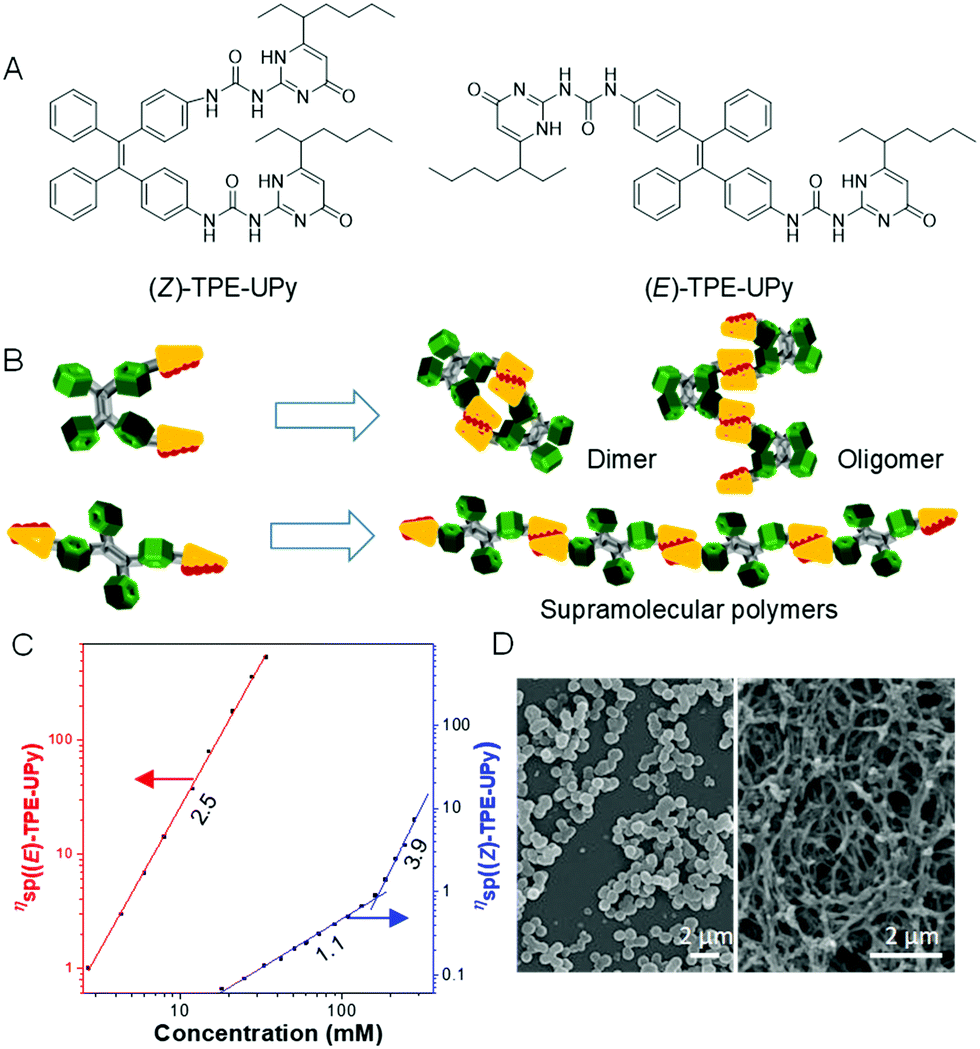
Self-assembly involves the formation of an ordered structure from a disordered system by non-covalent interactions such as π–π interactions, hydrogen bonding, chirality effect and charge/electrostatic interactions, and plays an important role in materials synthesis.67–69 Among which, supramolecular polymers have received considerable attention, owing to their unique mechanical properties. However, the presence of (Z)-/(E)-isomers of materials makes the study of the properties, behaviors and interactions of supramolecular polymers complicated. To address this issue, we successfully developed two pure isomers, ureidopyrimidinone-functionalized TPE, namely (Z)-TPE-UPy and (E)-TPE-UPy, with both the AIE characteristic of TPE and the supramolecular polymerizability of UPy (Fig. 9A).70 It is noted that the two isomers display different fluorescent emissions: (E)-TPE-UPy (479 nm) emitted a more blue fluorescence than (Z)-TPE-UPy (495 nm). This result motivated us to investigate whether they exhibit distinct self-assembly behaviors. From their structures, we speculated that (Z)-TPE-UPy was prone to form cyclized molecules or oligomers, due to the close proximity and steric hindrance of the two UPy units (Fig. 9B). However, the trans structure of (E)-TPE-UPy favored the formation of a linear supramolecular polymer by linking the monomers through a quadruple hydrogen bond. To prove the reaction mechanism of the two isomers, viscosity experiments were carried out. As shown in Fig. 9C, a significantly enhanced viscosity of (E)-TPE-UPy at a lower concentration than that of (Z)-TPE-UPy confirmed our proposed mechanism as isodesmic (polymer) and ring-chain (small ring and oligomer) ones for (E)-TPE-UPy and (Z)-TPE-UPy, respectively. These mechanisms were also proved from SEM images of different morphologies to the isomers (regular nanoparticles vs. cable-like structures) (Fig. 9D).
 |
| | Fig. 9 (A) Structure of (Z)-TPE-UPy and (E)-TPE-Upy. (B) Schematic presentation of supramolecular polymerization of (Z)- and (E)-TPE-UPy. (C) Dependence of the specific viscosity of (Z)- and (E)-TPE-UPy in chloroform at 298 K on the solution concentration with best-fit lines and slopes. (D) SEM images of particles of (Z)-TPE-UPy (left) and nanofibers of (E)-TPE-UPy (right). Reproduced from ref. 70 with permission from ACS Publications. | |
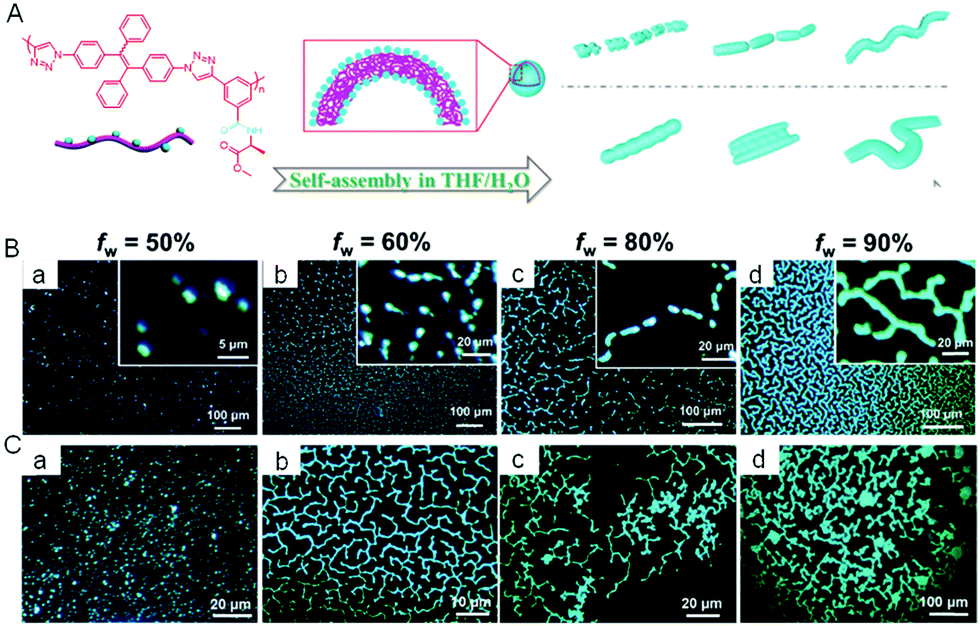
The self-assembly of covalently-linked polymers was also studied using AIE technology. We synthesized a chiral polytriazole polymer called P(TPE–alanine) with TPE as a backbone and alanine as a side chain (Fig. 10A).71 The resulting material displayed a typical AIE property and self-assembling capacity in water induced by chiral amino acid units. By tuning the water content of a dilute polymer solution (10−4 M), the nanostructures formed underwent a morphological transition from vesicle, to pear-necklace, to helical nanofibers and then to microfibers (Fig. 10B). At a high polymer concentration (5 × 10⁻⁴ M), microaggregates were formed, giving a better contrast and characteristic information of fluorescent assemblies (Fig. 10C).
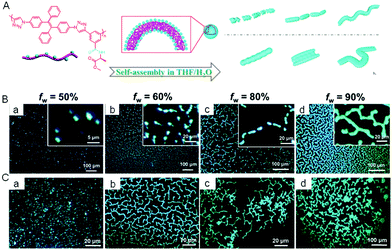 |
| | Fig. 10 (A) Schematic representation of the self-assembly and morphology transition processes of P(TPE-alanine) in THF/H2O mixtures with different concentrations and water fraction. Fluorescence images of P(TPE-alanine) in THF/H2O mixtures with different water fractions and concentrations: 10−4 M (B) and 5 × 10⁻⁴ M (C). Reproduced from ref. 71 with permission from RSC publishing. | |
In addition, AIE technology can also be utilized to visualize the dynamic interfacial self-assembly processes. By using an AIE-active polymer, a battery of multifaceted interfacial processes, such as coffee-ring, microemulsion and breath figure evolution, were clearly visualized.72 The simple yet highly sensitive and specific technology allows for the precise observation of the “interfacial world”.
3.3 Physical processes
The physical properties of polymers are of vital importance to guide their practical applications. Traditionally, these important parameters are analyzed by specific instruments. Now, some of these properties can also be studied using AIE technology. Based on the RIM mechanism, when AIEgens are “married” with polymers, the properties of the polymers can be investigated through PL measurement.
3.3.1 Solubility parameter.
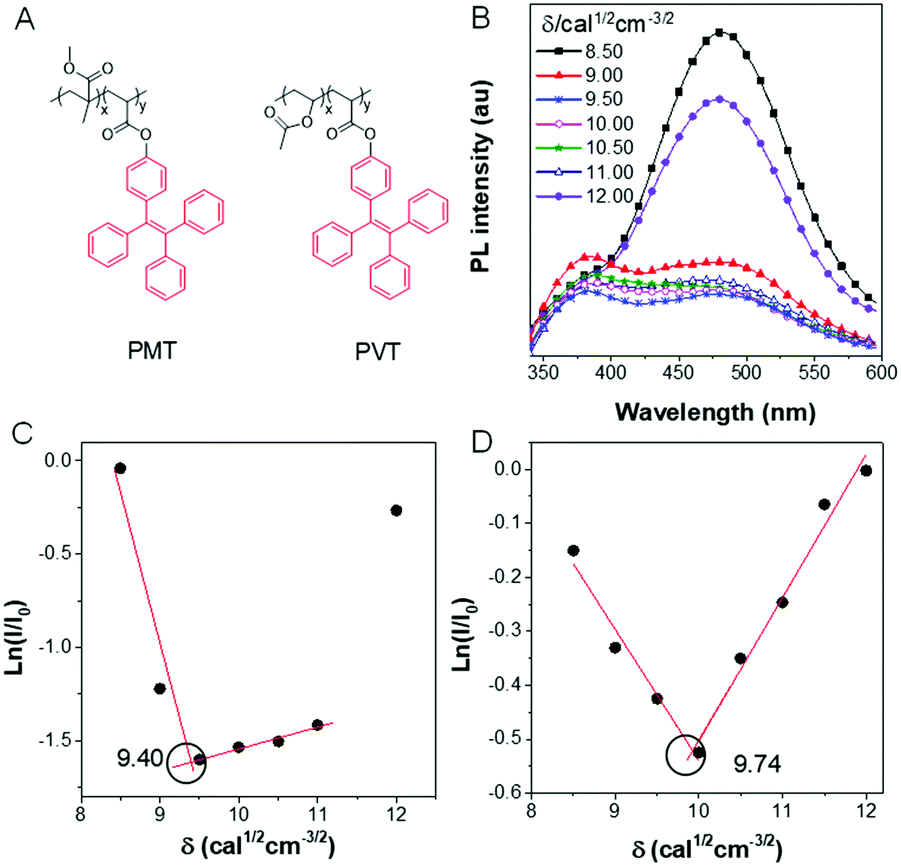
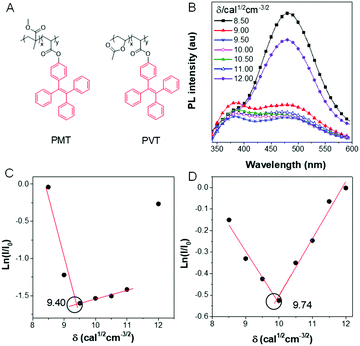
The solubility parameter (δ) reflects the degree of interaction of materials with solvents and provides a good indication of solubility. When a typical AIEgen, tetraphenyl ethane (TPE) was incorporated into a polymer (Fig. 11A), the change of PL intensity in solution could reflect the state of the chain conformation (Fig. 11B).73 The δ of the solvent, in which the polymer chains were in the fully stretched conformations, could serve as the δ of the polymer itself. As shown in Fig. 11C and D, the PL of the polymer PMT changed significantly with the solvent δ. The δ values of poly(methyl methacrylate) and polyvinyl acetate were 9.40 and 9.74 cal1/2 cm−3/2, respectively, which is much more accurate than the traditional turbidimetric titration method.
 |
| | Fig. 11 (A) Chemical structure of PMT and PVT. (B) PL intensity of PMT in solvents with different solubility parameters. Plots of ln(I/I0) of (C) PMT and (D) PVT to confirm the solubility parameter. Reproduced from ref. 73 with permission from MDPI journals. | |
3.3.2 Glass transition temperature.
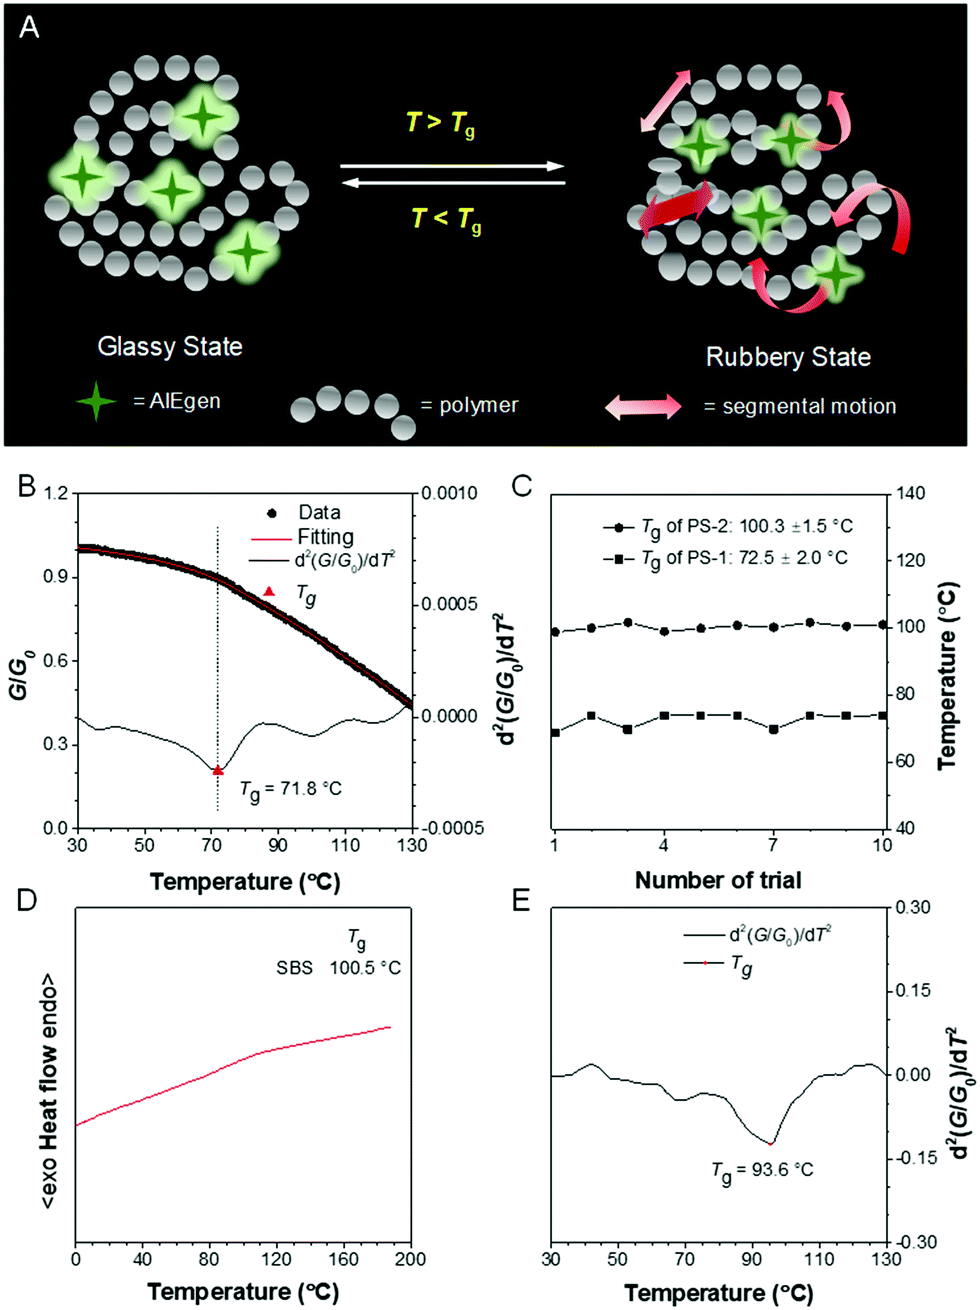
The glass transition temperature (Tg) of polymers is also crucial because it is closely associated with their application environment. During the glass transition process, the segmental motion of polymer chains may reduce the rigidity of the local microenvironment. Thus, according to the RIM mechanism, such variations can be reflected by the emission change of the doped AIEgens (Fig. 12A). Traditionally, a PL spectrometer is an indispensable tool to record the temperature-dependent fluorescence of physically doped materials.74 Although this method shows excellent feasibility and sensitivity, it is not suitable for on-site inspection. Now we developed a new approach using a camera and a programmed heating stage. A camera was utilized to monitor and capture fluorescent images of AIEgen-doped polymer films at different temperatures and the grayscale (G) of selected areas was analyzed through a MATLAB program.75 The relative grayscale (G/G0) against temperature was plotted (Fig. 12B). The Tg was determined at a point where a slope change occurred. The second derivative treatment helped further precise assignment of Tg. This method demonstrated excellent reproducibility (Fig. 12C). Moreover, in some cases, DSC failed to display the distinct heat flow involved in the glass transition (Fig. 12D). However, our method could still give a clear, reliable Tg (Fig. 12E). Thus, this method is a versatile technique with high commercial value for high-throughput Tg measurement.
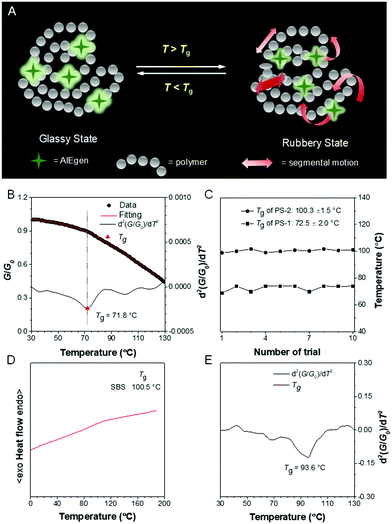 |
| | Fig. 12 (A) Working principle of AIEgens in Tg detection. (B) Change of relative grayscale (G/G0) of AIEgen-doped polystyrene film with temperature and the associated fitting curve as well as the second derivative of the fitting curve to reveal the change of G/G0 at different temperatures. (C) Reproducibility test for Tg detection in polystyrene with different molecular weights. (D) DSC thermograms of poly(styrene–butadiene–styrene) recorded during the second heating cycle. (E) The second derivative of the fitting curve revealed the change of G/G0 of the AIEgen-doped poly(styrene–butadiene–styrene) at different temperatures. Reproduced from ref. 75 with permission from ACS publications. | |
3.3.3 Crystallization.
Crystallization of polymers is a self-assembly process associated with the partial arrangement of molecular chains. These chains fold together and arrange into ordered regions named lamellae, which gather together to become larger spheroidal structures called spherulites.76 Here, we reported a general approach to tune the alignment of AIEgens by polymer crystallization. Semi-crystalline poly(ε-caprolactone) capped with TPE was synthesized (Fig. 13A).77 During crystallization of polymers, the TPE molecules were expelled out of lamellae and finally immigrated to the surface (Fig. 13B). This crystalline nanosheet with dangling TPE molecules exhibited a sensitive and specific response to explosives.
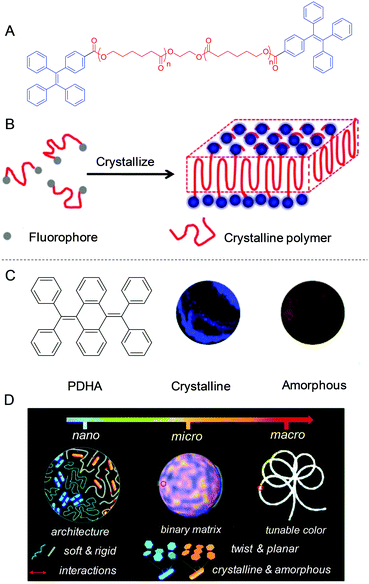 |
| | Fig. 13 (A) The structure of PCL-TPE. (B) Schematic illustration of crystallization-induced nano-sheets of fluorescent polymers. (C) Chemical structure of PDHA and the fluorescent images of its crystalline and amorphous aggregates. (D) Schematic illustration of the fluorescence color-tuning process by changing the polymer network rigidity to afford AIE crystalline and amorphous nano-blocks in the desired compositions. Reproduced from ref. 77 and 78 with permission from ACS and RSC publications. | |
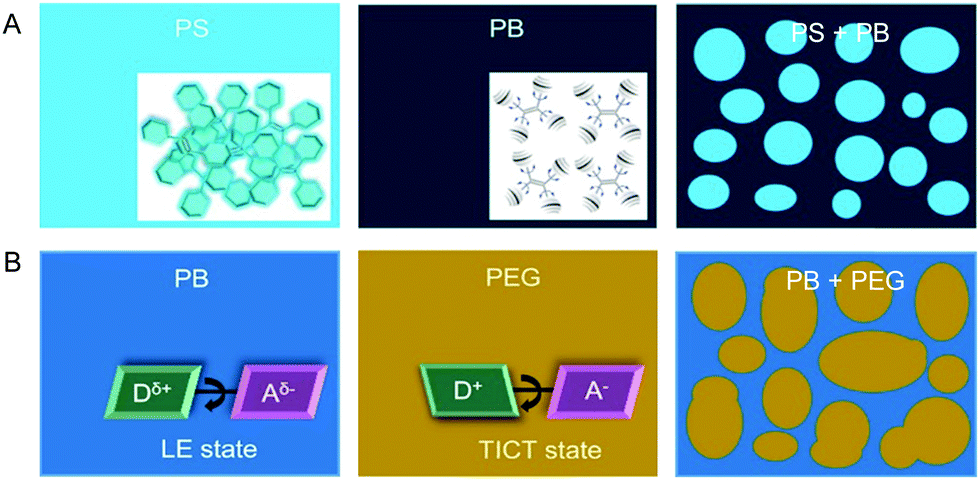
AIEgens with twisted structures allow facile molecular alignment to achieve different photophysical properties. We developed a new approach to tune the packing modes of AIEgens by doping them into the polymer matrix. As shown in Fig. 13C, AIEgen PDHA was selected as it displayed intrinsic blue and yellow emissions in the crystalline and amorphous state.78 By further engineering the microstructure of the polymer matrix by physical blending of rigid polystyrene (PS) and soft polybutadiene (PB), the emission of the doped PDHA could be finely tuned. Owing to the immiscibility of these two polymers, a distinct phase-separated morphology was observed. Interestingly, crystalline and amorphous AIEgen assemblies were locked in the soft and rigid domains of the polymer blend. The soft domain was favorable for AIEgens to undergo molecular motions to form crystalline aggregates. On the other hand, the rigid domain restricted the molecular motion of AIEgens. Thus, only amorphous assemblies were formed. White light-emitting materials based on a single AIEgen could be obtained by mixing blue and yellow emissions (Fig. 13D). Simultaneously, the single-molecule-based materials obtained showed white light emissive characteristics and could form 1D, 2D, and 3D architectures in white lighting buildings and fibers and films.
3.3.4 Microphase separation.
Understanding the phase separation in immiscible polymer blends is of great academic and industrial importance as the separated morphology affects the quality of the resulting material. Traditional detection technologies are time-consuming and often involve destructive sample preparation procedures.79 We tried to visualize the micrometer-sized phase separation in polymer blends utilizing a simple, fast AIE technology. On the basis of the AIE mechanism, the mechanism for visualization of phase separation was shown in Fig. 14.80 The AIEgens doped in the rigid domains emitted intensely owing to the stronger RIM effect. However, in soft domains, the AIEgens were weakly or non-fluorescent due to the active molecular motions. Therefore, from the distinct fluorescence distribution, we could clearly differentiate the phase separation in polymer blends, such as high-impact PS (blend of rigid PS and soft PB). However, for some polymer blends with similar rigidity, it is difficult to differentiate the phase separation merely using the RIM mechanism. Fortunately, AIEgen with TICT properties was able to solve this problem as the emission of the dye can be red-shifted in a polar environment. Thus, AIEgens with TICT properties can distinguish polymer blends with different polarities from different emission colors. On the other hand, the AIEgen is found to differentiate block copolymers from polymer blending, owing to the mutual interference of each block to the AIEgen.81 These reports enrich the application spectrum of both AIEgen probes and fluorescent microscopes.
 |
| | Fig. 14 Schematic representation of the proposed working mechanisms for the visualization of phase-separated morphology in polymer blends using fluorescent AIE probes. (A) AIEgens operated under the RIM mechanism were capable of visualizing and differentiating polymer blends with different rigidities from the varied emission intensities. (B) AIEgens with TICT properties could distinguish polymer blends with different polarities from the different emission colors in the respective polymer component. Reproduced from ref. 80 with permission from ACS publications. | |
3.4 Stimuli response
AIE-based fluorescent probes are suitable as sensors for detecting different stimuli responses including humidity, temperature, pH, mechanical force, solvent, and light intensity, due to their simple accessibility, fast response, high sensitivity and noninvasive detection.
3.4.1 Humidity.
A visual relative humidity (RH) sensing approach was presented to transform the invisible RH information into various visible fluorescent colors by encapsulating AIEgens with TICT effects into the network of moisture-captured polyacrylic acid (PAA). Results showed that the emission color red-shifted progressively with an increase of RH. A linear relationship existed between RH in a broad range of 0–99% and the emission wavelength (Fig. 15A).82 An AIEgen-coated LED chip was fabricated to further demonstrate the RH quantification (Fig. 15B). No emission color change was observed in the absence of water vapor, whereas a more red emission was detected upon water vapor exposure. Moreover, inspired by traffic lights, integration of a transparent AIEgen-doped film with a UV LED enabled the development of a smart humidity-based LED light (Fig. 15C).
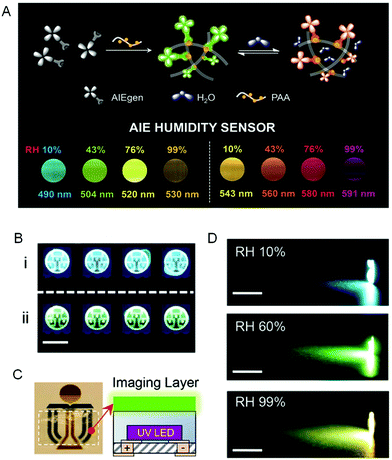 |
| | Fig. 15 Humidity-sensitive fluorescent sensors. (A) Schematic illustration of the fluorescence process and the fluorescent images of (left) TPE-Py and (right) TPE-VPy embedded in PAA at various RH taken under 365 nm UV light irradiation. (B) Demonstration of humidity sensing in packaging. Fluorescent images of LED chips deposited with TPP encapsulated with (i) and without (ii) silicone taken under UV light. The scale bar was 5 mm. (C) An image of the flexible transparent humidity-sensitive imaging film of TPP taken under daylight. The dotted line indicated the boundary of the film (left). (D) The images of a UV LED flashlight covered with TPP film at RH of 10%, 60%, and 99%, respectively. The scale bar was 1 cm. Reproduced from ref. 82 with permission from RSC publishing. | |
Sensory feedbacks and dynamic colorations of RH were provided in a gradient, continuous and beautiful fashion as the light color continuously and automatically changed from orange to green and then to blue due to the decrease of RH (Fig. 15D). Therefore, sensitive sensing materials with high processibility were produced by utilizing this comprehensive strategy by combining electrospun polymers with AIE sensors.
3.4.2 Heat.
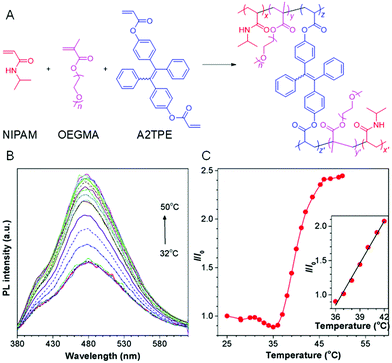
A thermoresponsive AIE-active polymer was successfully synthesized through free radical terpolymerization of N-isopropylacrylamide (NIPAM), oligo(ethylene glycol)methacrylate (OEGMA) and TPE-based diacrylates (A2TPE) (Fig. 16A).83 By tuning the molar ratio of NIPAM and OEGMA, the hydrophilicity of the resulting polymer could be adjusted, which guaranteed the regulation of lower critical solution temperature (LCST). The polymer displayed weak emission below LCST owing to the enhanced solubility. However, the PL signal enhanced gradually with an increase of temperature, because the RIM mechanism was triggered by the precipitation effect (Fig. 16B). The temperature-dependent fluorescence enhancement demonstrated a linear relationship in the sharp temperature range of 36–42 °C, suggesting the high sensitivity of AIEgens (Fig. 16C).
 |
| | Fig. 16 (A) Synthetic routes of thermoresponsive AIE polymers. (B) Temperature-dependent emission spectra of an aqueous solution of the polymer. (C) The emission intensity of the polymer at 478 nm versus the temperature. Inset: The plot of linear fitting of I/I0 from 36 °C to 42 °C. Reproduced from ref. 83 with permission from RSC publishing. | |
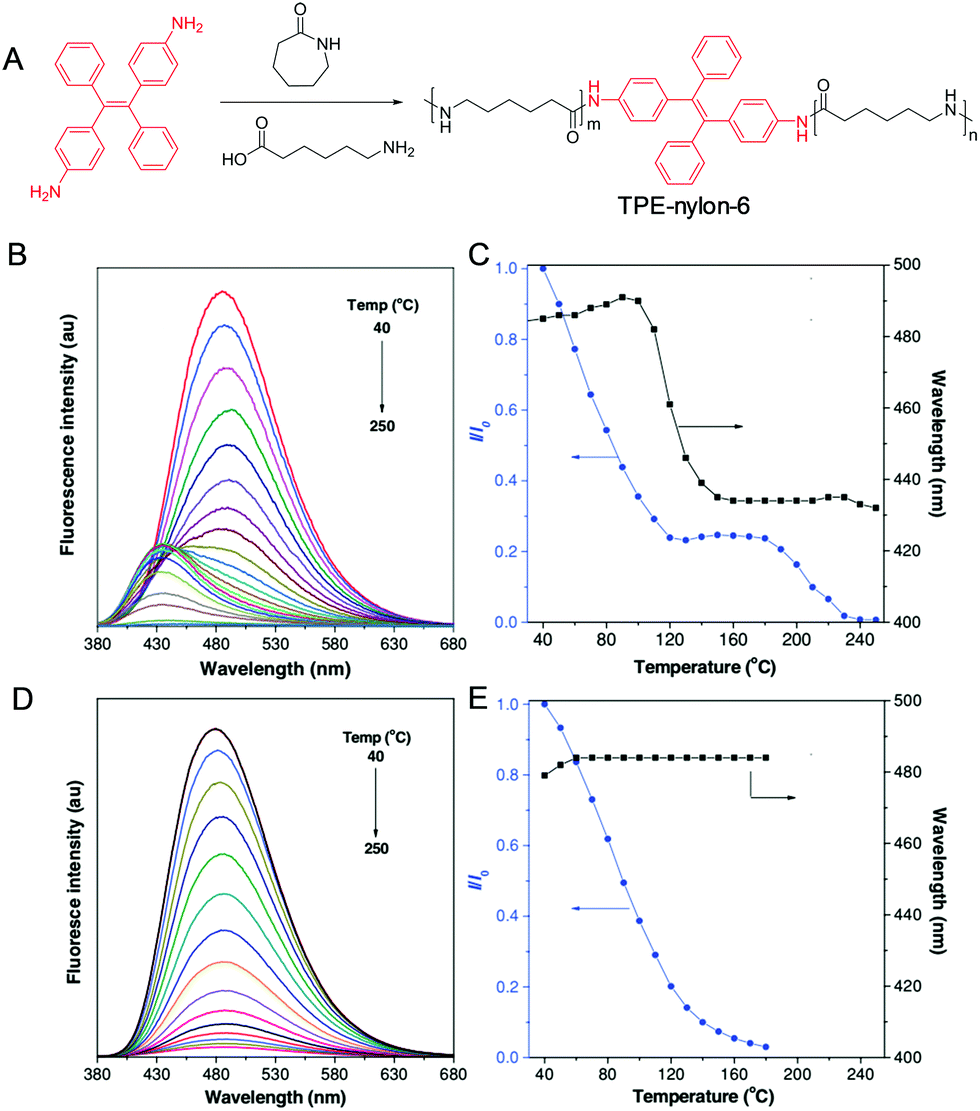
To sense high temperature variation, we incorporate TPE into the backbone structure of nylon-6 (Fig. 17A).84 The resulting TPE-nylon-6 shows an intense blue emission at 485 nm at low temperature (40 °C), which decreases with an increase of temperature (Fig. 17B). Noteworthily, the emission gradually blue-shifts to 432 nm increasing the temperature from 100 to 160 °C (Fig. 17C). As a control, such phenomenon is not found in the TPE/nylon-6 physical blending system (Fig. 17C and D). The thermal-induced fluorescent colour change observed in TPE-nylon-6 may find potential applications in high-temperature detection.
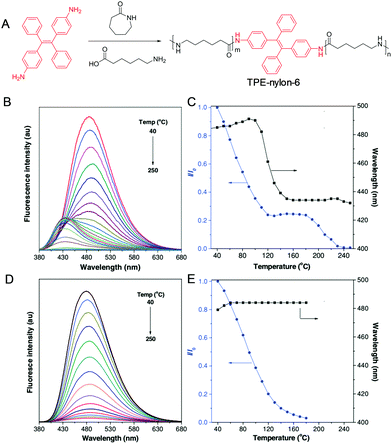 |
| | Fig. 17 (A) Synthetic route of TPE-nylon-6. (B) Fluorescence spectra of (B) TPE-nylon-6 and (D) TPE-doped nylon-6 at different temperatures. Plots of relative fluorescence intensity (I/I0) and emission wavelength of (C) TPE-nylon-6 and (E) TPE-doped nylon-6 versus temperature, where I0 is fluorescence intensity at 40 °C. Reproduced from ref. 84 with permission from Wiley-VCH. | |
3.4.3 Others.
A pH-responsive polymer with AIE attributes was also developed to monitor the variation of pH.85 Some memory chromic polymers were designed and synthesized by combining shape memory polyurethanes with TPE to display reversible mechanochromic, solvatochromic, and thermochromic shape memory effect.86 Some mechanochromic polymers were reported based on the emission variation caused by the crystal-to-amorphous transition.87 In addition, due to their efficient solid-state emissions, AIEgens were fabricated into fluorescent photopatterns for potential anti-fake applications.88 AIE technology could also be utilized as a damage-reporter for polymeric materials.89 Interestingly, by polymerizing conjugated AIEgens to corresponding polymers, the singlet oxygen yield of the materials enhanced significantly.90
3.5 Energy conversion
Luminescent solar concentrators (LSCs) are a promising type of sunlight concentrators, which can harvest light and reduce the required area of expensive solar cells.91–94 LSCs are fabricated by a slab of a highly transparent material (either glass or a polymer such as poly(methyl methacrylate) and polycarbonate) so that the solar light can pass through it without scattering or absorption losses (Fig. 18A).95 However, current LSC systems usually display low power conversion efficiencies owing to the fluorescence quenching caused by dye aggregation. To address this issue, AIEgens with high Stokes shift and quantum yield in the aggregated state are introduced to this field. Furthermore, to improve the light coverage of LSC, we utilize the fluorescence resonance energy transfer (FRET) effect to optimize absorption and maintain high quantum yield by mixing donor and acceptor molecules (Fig. 18B). Noteworthily, LSCs utilizing a donor/acceptor mixture (DPATPAN and PITBT-TPE) display superb optical efficiencies (improvements of 8% at geometric factor (G) = 25) compared to that including only the AIEgen donor owing to the reduced re-absorption losses (Fig. 18C and D).
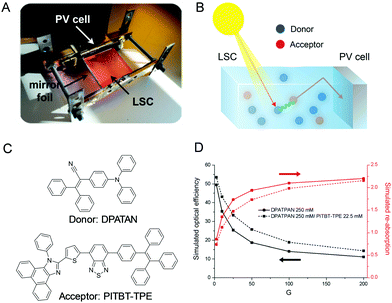 |
| | Fig. 18 (A) Setup used for measuring the optical efficiency. (B) Working principle of an ISC with the typical cascade mechanism via FRET by donor and acceptor fluorophores. (C) Chemical structures of DPATAN and PITBT-TPE. (D) Simulated optical efficiencies (black lines) and re-absorption (red lines) of the LSCs as a function of the geometric factor G. Reproduced from ref. 95 with permission from Wiley-VCH. | |
4. Conclusion
Since the establishment of the concept in 2001, AIE has changed people's way of thinking on the design of luminescent molecules and inspired a revolution of fluorescence detection research. As a cutting-edge fluorescent technology, AIE has embodied a powerful platform for the analysis and visualization of polymer properties, allowing multidisciplinary researchers to participate in this area. The core mechanism of AIE is RIM, stating that isolated fluorophores can trigger fluorescence in addition to aggregation. Such turn-on characteristic of AIEgens is promising for selective, sensitive and reliable analysis detection. One of the most thrilling applications of AIE technology is in biological research, such as detection and imaging of biological polymer structures and bioprocesses. Water-soluble AIEgens are weakly or non-emissive in aqueous media to impart negligible background interference. The fluorescence is recovered through specific interactions with a biological polymer, such as charge/electrostatic interaction, hydrophobic interaction, hydrogen bonding interaction, freezing effect, viscosity effect and chemical reaction. For synthetic polymers, the isolated AIEgen strategy reduces the dye loading in polymers so as to contribute negligible effects on the intrinsic properties of the polymers. Owing to the ultrasensitiveness of intramolecular motions to external fluctuations such as temperature, viscosity or polarity, AIEgens can reflect and visualize the tiny segmental motions or domain polarity. Based on the fluorescence results, we can obtain the glass transition temperature, solubility parameter, crystallinity, phase separation and self-assembly of polymers. On the other hand, by incorporating AIEgens into stimuli-responsive polymers, we can visualize the temperature, pH, and humidity variation of the surroundings.
AIE-related research is increasingly booming and popular and involves interdisciplinary cooperation. Besides further deciphering the underlying mechanism of AIE, developing new functional AIEgens is urgent in view of the diversity of polymers studied. In addition to TICT and PET, AIE can combine with other photophysical phenomena, such as excited-state intramolecular proton transfer (ESIPT) and fluorescence resonance energy transfer (FRET). Furthermore, some special AIEgens with emissive crystalline form and non-emissive amorphous counterparts (vice versa) should also be regarded. In the biological polymer field, the visualization of many important biological processes involving the transition from solution to the aggregate state still remains unexplored. For example, the thrombosis process shows the transition from soluble fibrinogen to insoluble fibrin. Moreover, other biological polymers such as lipid and saccharide are also building blocks of life. Understanding their bioprocess using AIE technology may open up a new avenue. In the synthetic polymer field, visualization of many physical parameters such as the secondary transition below the glass transition temperature, the early stage of crystallization, swelling, stress relaxation and mechanical loss of polymers, remains to be solved. Altogether, polymers make AIE technology fly high and AIE allows polymers to be more powerful.
Conflicts of interest
There are no conflicts to declare.
Acknowledgements
We are grateful for financial support from the National Natural Science Foundation of China (21788102, 21490570, 21490574), the National Key Research and Development program of China (2018YFE0190200), the Research Grants Council of Hong Kong (16308116, and C6009-17G), the Innovation and Technology Commission (ITC-CNERC14SC01 and ITS/254/17), and the Science and Technology Plan of Shenzhen (JCYJ20160229205601482 and JCY20170818113602462).
Notes and references
- M. A. Meyers, P.-Y. Chen, A. Y.-M. Lin and Y. Seki, Prog. Mater. Sci., 2008, 53, 1–206 CrossRef CAS.
- D. Cunliffe, S. Pennadam and C. Alexander, Eur. Polym. J., 2004, 40, 5–25 CrossRef CAS.
- J. J. Green and J. H. Elisseeff, Nature, 2016, 540, 386 CrossRef CAS.
- J. P. Cole, A. M. Hanlon, K. J. Rodriguez and E. B. Berda, J. Polym. Sci., Part A: Polym. Chem., 2017, 55, 191–206 CrossRef CAS.
-
D. W. Van Krevelen and K. Te Nijenhuis, Properties of polymers: their correlation with chemical structure; their numerical estimation and prediction from additive group contributions, Elsevier, 2009 Search PubMed.
- L. Yang, X. Tan, Z. Wang and X. Zhang, Chem. Rev., 2015, 115, 7196–7239 CrossRef CAS.
- D. Estupiñán, T. Gegenhuber, J. P. Blinco, C. Barner-Kowollik and L. Barner, ACS Macro Lett., 2017, 6, 229–234 CrossRef.
- L. Li, L. Ren, L. Wang, S. Liu, Y. Zhang, L. Tang and Y. Wang, RSC Adv., 2015, 5, 25525–25531 RSC.
- S. Reich and Y. Cohen, J. Polym. Sci., Polym. Phys. Ed., 1981, 19, 1255–1267 CrossRef CAS.
- S. C. Tjong, Mater. Sci. Eng., R, 2006, 53, 73–197 CrossRef.
- C. Jung, P. Schwaderer, M. Dethlefsen, R. Köhn, J. Michaelis and C. Bräuchle, Nat. Nanotechnol., 2011, 6, 87 CrossRef CAS.
- M. Beija, M.-T. Charreyre and J. M. Martinho, Prog. Polym. Sci., 2011, 36, 568–602 CrossRef CAS.
- A. M. Breul, M. D. Hager and U. S. Schubert, Chem. Soc. Rev., 2013, 42, 5366–5407 RSC.
- J. Mei, N. L. C. Leung, R. T. K. Kwok, J. W. Y. Lam and B. Z. Tang, Chem. Rev., 2015, 115, 11718–11940 CrossRef CAS.
- Y. Chen, J. W. Y. Lam, R. T. K. Kwok, B. Liu and B. Z. Tang, Mater. Horiz., 2019, 6, 428–433 RSC.
- J. Qi, C. Chen, D. Ding and B. Z. Tang, Adv. Healthcare Mater., 2018, 7, 1800477 CrossRef.
- Z. He, C. Ke and B. Z. Tang, ACS Omega, 2018, 3, 3267–3277 CrossRef CAS.
- D. Wang, M. M. S. Lee, W. Xu, R. T. K. Kwok, J. W. Y. Lam and B. Z. Tang, Theranostics, 2018, 8, 4925 CrossRef CAS.
- C. Zhu, R. T. Kwok, J. W. Lam and B. Z. Tang, ACS Appl. Bio Mater., 2018, 1, 1768–1786 CrossRef CAS.
- S. Xie, A. Y. Wong, S. Chen and B. Z. Tang, Chem. – Eur. J., 2019, 25, 5824–5847 CrossRef CAS.
- M. M. Islam, Z. Hu, Q. Wang, C. Redshaw and X. Feng, Mater. Chem. Front., 2019, 3, 762–781 RSC.
- X. Wang, M. Xu, K. Huang, X. Lou and F. Xia, Chem. – Asian J., 2019, 14, 689–699 CrossRef CAS.
- J. Qian and B. Z. Tang, Chem, 2017, 3, 56–91 CAS.
- F. Hu, S. Xu and B. Liu, Adv. Mater., 2018, 30, 1801350 CrossRef.
- C. Chen, H. Ou, R. Liu and D. Ding, Adv. Mater., 2019, 1806331 CrossRef.
- H. Gao, X. Zhang, C. Chen, K. Li and D. Ding, Adv. Biosyst., 2018, 2, 1800074 CrossRef.
- S. Liu, Y. Cheng, H. Zhang, Z. Qiu, R. T. Kwok, J. W. Lam and B. Z. Tang, Angew. Chem., Int. Ed., 2018, 57, 6274–6278 CrossRef CAS.
- Z. He, P. Liu, S. Zhang, J. Yan, M. Wang, Z. Cai, J. Wang and Y. Dong, Angew. Chem., Int. Ed., 2019, 58, 3834–3837 CrossRef CAS.
- Z. Wang, K. Ma, B. Xu, X. Li and W. Tian, Sci. China: Chem., 2013, 56, 1234–1238 CrossRef CAS.
- N. B. Shustova, B. D. McCarthy and M. Dincă, J. Am. Chem. Soc., 2011, 133, 20126–20129 CrossRef CAS.
- S. Gui, Y. Huang, F. Hu, Y. Jin, G. Zhang, L. Yan, D. Zhang and R. Zhao, Anal. Chem., 2015, 87, 1470–1474 CrossRef CAS.
- M. T. Gabr and F. Christopher Pigge, Mater. Chem. Front., 2017, 1, 1654–1661 RSC.
- Y. Yuan, C.-J. Zhang, R. T. K. Kwok, D. Mao, B. Z. Tang and B. Liu, Chem. Sci., 2017, 8, 2723–2728 RSC.
- T. Zhang, Y. Li, Z. Zheng, R. Ye, Y. Zhang, R. T. K. Kwok, J. W. Y. Lam and B. Z. Tang, J. Am. Chem. Soc., 2019, 141, 5612–5616 CrossRef CAS.
- F. Ciardelli, G. Ruggeri and A. Pucci, Chem. Soc. Rev., 2013, 42, 857–870 RSC.
- M. Chen, K. P. Ghiggino, A. W. H. Mau, E. Rizzardo, S. H. Thang and G. J. Wilson, Chem. Commun., 2002, 2276–2277, 10.1039/B206166J.
- S. Sasaki, G. P. C. Drummen and G.-I. Konishi, J. Mater. Chem. C, 2016, 4, 2731–2743 RSC.
- R. Hu, E. Lager, A. Aguilar-Aguilar, J. Liu, J. W. Y. Lam, H. H. Y. Sung, I. D. Williams, Y. Zhong, K. S. Wong, E. Peña-Cabrera and B. Z. Tang, J. Phys. Chem. C, 2009, 113, 15845–15853 CrossRef CAS.
- D. Liese and G. Haberhauer, Isr. J. Chem., 2018, 58, 813–826 CrossRef CAS.
- S. Liu, X. Zhou, H. Zhang, H. Ou, J. W. Y. Lam, Y. Liu, L. Shi, D. Ding and B. Z. Tang, J. Am. Chem. Soc., 2019, 141, 5359–5368 CrossRef CAS.
- Z. R. Grabowski, K. Rotkiewicz and W. Rettig, Chem. Rev., 2003, 103, 3899–4032 CrossRef.
- M. Borelli, G. Iasilli, P. Minei and A. Pucci, Molecules, 2017, 22, 1306 CrossRef.
- Z. Qiu, X. Liu, J. W. Y. Lam and B. Z. Tang, Macromol. Rapid Commun., 2019, 40, 1800568 CrossRef.
- K. Li, Y. Lin and C. Lu, Chem. – Asian J., 2019, 14, 715–729 CrossRef CAS.
- Y. B. Hu, J. W. Y. Lam and B. Z. Tang, Chin. J. Polym. Sci., 2019, 37, 289–301 CrossRef CAS.
- A. Gershenson and L. M. Gierasch, Curr. Opin. Struct. Biol., 2011, 21, 32–41 CrossRef CAS.
- Y. Hong, C. Feng, Y. Yu, J. Liu, J. W. Y. Lam, K. Q. Luo and B. Z. Tang, Anal. Chem., 2010, 82, 7035–7043 CrossRef CAS.
- M. Z. Chen, N. S. Moily, J. L. Bridgford, R. J. Wood, M. Radwan, T. A. Smith, Z. Song, B. Z. Tang, L. Tilley and X. Xu, Nat. Commun., 2017, 8, 474 CrossRef.
- I. Moreno-Gonzalez and C. Soto, Semin. Cell Dev. Biol., 2011, 22, 482–487 CrossRef CAS.
- J. Bieschke, M. Herbst, T. Wiglenda, R. P. Friedrich, A. Boeddrich, F. Schiele, D. Kleckers, J. M. L. del Amo, B. A. Grüning and Q. Wang, Nat. Chem. Biol., 2012, 8, 93 CrossRef CAS.
- M. J. Wang, S. Yi, J.-Y. Han, S. Y. Park, J.-W. Jang, I. K. Chun, S. E. Kim, B. S. Lee, G. J. Kim and J. S. Yu, Alzheimer's Res. Ther., 2017, 9, 98 CrossRef.
- C. W. T. Leung, F. Guo, Y. Hong, E. Zhao, R. T. K. Kwok, N. L. C. Leung, S. Chen, N. N. Vaikath, O. M. El-Agnaf and Y. Tang, Chem. Commun., 2015, 51, 1866–1869 RSC.
- M. Kumar, Y. Hong, D. C. Thorn, H. Ecroyd and J. A. Carver, Anal. Chem., 2017, 89, 9322–9329 CrossRef CAS.
- Y. Hong, L. Meng, S. Chen, C. W. T. Leung, L.-T. Da, M. Faisal, D.-A. Silva, J. Liu, J. W. Y. Lam and X. Huang, J. Am. Chem. Soc., 2012, 134, 1680–1689 CrossRef CAS.
-
W.-T. Chu and Q.-C. Zheng, Adv. Protein Chem. Struct. Biol., Elsevier, 2013, vol. 92, pp. 179–217 Search PubMed.
- J. Li, W. Y. Lee, T. Wu, C. W. Leung, J. Xu, D. S. Wong, R. Li, G. Li, B. Z. Tang and L. Bian, Adv. Biosyst., 2018, 2, 1800010 CrossRef.
- H. Shi, R. T. Kwok, J. Liu, B. Xing, B. Z. Tang and B. Liu, J. Am. Chem. Soc., 2012, 134, 17972–17981 CrossRef CAS.
- Z. Zhang, R. T. Kwok, Y. Yu, B. Z. Tang and K. M. Ng, ACS Appl. Mater. Interfaces, 2017, 9, 38153–38158 CrossRef CAS.
- Y. Zhao, Y. Chris, R. T. Kwok, Y. Chen, S. Chen, J. W. Lam and B. Z. Tang, J. Mater. Chem. B, 2015, 3, 4993–4996 RSC.
- Y. Li, R. T. Kwok, B. Z. Tang and B. Liu, RSC Adv., 2013, 3, 10135–10138 RSC.
- R. Zhang, R. T. Kwok, B. Z. Tang and B. Liu, RSC Adv., 2015, 5, 28332–28337 RSC.
- X. C. Chen, S. B. Chen, J. Dai, J. H. Yuan, T. M. Ou, Z. S. Huang and J. H. Tan, Angew. Chem., 2018, 130, 4792–4796 CrossRef.
- S. Zhang, H. Sun, L. Wang, Y. Liu, H. Chen, Q. Li, A. Guan, M. Liu and Y. Tang, Nucleic Acids Res., 2018, 46, 7522–7532 CrossRef CAS.
- Y. Hong, M. Häußler, J. W. Lam, Z. Li, K. K. Sin, Y. Dong, H. Tong, J. Liu, A. Qin and R. Renneberg, Chem. – Eur. J., 2008, 14, 6428–6437 CrossRef CAS.
- Y. Hong, S. Chen, C. W. T. Leung, J. W. Y. Lam and B. Z. Tang, Chem. – Asian J., 2013, 8, 1806–1812 CrossRef CAS.
- O. Okay, D. Kaya and O. Pekcan, Polymer, 1999, 40, 6179–6187 CrossRef CAS.
- Y. Liu, Z. Wang and X. Zhang, Chem. Soc. Rev., 2012, 41, 5922–5932 RSC.
- G. Yu, K. Jie and F. Huang, Chem. Rev., 2015, 115, 7240–7303 CrossRef CAS.
- P. Wei, X. Yan and F. Huang, Chem. Soc. Rev., 2015, 44, 815–832 RSC.
- H.-Q. Peng, X. Zheng, T. Han, R. T. K. Kwok, J. W. Y. Lam, X. Huang and B. Z. Tang, J. Am. Chem. Soc., 2017, 139, 10150–10156 CrossRef CAS.
- Q. Liu, Q. Xia, S. Wang, B. S. Li and B. Z. Tang, J. Mater. Chem. C, 2018, 6, 4807–4816 RSC.
- J. Li, Y. Li, C. Y. Chan, R. T. Kwok, H. Li, P. Zrazhevskiy, X. Gao, J. Z. Sun, A. Qin and B. Z. Tang, Angew. Chem., Int. Ed., 2014, 53, 13518–13522 CrossRef CAS.
- S. Jiang, T. Y. Huang, K. M. Wang, B. Z. Tang and Q. Yu, Molecules, 2016, 22, 54 CrossRef.
- S. Bao, Q. Wu, W. Qin, Q. Yu, J. Wang, G. Liang and B. Z. Tang, Polym. Chem., 2015, 6, 3537–3542 RSC.
- Z. Qiu, E. K. K. Chu, M. Jiang, C. Gui, N. Xie, W. Qin, P. Alam, R. T. K. Kwok, J. W. Y. Lam and B. Z. Tang, Macromolecules, 2017, 50, 7620–7627 CrossRef CAS.
- A. G. Shtukenberg, Y. O. Punin, E. Gunn and B. Kahr, Chem. Rev., 2011, 112, 1805–1838 CrossRef.
- G. D. Liang, L. T. Weng, J. W. Y. Lam, W. Qin and B. Tang, ACS Macro Lett., 2014, 3, 21–25 CrossRef CAS.
- Y. Cheng, S. Liu, F. Song, M. Khorloo, H. Zhang, R. T. K. Kwok, J. W. Y. Lam, Z. He and B. Z. Tang, Mater. Horiz., 2019, 6, 405–411 RSC.
- J. Roose, A. C. S. Leung, J. Wang, Q. Peng, H. H. Y. Sung, I. D. Williams and B. Z. Tang, Chem. Sci., 2016, 7, 6106–6114 RSC.
- T. Han, C. Gui, J. W. Y. Lam, M. Jiang, N. Xie, R. T. K. Kwok and B. Z. Tang, Macromolecules, 2017, 50, 5807–5815 CrossRef CAS.
- Z. H. Song, X. L. Lv, L. C. Gao and L. Jiang, J. Mater. Chem. C, 2018, 6, 171–177 RSC.
- Y. Cheng, J. Wang, Z. Qiu, X. Zheng, N. L. C. Leung, J. W. Y. Lam and B. Z. Tang, Adv. Mater., 2017, 29, 1703900 CrossRef.
- T. Li, S. He, J. Qu, H. Wu, S. Wu, Z. Zhao, A. Qin, R. Hu and B. Z. Tang, J. Mater. Chem. C, 2016, 4, 2964–2970 RSC.
- J. R. Xu, W. X. Ji, C. Li, Y. F. Lv, Z. J. Qiu, L. C. Gao, E. Q. Chen, J. W. Y. Lam, B. Z. Tang and L. Jiang, Adv. Opt. Mater., 2018, 6, 1701149 CrossRef.
- D. Ding, R. T. Kwok, Y. Yuan, G. Feng, B. Z. Tang and B. Liu, Mater. Horiz., 2015, 2, 100–105 RSC.
- Y. Wu, J. Hu, H. Huang, J. Li, Y. Zhu, B. Tang, J. Han and L. Li, J. Polym. Sci., Part B: Polym. Phys., 2014, 52, 104–110 CrossRef CAS.
- J. Chen, J. Zhao, B. Xu, Z. Yang, S. Liu, J. Xu, Y. Zhang, Y. Wu, P. Lv and Z. Chi, Chin. J. Polym. Sci., 2017, 35, 282–292 CrossRef CAS.
- T. Han, H. Deng, Z. Qiu, Z. Zhao, H. Zhang, H. Zou, N. L. Leung, G. Shan, M. R. Elsegood and J. W. Lam, J. Am. Chem. Soc., 2018, 140, 5588–5598 CrossRef CAS.
- M. J. Robb, W. Li, R. C. R. Gergely, C. C. Matthews, S. R. White, N. R. Sottos and J. S. Moore, ACS Cent. Sci., 2016, 2, 598–603 CrossRef CAS.
- S. Liu, H. Zhang, Y. Li, J. Liu, L. Du, M. Chen, R. T. K. Kwok, J. W. Y. Lam, D. L. Phillips and B. Z. Tang, Angew. Chem., Int. Ed., 2018, 57, 15189–15193 CrossRef CAS.
- B. Zhang, J. L. Banal, D. J. Jones, B. Z. Tang, K. P. Ghiggino and W. W. H. Wong, Mater. Chem. Front., 2018, 2, 615–619 RSC.
- T. A. Geervliet, I. Gavrila, G. Iasilli, F. Picchioni and A. Pucci, Chem. – Asian J., 2019, 14, 877–883 CrossRef CAS.
- F. De Nisi, R. Francischello, A. Battisti, A. Panniello, E. Fanizza, M. Striccoli, X. Gu, N. L. C. Leung, B. Z. Tang and A. Pucci, Mater. Chem. Front., 2017, 1, 1406–1412 RSC.
- J. L. Banal, B. Zhang, D. J. Jones, K. P. Ghiggino and W. W. H. Wong, Acc. Chem. Res., 2017, 50, 49–57 CrossRef CAS.
- A. Pucci, Isr. J. Chem., 2018, 58, 837–844 CrossRef CAS.
Footnote |
| † These authors contributed equally. |
|
| This journal is © the Partner Organisations 2019 |
Click here to see how this site uses Cookies. View our privacy policy here. 
 a,
Haoke
Zhang
a,
Haoke
Zhang