
Stable supramolecular porphyrin@albumin nanoparticles for optimal photothermal activity†
Xiaohua
Zheng
ab,
Lei
Wang
 a,
Zhitao
Lei
c,
Qing
Pei
ab,
Shi
Liu
a and
Zhigang
Xie
*ab
a,
Zhitao
Lei
c,
Qing
Pei
ab,
Shi
Liu
a and
Zhigang
Xie
*ab
aState Key Laboratory of Polymer Physics and Chemistry, Changchun Institute of Applied Chemistry, Chinese Academy of Sciences, 5625 Renmin Street, Changchun, Jilin 130022, P. R. China. E-mail: xiez@ciac.ac.cn; Fax: +86 431 85262775; Tel: +86 431 85262775
bUniversity of Science and Technology of China, Hefei 230026, P. R. China
cCollege of Environmental and Chemical Engineering, Yanshan University, 438 Hebei Avenue, Qinhuangdao, Hebei 066004, P. R. China
First published on 22nd July 2019
Abstract
Porphyrins and their derivatives have been widely exerted as potential phototherapeutic nanomaterials in biomedical fields because of their favorable biocompatibility as well as easy chemical modification. However, the intrinsic hydrophobic properties still limit their further clinical translation. Albumin has been developed as a promising carrier for chemotherapeutic and protein drugs. Except for enhanced water solubility, using human serum albumin (HSA) endows efficient cellular internalization, prolonged blood circulation time, intensive tissue penetration depth and favorable pharmacokinetics and biodistribution. Herein, we constructed supramolecular nanoparticles (HSA–porphyrin SNPs) by the rational assembly of hexadecyl chain bonded porphyrin with HSA in a 1![[thin space (1/6-em)]](https://www.rsc.org/images/entities/char_2009.gif) :1 stoichiometry via a tight non-covalent interaction. The as-prepared SNPs exhibited robust photostability, a high photothermal conversion efficiency of 45% and recycled utilization. The SNPs can be endocytosed effectively, thus eliciting superb cancer cell inhibition in vitro and thermal ablation of tumors in vivo under illumination. We believe that this study can offer a new horizon to understand the interaction of small molecules with HSA, which highlights the opportunity to explore the next-generation HSA-binding nanomedicine for future cancer precision therapy.
:1 stoichiometry via a tight non-covalent interaction. The as-prepared SNPs exhibited robust photostability, a high photothermal conversion efficiency of 45% and recycled utilization. The SNPs can be endocytosed effectively, thus eliciting superb cancer cell inhibition in vitro and thermal ablation of tumors in vivo under illumination. We believe that this study can offer a new horizon to understand the interaction of small molecules with HSA, which highlights the opportunity to explore the next-generation HSA-binding nanomedicine for future cancer precision therapy.
Introduction
Compared to conventional cancer treatments, such as surgery, chemotherapy, and radiotherapy, photothermal therapy (PTT) has unparalleled merits due to the facile controllability, repeatability without cumulative toxicity and negligible invasiveness.1,2 PTT modality employs biocompatible photoactive agents to convert the absorbed photon to hyperthermia, thus inducing cancer cell death in vitro or tumor growth inhibition in vivo.3–10 With the rapid advances in nanotechnology engineering, the exploitation of ideal photothermal agents for biomedical applications has attracted researchers’ attention.11–17 Hitherto, various potential photothermal nanomaterials, such as graphene oxide-based carbon materials,18,19 transition and noble metal materials (WS, AgBiS2 and Bi nanodots, MoS2 nanosheets, Au),20–22 and BODIPY,23 DPP24–26 and isoindigo27-based semiconductor polymer nanocomposites, have been reported. Indeed, these tactics have achieved marked advances; however, several undesirable disadvantages remain. One is that the potential long-term systematic toxicity and poor biodegradability remain limitations for their further clinic translation. In addition, the extreme synthetic conditions, complex purification procedures and inferior solubility increase the difficulty for their availability, flexibility and adaptability in bioapplications. Hence, the rational design of smart and facile photoactive nanodrugs is urgently desired.As an excellent alternative to photoactive materials, some porphyrin derivatives have been approved as nanodrugs in the clinic for adjuvant treatment.28 The porphyrin and their derivatives are used to act as photosensitizers (PSs) for photodynamic therapy;29–37 however, the therapeutic effects are always down-regulated by the hypoxic property of the solid tumor.38,39 By contrast, porphyrin-based photothermal therapy exhibits the obvious advantage of oxygen-independence, thereby facilitating the improvement of the anticancer efficacy.40 Recently, porphyrins have been reported as photoactive agents for PTT due to the strong aggregation tendency induced by their π-conjugated electronic structures.41 For example, Zheng et al. found that porphyrin bilayer-based nanovesicles exhibit a dose-dependent photothermal response.42 Likewise, Yan et al. developed photothermal nanodots based on self-assembly of peptide–porphyrin conjugates for satisfactory photothermal tumor suppression.43 Our group also rationally designed porphyrin and chlorin dimers for photoacoustic imaging-guided phototherapy.44 However, all these photoactive nanomaterials cannot simultaneously satisfy the clinically-necessary properties, such as ease of synthesis, good photostability, solubility, and long-term blood circulation. Therefore, it still remains challenging to design and create porphyrin-based robust agents as therapeutic nanomedicines for successful clinical translation.
A strategy usually overlooked is the biological nanomaterials through co-assembly involving multiple, interplay biomaterials and interactions.45 For instance, it is well-known that co-assembly of human serum albumin (HSA) with drugs is an effective approach for enhancing the therapeutic effect because of the long circulation time by escaping from the reticular epithelial system protected by the endogenous protein metabolism mediator in vivo.46,47 As a quite abundant endogenous protein in human serum, HSA coated drugs possess a variety of advantages, including low immunotoxicity, long circulation time in blood and high tumor accumulation. Of note, paclitaxel-loaded albumin nanoparticles have been approved into clinic application, which could obviously increase the chemotherapy effect of paclitaxel and improve the quality of life of the patients.48,49 Lately, Lippard and co-workers designed a series of alkane chain bonded platinum(IV) prodrugs specifically incorporated into HSA through non-covalent interactions.50 The obtained complex showed the best chemotherapeutic profiles against three kinds of cancer cell lines. To study the universality between C16-bonding molecules with HSA, we systematically investigated the effect of the alkane chain length of porphyrin derivatives on cell uptake, blood circulation profile, and photothermal activity.
In this paper, we rationally designed an albumin-binding nanoparticle formulation by the assembly of photoactive porphyrin with HSA as photothermal nanomaterials (TPP-Cn@HSA SNPs). To acquire the optimal binding effect, a series of alkanes with different chain length decorated porphyrins were prepared in advance. After verification, we found that a hexadecyl chain bonded porphyrin exhibited the tightest interaction with HSA. The as-obtained porphyrin molecules could form stable supramolecular nanoparticles with HSA in a 1:1 stoichiometry (Scheme 1A). Strong π–π aromatic stacking interactions between the porphyrin in the SNPs absolutely quenched the fluorescence emission and reduced the reactive oxygen species generation by intersystem crossing (ISC) inhibition, thus generating a remarkable light-to-heat conversion effect (Scheme 1B). Notably, the HSA-binding SNPs exhibit excellent colloidal stability under various physiological conditions. In particular, as photothermal agents, the SNPs present favorable biocompatibility without laser irradiation and striking PTT tumor ablation activity under light illumination (Scheme 1C).
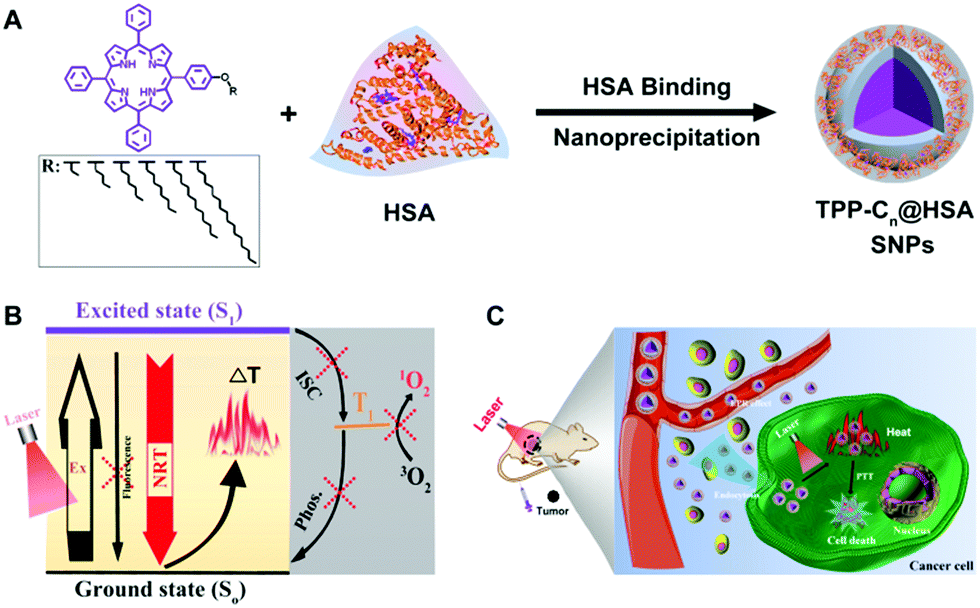 | ||
| Scheme 1 (A) Assembly of the porphyrins and HSA into supramolecular NPs (TPP-Cn@HSA SNPs). (B) Photophysical mechanism of the SNPs for photothermal conversion under light illumination. (Ex: excited, NRT: non-radiative transition, ISC: intersystem crossing, Phos.: phosphorescence). (C) Endocytosis of SNPs and subsequent PTT in vitro and in vivo. | ||
Materials and methods
Materials
Pyrrole was purchased from Sigma-Aldrich Co., Ltd (St. Louis, MO, USA). Deuterated chloroform (CDCl3) was purchased from Cambridge Isotope Laboratories Inc. Benzaldehyde and p-hydroxy benzaldehyde were purchased from damas-beta Co., Ltd MTT (3-[4,5-dimethylthiazol-2-yl]-2,5-diphenyltetrazoliumbromide) was purchased from Beyotime Biotechnology Co., Ltd (China). Ultrapure water was obtained from a Milli-Q system (Millipore, USA). The Live–Dead Cell Staining Kit was purchased from Nanjing KeyGen Biotech Co., Ltd. The Trypsin–EDTA (Phenol Red) was purchased from Dalian Meilun Biotechnology Co., Ltd. All the other chemical solvents are commercially available from Beijing Chemical Works without further purification.Preparation of TPP-C16@HSA SNPs
The TPP-C16@HSA SNPs were prepared using a nanoprecipitation method with the weight ratio of HSA and TPP at 1:1. Firstly, 3 mg of TPP was dissolved into 6 mL of acetone and then added to ultra-pure water (15 mL) containing 3 mg of HSA under constant stirring. After 24 h, the desired SNPs could be obtained. Other SNPs were prepared by the same method.
Photothermal evaluations of TPP-Cn@HSA SNPs
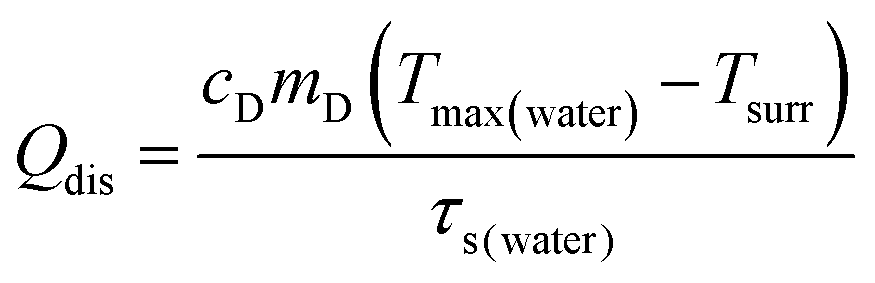
The solutions of TPP-Cn@HSA SNPs were irradiated with a laser with a wavelength of 638 nm for 5 min. Then the illumination was turned off and the solutions cooled to room temperature. The cooling processes were employed to calculate the photothermal conversion efficiencies of the SNP solutions. The temperature changes were recorded every 10 s by a thermocouple probe. Then, the photothermal conversion efficiencies of the SNPs were calculated in light of a reported equation: | (1) |
 | (2) |
 | (3) |
Here, Tmax(water) is the highest temperature of the water after light illumination and Tsurr is the temporal room temperature. τs(water) is 185.02 obtained from the collected data. According to the obtained data and eqn (1), the photothermal conversion efficiency of the SNPs could be calculated.
Cell culture
L929, U14, Human liver hepatocellular carcinoma (HepG2) and cervical carcinoma (HeLa) cells were incubated in Petri dishes with media containing Dulbecco's modified Eagle's medium (DMEM) and 10% fetal bovine serum (FBS).Cellular uptake
The CLSM method was used to detect the cellular endocytosis of SNPs by HeLa cells. Firstly, HeLa cells were incubated in 6-well plates for 24 h. Then, the culture media was removed and the SNPs were added at a concentration of 30 μg mL−1 in each well. After the cells were incubated at 37 °C for 0.5, 4 and 6 h, respectively, the culture media was removed and washed three times with PBS. After that, the cells were fixed with 1 mL of formaldehyde (4%) at r.t. for 10 min then washed twice with PBS. Hochest was used to stain the nuclei. Samples were examined by CLSM (Zeiss LSM 700, Zurich, Switzerland).Photothermal therapy in vitro
To evaluate the photothermal therapy in vitro, HeLa cells are cultured in 96-well plates for 24 h. Then different concentrations of SNPs were added and further incubated for 6 h. The laser with a wavelength of 638 nm (0.9 W cm−2, 5 min) was employed to irradiate the cells. After another 24 h, 20 μL of MTT (5 mg mL−1) was added and continued to be incubated for 4 h. Then, 150 μL of DMSO was added to each well to dissolve the formazan crystals formed. Finally, the plates were shaken for 5 min and the absorbance of formazan at 490 nm was measured by a microplate reader.Live–dead cell staining assay
Firstly, the cells were cultured in a 96-well plate and incubated for 24 h. After the same treatment as above-mentioned, the cells were stained with calcein–AM/propidium iodide (PI) for 30 min. Then, the live/dead cells were imaged by fluorescence microscopy.In vivo pharmacokinetic profiles
The in vivo pharmacokinetic profiles of TPP-C16@HSA SNPs were investigated in comparison with TPP-C16. Mice were randomly divided into two groups (n = 5). The two groups were injected with 300 μL of TPP-C16@HSA SNPs (0.83 mg mL−1) and TPP-C16 through the tail vein, respectively. At various time intervals (10 min, 0.5 h, 1 h, 2 h, 4 h, 8 h, 12 h, 24 h, and 48 h after the injection), blood samples were collected by centrifugation. Chloroform was used to extract the TPP-C16 compound. The obtained TPP-C16 containing chloroform solutions were volatilized in a chemical hood. Then, the obtained products were dissolved by acetonitrile and further analyzed by a C18 reverse phase column (high-performance liquid chromatography, methanol:acetonitrile = 1:1 as the moving phase) to determine the concentration of TPP-C16.
In vivo tumor inhibition experiment
All the animal tests have been approved by the local ethics committee and implemented according to the guidelines of Chinese law concerning the protection of animal life. The female Kunming mice were acquired from the hospital of Jilin University. U14 tumor cells were subcutaneously inoculated into the lateral aspect of the anterior right limb of the mice (2 × 10⁶ cells in 0.1 mL of PBS). After a week, the tumor bearing-mice were randomly divided into seven groups (control, Laser, TPP-C16, TPP-C16@HSA, TPP-C16 + L, TPP-C8@HSA + L, TPP-C16@HSA + L). For each mouse, the administration concentration of the TPP-Cn@HSA SNPs is 3.2 mg kg−1 in PBS via the tail vein. After 12 h, a laser with a wavelength of 638 nm was employed (0.9 W cm−2, 10 min) to irradiate the tumor regions of the mice. Over the next 14 days, the size of the tumors and the weight of the mice were carefully monitored. Then, the mice were sacrificed and the heart, liver, spleen, lungs, kidneys, and tumors were collected.Results and discussion
Design, fabrication and characterization of TPP-Cn and SNPs
The porphyrins bearing straight-chain alkanes with alkyl carbon numbers from 2, 4, 6, 8, 12 to 16 were synthesized from 5-(4-hydroxyphenyl)-10,15,20-triphenylporphyrin (TPP-OH),35 and named as TPP-C2, TPP-C4, TPP-C6, TPP-C8, TPP-C12 and TPP-C16, respectively (Fig. S1, ESI†). The accurate structures were well characterized by 1H NMR spectra and MALDI-TOF mass spectrometry (Fig. S2–S7, ESI†). SNPs of these porphyrins and HSA were prepared by a nano-precipitation method. As a control, the TPP-C16 NPs were prepared without HSA as shown in Fig. S8A and B (ESI†). The morphology and size distribution of the SNPs were characterized by transmission electron microscope (TEM) and dynamic light scattering (DLS). The average hydrodynamic diameters of the SNPs with the mass ratio of TPP-C16/HSA ranging from 1:0.5 to 1:3 were monitored by DLS. The formed TPP-C16@HSA SNPs with a mass ratio of 1:1 possess the smallest size and the narrowest size distribution (Fig. S8C, ESI†). For comparison, the other SNPs (TPP-C2@HSA, TPP-C4@HSA, TPP-C6@HSA, TPP-C8@HSA, TPP-C12@HSA) were prepared with the same mass ratio. As shown in Fig. 1A, the TEM image showed that the TPP-C16@HSA SNPs had a regular spherical shape with the mean diameter of about 150 nm, while that of TPP-C16 NPs was about 140 nm. The zeta potential of the TPP-C16@HSA SNPs is −30.03 ± 1.16 mV and the negatively charged surface could contribute to stabilizing their dispersion in physiological solutions via electrostatic repulsion and reduce protein adsorption in the blood circulation. Moreover, the zeta potentials of the TPP-C16@HSA SNPs changed from −30.08 mV to −28.87 mV in two weeks and the slight fluctuation suggested the colloidal stability of the SNPs in water (Fig. 1B). The corresponding size, size distributions and zeta potentials of all the TPP-Cn@HSA SNPs are summarized in Table S1 (ESI†). The DLS change profiles of the TPP-C16@HSA SNPs in water and phosphate-buffered saline (PBS, pH 7.4) and water containing 10% fetal bovine serum (FBS) were collected in Fig. S9 (ESI†). All these results show that TPP-C16@HSA SNPs have robust stability in a physiological environment, beneficial for their subsequent biomedical application. In Fig. 1C, TPP-C16 and TPP-C16@HSA SNPs showed similar absorption spectra and the slightly widened peak is ascribed to the assembly effect. As shown in Fig. 1D, the fluorescence emission peak of TPP-C16 was at 659 nm; however, almost no fluorescence could be detected for TPP-C16@HSA SNPs because of self-quenching induced by aggregation.
 | ||
| Fig. 1 (A) Size distribution and TEM image of TPP-C16@HSA SNPs. (B) Zeta potential of TPP-C16@HSA SNPs and after storage for two weeks. (C) UV-Vis spectra of TPP-C16 in THF and TPP-C16@HSA SNPs in aqueous solution (THF/H2O = 9:1 (v/v)). (D) The fluorescence spectra of TPP-C16 NPs in THF and TPP-C16@HSA SNPs in water. (E) The infrared spectra of HSA, TPP-C16, and TPP-C16@HSA. (F) Powder X-ray diffraction patterns of HSA, TPP-C16, and TPP-C16@HSA. | ||
To further verify the binding mode of TPP-C16 with HSA, 2D NOESY spectra are obtained as illustrated in Fig. S10A and B (ESI†). In contrast to the peaks of HSA, obvious reciprocal effect peaks can be found after the combination of HSA and TPP-C16. Moreover, as shown in Fig. 1E, the presence of the characteristic peaks of HSA and TPP-C16 in the infrared spectrum of TPP-C16@HSA suggests the successful binding between HSA and TPP-C16. Furthermore, only HSA peaks appear in the powder X-ray diffraction pattern of TPP-C16@HSA (Fig. 1F), indicating that TPP-C16 is wrapped in HSA. All of these results validated the successful formation of supramolecular nanoparticles between HSA and TPP-C16 molecules.
Photothermal effect and photostability of TPP-Cn@HSA SNPs
The photothermal conversion efficiency (PCE) of TPP-Cn@HSA SNPs was systematically studied. Photothermal heating curves of TPP-Cn@HSA SNPs (n = 2, 4, 6, 8, 12 and 16) in water were measured upon 638 nm laser irradiation for 5 min (Fig. 2A). Interestingly, TPP-C16@HSA SNPs possessed the best temperature elevation and the highest PCE among all the TPP-Cn@HSA SNPs (Fig. 2A and Fig. S11, ESI†). Fig. 2B reveals the concentration-dependence of the photothermal effect of the SNPs. As shown in Fig. 2C, with increasing laser power intensity, a better temperature rising effect of the solution (120 μg mL−1) could be found. | ||
| Fig. 2 (A) Photothermal heating curves of water and TPP-Cn@HSA SNPs (n = 2, 4, 6, 8, 12 and 16) in solution upon laser irradiation. (B) Photothermal profiles of TPP-C16@HSA SNPs with different concentrations under laser irradiation (1 W cm−2). (C) Photothermal profiles of TPP-C16@HSA SNPs under irradiation of different power density. (D) The photothermal effect of the TPP-C16@HSA dispersions under laser irradiation (1 W cm−2), which was turned off after irradiation for 300 s. (E) Plot of cooling time versus the negative natural logarithm of the temperature driving force obtained from the cooling stage. (F) Temperature changes of TPP-C16@HSA SNPs under five heating/cooling cycles. The wavelength of the laser source is 638 nm. | ||
When the laser power was 1 W cm−2, the temperature of the solution reached 50 °C in 100 s, and then the temperature slowly increased to 62.3 °C, which could effectively ablate tumor cells. The laser was then switched off and the temperature finally dropped to room temperature after about 600 s (Fig. 2D). Fig. 2E illustrates the plot of cooling time versus the negative natural logarithm of temperature variation driving force acquired from the cooling process. The photothermal conversion efficiency of TPP-C16@HSA SNPs was calculated to be 45%, which is much higher than many other photothermal agents reported.14,21,23,51 Amazingly, even after five heating and cooling cycles, the TPP-C16@HSA SNPs could still reach the same light–heat conversion level, which demonstrated that TPP-C16@HSA SNPs possessed extraordinary photostability. The high photothermal efficiency and good photothermal stability of the TPP-C16@HSA SNPs make them hopeful and competitive as a PTT agent.
Cellular uptake of TPP-C16@HSA SNPs
As an efficient therapeutic agent, cellular entry is indispensable. Thus, the cell internalization properties of the TPP-C16@HSA SNPs were evaluated by using confocal laser scanning microscopy (CLSM) and flow cytometry methods in HeLa cells. To visualize the cell locations, the nuclei were labeled with Hoechst. As shown in Fig. 3A, time-dependent enhanced fluorescence within the cytoplasm can be observed with the incubation time from 0.5 h, to 4 h to 6 h, validating that the SNPs could productively enter the cells. Furthermore, the endocytosis property was also assessed by calculating the relative arithmetic mean fluorescence intensity (Fig. 3B). Similarly, the results indicated time-dependent enhanced intensity changes, indicating the remarkable cell endocytosis efficiency. Notably, after recombination with HSA, the endocytosis rate of the photoactive agent (TPP-C16) was increased, revealing the enhancement effect of HSA to cellular uptake ability (Fig. 3C). These results suggested that the HSA can act as an effective carrier for photoactive drug therapeutic delivery. | ||
| Fig. 3 (A) Endocytosis images of TPP-C16@HSA SNPs from 0.5, to 4 to 6 h in HeLa cells by the CLSM method. Scale bars: 20 μm. (B) Relative arithmetic mean fluorescence intensity (RAMFI) of HeLa cells treated with TPP-C16@HSA SNPs calculated by ZEN 2011 software. (C) Cellular uptake of TPP-C16 NPs and TPP-C16@HSA SNPs analyzed by a flow cytometry method. | ||
In vitro phototherapy efficacy of the TPP-Cn@HSA SNPs
To evaluate the biocompatibility and PTT effect of TPP-C16@HSA SNPs, the cell viability of L929, HeLa, HepG2 and U14 cells were tested by MTT assays with or without irradiation (638 nm, 0.9 W cm−2, 5 min). As shown in Fig. 4A–D, all four cell lines maintained high cell viabilities without light illumination, suggesting the satisfactory biocompatibility of our SNPs. In sharp contrast, obviously enhanced cytotoxicities were observed with the increasing concentration of TPP-C16@HSA SNPs under light illumination. In addition, the good biocompatibility of the TPP-C16 NPs could also be detected (Fig. S12A–D, ESI†). Compared to TPP-C16 NPs, the TPP-C16@HSA SNPs exhibited better therapeutic effect with lower IC50 values to three cancer cell lines (HeLa, HepG2 and U14 cells, Fig. S12B–D and Table S2, ESI†), indicating the efficient carrier function of HSA. Moreover, all the TPP-Cn@HSA SNPs display favorable biocompatibility (Fig. S13A, ESI†), which is a prerequisite for photoactive agents before their clinical usage. With the increase of concentration, the cell viability was the least for TPP-C16@HSA SNPs upon irradiation. However, higher cell viability of cells could be found treated with other TPP-Cn@HSA SNPs (Fig. S13B, ESI†). Above results indicated that the PTT effect of the SNPs will be enhanced along with the extending of the alkyl chain, and TPP-C16@HSA SNPs showed the best anticancer efficacy. These results were consistent with the results in Fig. 2A and substantiated the superiority of TPP-C16@HSA SNPs as potential PTT agents. | ||
| Fig. 4 In vitro cytotoxicity of TPP-C16@HSA SNPs against (A) L929 cells without irradiation, (B) HeLa, (C) HepG2 and (D) U14 cells with or without laser irradiation (638 nm, 0.9 W cm−2, 5 min). (E) Live and dead staining images of HeLa cells treated with calcein–AM (green, live cells) and propidium iodide (red, dead cells) in different groups, including blank, only laser irradiation, TPP-C16@HSA SNPs, and TPP-C16@HSA SNPs plus irradiation (from left to right). Scale bars: 100 μm. | ||
Live/dead cell staining assay was employed to further confirm the phototherapy effect of TPP-C16@HSA SNPs upon laser irradiation. Herein, the dead cells would exhibit red fluorescence and be differentiated from the live cells (green). As shown in Fig. 4E, only intense green fluorescence was detected in three control groups (blank, only laser irradiation, TPP-C16@HSA SNPs without laser irradiation). However, when HeLa cells were treated with the combination of TPP-C16@HSA and laser irradiation, strong red fluorescence signals were observed in the staining image. These results confirmed the efficient phototoxicity of TPP-C16@HSA SNPs, beneficial for their biomedical applications.
Hemolysis and pharmacokinetics of TPP-C16@HSA SNPs
Inspired by the slight cytotoxicity tested in the in vitro experiment, the in vivo bio-safety of TPP-C16@HSA SNPs was evaluated by detecting the hemolytic activity. As shown in Fig. S14A (ESI†), almost no hemolysis of RBCs could be observed after SNP treatment by detecting the absorption of free hemoglobin52via a microplate reader even at a concentration up to 100 μg mL−1, validating the excellent compatibility of TPP-C16@HSA SNPs, thus enabling subsequent pharmacological applications.It is well known that the concentration of nano drugs would be diluted in the blood after intravenous administration and the disadvantageous effect could be amplified when the organs (e.g. liver, spleen and lung) assimilated the most NPs, resulting in a small number of NPs maintaining circulation in the blood. Therefore, the prolonged circulation time of prodrugs in the blood is indispensable for guaranteeing the therapeutic effect. To affirm the prolonged blood circulation time of NPs camouflaged by albumin, the blood clearance and biodistribution experiments of TPP-C16 NPs and TPP-C16@HSA SNPs were studied. As shown in Fig. S14B (ESI†), the detected concentration of TPP-C16 from TPP-C16@HSA SNPs was much higher than that from TPP-C16 NPs from the third time point. The area under the curve (AUC) of TPP-C16@HSA was about 1.76 times bigger than TPP-C16, verifying notable retardation in clearance from the blood, due to the auxiliary effect of HSA. Moreover, as shown in Fig. S14C (ESI†), the TPP-C16@HSA SNP delivered TPP-C16 amount to the tumor site was around 1.9-fold higher than TPP-C16 from TPP-C16 NPs at the twelfth hour, identifying the increased accumulation in the tumor over time, thereby contributing to the increased therapeutic efficiency.
In addition, the tissue distribution results exhibited that TPP-C16 mainly accumulated at the liver and spleen (Fig. S14C, ESI†), affected by the mononuclear phagocyte system. At 12 h post-injection, the concentrations of TPP-C16 reached the maximal value, indicating the appropriate irradiation time.
In vivo antitumor activity and biosafety of TPP-C16@HSA SNPs
To evaluate the heat generation ability of the as-prepared TPP-C16@HSA SNPs in living mice after intravenous administration, the temperature changes of tumors in different groups were imaged over time by a thermal imager upon laser irradiation. The TPP-C16 NPs and TPP-C8@HSA SNPs were selected as the control. Specifically, the photothermal anticancer efficacy in vivo was verified by using Kunming mice with U14 tumor xenografts. The mice were randomly divided into seven groups (four mice in each group): blank group; only laser irradiation (Laser); injection with TPP-C16@HSA SNPs (TPP-C16@HSA); injection with TPP-C16 NPs (TPP-C16); injection with TPP-C16@HSA SNPs and laser irradiation (TPP-C16@HSA + L); injection with TPP-C16 NPs and laser irradiation (TPP-C16 + L); injection with TPP-C8@HSA NPs and laser irradiation (TPP-C8@HSA + L). All the NPs were intravenously injected into mice. As shown in Fig. 5A and B, negligible temperature fluctuation (ΔT ≈ 2.7 °C) can be detected of the tumors in the “PBS + Laser irradiation” group. Notably, the tumors from three mice groups (TPP-C16 NPs + Laser, TPP-C8@HSA SNPs + Laser, TPP-C16@HSA SNPs + Laser) obviously show a temperature increase. In particular, the “TPP-C16@HSA SNPs + Laser” treated mice group exhibits the highest temperature elevation (ΔT ≈ 16.1 °C) with the supreme temperature of 49.2 °C, a temperature that could not only exert an efficient therapeutic effect but also would not burn the surrounding regions of the tumors. As shown in Fig. 5C, the tumor volumes of mice treated by PBS, Laser, TPP-C16@HSA and TPP-C16 increased rapidly, but TPP-C16 and TPP-C16@HSA + L treated mice indicated obvious inhibition of tumor growth. Although the tumors of mice treated with TPP-C16@HSA + L and TPP-C8@HSA + L gradually decreased, the tumors of mice in the TPP-C16@HSA + L group displayed the best treatment effect and basically disappeared. After 14 days, the mice were sacrificed. The tumor weight and photos are shown in Fig. 5D and E. The comparison of tumor size (Fig. 5D), tumor weight (Fig. 5E) and tumor growth inhibition rates (Fig. S14D, ESI†) revealed that TPP-C16@HSA SNPs plus laser irradiation achieved the best tumor therapeutic effect due to the longer blood circulation time and enhanced accumulation efficiency of delivered drugs at the tumor sites. Moreover, as shown in Fig. S14E (ESI†), negligible weight changes of mice were observed in all groups, suggesting the low systematic toxicity of TPP-C16@HSA SNPs. The notable in vivo therapeutic effect demonstrated the rational design of TPP-C16@HSA SNPs as photoactive agents in antitumor therapy. | ||
| Fig. 5 (A) Infrared thermal images of tumor-bearing mice treated with only laser, TPP-C16 NPs, TPP-C8@HSA SNPs, and TPP-C16@HSA SNPs plus irradiation, respectively. (B) Temperature changes of tumor locations upon irradiation monitored by an infrared thermal camera in different groups. (C) Relative tumor volumes, (D) tumor photographs, (E) tumor weight changes of mice treated with control, light illumination, TPP-C16, TPP-C16@HSA, TPP-C16 + L, TPP-C8@HSA + L, and TPP-C16@HSA + L. | ||
Histological analyses
To further identify the anticancer effect after therapy with multifarious formulations, the tumors and main organs (heart, liver, spleen, lungs and kidneys) were collected from the mice and stained with hematoxylin and eosin (H&E) for pathological analysis.As shown in Fig. S15A (ESI†), large cell nuclei with spindle or spherical morphology and more chromatin could be observed in the tumor tissues of the four control groups (including Blank, Laser, TPP-C16 without irradiation and TPP-C16@HSA without irradiation), revealing the rapid tumor growth state. In contrast, slight tissue necrosis, obvious cell nuclear shrinkage or fragmentation were observed in the three photothermal ablation-treated groups (TPP-C16 + Laser, TPP-C8@HSA + Laser and TPP-C16@HSA + Laser). Notably, the group of TPP-C16@HSA + Laser displayed the largest necrosis area, suggesting the best photothermal efficacy. In addition, the negligible changes of the main tissue slices (heart, liver, spleen, lungs, and kidneys) demonstrated the favorable histocompatibility of the designed SNPs (Fig. S15B, ESI†).
Conclusions
In conclusion, we designed and synthesized porphyrins with different alkyl chain lengths, and obtained a stable nanoparticle formulation in the presence of HSA. The formed TPP-C16@HSA SNPs indicate better photothermal activity and higher photothermal conversion efficiency (η = 45%) than porphyrin with other alkyl chains, which could be used as an ideal candidate agent for PTT in cancer treatment. In vivo, the albumin camouflage in TPP-C16@HSA resulted in an evident enhancement in blood circulation and improvement on inhibition of tumor growth. This albumin-biomimetic nanomaterial can be an inspiring tumor-targeted drug delivery strategy to enhance the treatment effect of cancer, and open new avenues for engineering ideal drug delivery systems with clinical potential.Conflicts of interest
There are no conflicts to declare.Acknowledgements
The project was supported by the National Natural Science Foundation of China (Project No. 51522307).Notes and references
- L. Cheng, C. Wang, L. Feng, K. Yang and Z. Liu, Chem. Rev., 2014, 114, 10869–10939 CrossRef CAS PubMed.
- G. Lan, K. Ni and W. Lin, Coord. Chem. Rev., 2019, 379, 65–81 CrossRef CAS PubMed.
- Y. Liu, P. Bhattarai, Z. Dai and X. Chen, Chem. Soc. Rev., 2019, 48, 2053–2108 RSC.
- Z. Yang and X. Chen, Acc. Chem. Res., 2019, 52, 1245–1254 CAS.
- X. Song, Q. Chen and Z. Liu, Nano Res., 2015, 8, 340–354 CrossRef CAS.
- C. Korupalli, C.-C. Huang, W.-C. Lin, W.-Y. Pan, P.-Y. Lin, W.-L. Wan, M.-J. Li, Y. Chang and H.-W. Sung, Biomaterials, 2017, 116, 1–9 CrossRef CAS PubMed.
- J.-J. Hu, M.-D. Liu, Y. Chen, F. Gao, S.-Y. Peng, B.-R. Xie, C.-X. Li, X. Zeng and X.-Z. Zhang, Biomaterials, 2019, 207, 76–88 CrossRef CAS PubMed.
- G. Wan, B. Chen, L. Li, D. Wang, S. Shi, T. Zhang, Y. Wang, L. Zhang and Y. Wang, Biomaterials, 2018, 187, 27 CrossRef CAS PubMed.
- Z. Liu, Q. Xu, Y. Li and W. Chen, Mater. Chem. Front., 2017, 1, 538–541 RSC.
- J. Shen, J. Chen, Z. Ke, D. Zou, L. Sun and J. Zou, Mater. Chem. Front., 2019, 3, 1123–1127 RSC.
- T. Sun, X. Chen, X. Wang, S. Liu, J. Liu and Z. Xie, Mater. Chem. Front., 2019, 3, 127–136 RSC.
- Y. Yang, W. Zhu, Z. Dong, Y. Chao, L. Xu, M. Chen and Z. Liu, Adv. Mater., 2017, 29, 1703588 CrossRef PubMed.
- Q. Wang, B. Xia, J. Xu, X. Niu, J. Cai, Q. Shen, W. Wang, W. Huang and Q. Fan, Mater. Chem. Front., 2019, 3, 650–655 RSC.
- X. Zheng, L. Wang, M. Liu, P. Lei, F. Liu and Z. Xie, Chem. Mater., 2018, 30, 6867–6876 CrossRef CAS.
- F. Hou, Y. Zhu, Q. Zou, C. Zhang, H. Wang, Y. Liao, Q. Wang, X. Yang and Y. Yang, Mater. Chem. Front., 2019 10.1039/C9QM00276F.
- S. Gao, G. Wei, S. Zhang, B. Zheng, J. Xu, G. Chen, M. Li, S. Song, W. Fu, Z. Xiao and W. Lu, Nat. Commun., 2019, 10, 2206 CrossRef PubMed.
- Y. Zhang, S. Zhou, K. C. Chong, S. Wang and B. Liu, Mater. Chem. Front., 2019, 3, 836–841 RSC.
- J. T. Robinson, S. M. Tabakman, Y. Liang, H. Wang, H. Sanchez Casalongue, D. Vinh and H. Dai, J. Am. Chem. Soc., 2011, 133, 6825–6831 CrossRef CAS PubMed.
- M. Yan, Y. Liu, X. Zhu, X. Wang, L. Liu, H. Sun, C. Wang, D. Kong and G. Ma, ACS Appl. Mater. Interfaces, 2019, 11, 1876–1885 CrossRef CAS PubMed.
- P. Lei, R. An, P. Zhang, S. Yao, S. Song, L. Dong, X. Xu, K. Du, J. Feng and H. Zhang, Adv. Funct. Mater., 2017, 27, 1702018 CrossRef.
- P. Lei, R. An, X. Zheng, P. Zhang, K. Du, M. Zhang, L. Dong, X. Gao, J. Feng and H. Zhang, Nanoscale, 2018, 10, 16765–16774 RSC.
- N. Yan, X. Wang, L. Lin, T. Song, P. Sun, H. Tian, H. Liang and X. Chen, Adv. Funct. Mater., 2018, 28, 1800490 CrossRef.
- W. Zhang, W. Lin, X. Wang, C. Li, S. Liu and Z. Xie, ACS Appl. Mater. Interfaces, 2019, 11, 278–287 CrossRef CAS PubMed.
- X. Zhen, C. Xie and K. Pu, Angew. Chem., Int. Ed., 2018, 57, 3938–3942 CrossRef CAS PubMed.
- X. Zhen, P. Cheng and K. Pu, Small, 2019, 15, 1804105 CrossRef PubMed.
- J. Li and K. Pu, Chem. Soc. Rev., 2019, 48, 38–71 RSC.
- Y. Jiang, X. Zheng, Y. Deng, H. Tian, J. Ding, Z. Xie, Y. Geng and F. Wang, Angew. Chem., Int. Ed., 2018, 57, 10283–10287 CrossRef CAS PubMed.
- B. M. Luby, C. D. Walsh and G. Zheng, Angew. Chem., Int. Ed., 2019, 58, 2558–2569 CrossRef CAS PubMed.
- J.-Y. Zeng, M.-K. Zhang, M.-Y. Peng, D. Gong and X.-Z. Zhang, Adv. Funct. Mater., 2018, 28, 1705451 CrossRef.
- S.-Y. Qin, A.-Q. Zhang, S.-X. Cheng, L. Rong and X.-Z. Zhang, Biomaterials, 2017, 112, 234–247 CrossRef CAS PubMed.
- J. F. Lovell, T. W. B. Liu, J. Chen and G. Zheng, Chem. Rev., 2010, 110, 2839–2857 CrossRef CAS PubMed.
- S. S. Lucky, K. C. Soo and Y. Zhang, Chem. Rev., 2015, 115, 1990–2042 CrossRef CAS PubMed.
- K. Liu, R. Xing, Q. Zou, G. Ma, H. Möhwald and X. Yan, Angew. Chem., Int. Ed., 2016, 55, 3036–3039 CrossRef CAS PubMed.
- X. Zheng, L. Wang, Q. Pei, S. He, S. Liu and Z. Xie, Chem. Mater., 2017, 29, 2374–2381 CrossRef CAS.
- X. Zheng, Z. Li, L. Chen, Z. Xie and X. Jing, Chem. – Asian J., 2016, 11, 1780–1784 CrossRef CAS PubMed.
- K. Lu, C. He and W. Lin, J. Am. Chem. Soc., 2014, 136, 16712–16715 CrossRef CAS PubMed.
- K. Lu, C. He and W. Lin, J. Am. Chem. Soc., 2015, 137, 7600–7603 CrossRef CAS PubMed.
- S. Gao, P. Zheng, Z. Li, X. Feng, W. Yan, S. Chen, W. Guo, D. Liu, X. Yang, S. Wang, X.-J. Liang and J. Zhang, Biomaterials, 2018, 178, 83–94 CrossRef CAS PubMed.
- Y. Liu, Y. Jiang, M. Zhang, Z. Tang, M. He and W. Bu, Acc. Chem. Res., 2018, 51, 2502–2511 CrossRef CAS PubMed.
- K. Wang, Z. Zhang, L. Lin, J. Chen, K. Hao, H. Tian and X. Chen, Chem. Mater., 2019, 31, 3313–3323 CrossRef CAS.
- M. Overchuk, M. Zheng, M. A. Rajora, D. M. Charron, J. Chen and G. Zheng, ACS Nano, 2019, 13, 4560–4571 CrossRef CAS PubMed.
- J. F. Lovell, C. S. Jin, E. Huynh, H. Jin, C. Kim, J. L. Rubinstein, W. C. W. Chan, W. Cao, L. V. Wang and G. Zheng, Nat. Mater., 2011, 10, 324 CrossRef CAS PubMed.
- Q. Zou, M. Abbas, L. Zhao, S. Li, G. Shen and X. Yan, J. Am. Chem. Soc., 2017, 139, 1921–1927 CrossRef CAS PubMed.
- X. Zheng, L. Wang, S. Liu, W. Zhang, F. Liu and Z. Xie, Adv. Funct. Mater., 2018, 28, 1706507 CrossRef.
- M. Abbas, Q. Zou, S. Li and X. Yan, Adv. Mater., 2017, 29, 1605021 CrossRef PubMed.
- J. Chen, L. Liu, S. M. Motevalli, X. Wu, X.-H. Yang, X. Li, L. Han, A. Magrini, W. Guo, J. Chang, M. Bottini and X.-J. Liang, Adv. Funct. Mater., 2018, 28, 1707291 CrossRef.
- W. Guo, J. Chen, L. Liu, A. S. Eltahan, N. Rosato, J. Yu, D. Wang, J. Chen, M. Bottini and X.-J. Liang, ACS Appl. Mater. Interfaces, 2018, 10, 41167–41177 CrossRef CAS PubMed.
- A. O. Elzoghby, W. M. Samy and N. A. Elgindy, J. Controlled Release, 2012, 157, 168–182 CrossRef CAS PubMed.
- Y. Zhang, Z. Guo, Z. Cao, W. Zhou, Y. Zhang, Q. Chen, Y. Lu, X. Chen, Q. Guo, C. Li, D. Liang, T. Sun and C. Jiang, Biomaterials, 2018, 183, 243–257 CrossRef CAS PubMed.
- Y.-R. Zheng, K. Suntharalingam, T. C. Johnstone, H. Yoo, W. Lin, J. G. Brooks and S. J. Lippard, J. Am. Chem. Soc., 2014, 136, 8790–8798 CrossRef CAS PubMed.
- D.-H. Zhao, J. Yang, R.-X. Xia, M.-H. Yao, R.-M. Jin, Y.-D. Zhao and B. Liu, Chem. Commun., 2018, 54, 527–530 RSC.
- M. Li, Z. Tang, S. Lv, W. Song, H. Hong, X. Jing, Y. Zhang and X. Chen, Biomaterials, 2014, 35, 3851–3864 CrossRef CAS PubMed.
Footnote |
| † Electronic supplementary information (ESI) available: Characterization, synthesis and additional figures. See DOI: 10.1039/c9qm00387h |
| This journal is © the Partner Organisations 2019 |