Ionic liquid crystals with aggregation-induced emission properties based on pyrrolo[3,2-b]pyrrole salt compounds†
Zhe
Peng
ab,
Shuangxiong
Dai
a,
Yingchun
Ji
a,
Bin
Tong
 *a,
Jianbing
Shi
 a,
Zhengxu
Cai
 a,
Junge
Zhi
 c and
Yuping
Dong
 *a
*a
aBeijing Key Laboratory of Construction Tailorable Advanced Functional Materials and Green Applications, College of Materials Science and Engineering, Beijing Institute of Technology, 5 South Zhongguancun Street, Beijing, 100081, China. E-mail: tongbin@bit.edu.cn; chdongyp@bit.edu.cn; Tel: +86-10-6891-7390
bState Key Laboratory of Advanced Fiber Composites, Beijing Composite Materials Co., Ltd, Beijing, 102101, China
cCollege of Science, Beijing Institute of Technology, Beijing 100081, China
First published on 30th April 2019
Abstract
The present work reports the synthesis, optical properties and mesomorphism of two viologen derivatives DPP-2Py-9 and DPP-2Py-5 of 4,4′-((2,5-diphenylpyrrolo[3,2-b]pyrrole-1,4-diyl)bis(4,1-phenylene))bis(1-pyridin-1-ium) 4-toluenesulfonate. Both DPP-2Py-5 and DPP-2Py-9 showed aggregation-induced emission (AIE) characteristics indicating that the phenyl pyrrolo[3,2-b]pyrrole core acts as an AIE unit in their salt compounds. DPP-2Py-5 did not show liquid crystalline properties due to the shorter alkoxy chains. DPP-2Py-9 was a liquid crystalline compound with smectic A mesophase, showing marble-like textures observed at 185 °C during the cooling process. DPP-2Py-9 exhibited different emission behaviors in different aggregation states controlled by the change of temperature. The PL intensity of DPP-2Py-9 gradually decreased and the wavelength showed a hypochromic shift as the temperature increased. The most obvious variation of the wavelength occurred in the liquid crystalline range. The liquid crystalline temperature range between 185 and 210 °C determined by the differential curve of PL wavelength vs. temperature was similar to that measured by the DSC technique. Therefore, PL emission spectroscopy could be used as a technical method to characterize the liquid crystalline behaviors.
Introduction
Aggregation-induced emission (AIE) materials usually exhibit highly emissive properties in the solid state (or aggregate state), which can be extensively applied in optoelectronics, chemical sensing, biological probes and stimuli response systems.1 The conventional liquid crystals (LCs) formed by highly organized molecular arrangements are usually quenched in the aggregate states. So they do not emit light directly and need an extra light source (a backlight) to display.2 The emergence of AIE provides insight into the efficient luminescent liquid crystalline (LC) materials.3Due to the combined AIE and LC characteristics (AIE–LC), luminescent LC materials have aroused interest in academic research and the commercial market because of their unique photoluminescence emissive properties determined by the molecular aggregation process in the solid state, which shows promising applications in organic light-emitting diodes,4 luminescent liquid-crystal displays,5 storing information,6 sensors,7 imaging systems,8 polarized organic lasers,9 organic semiconductors10 and so on. To date, some AIE–LC materials have been reported.11 The AIE units, mainly consisting of tetraphenylethene, hexaphenylsilole, and cyanostilbene groups, play an important role in AIE–LC compounds.
Ionic liquid crystals (ILCs) containing organic cations and organic/inorganic anions usually exhibit the characteristics of liquid crystals and ionic liquids. 4,4′-Bipyridinium salts (also called viologens) and their derivatives have attracted many researchers to study their redox-active, electrochromic, photochromic, and thermochromic properties.12 The optical properties of viologen derivatives can be changed by incorporating π-conjugated bridging groups between the two pyridinium units.13 From the research results of viologen derivatives, the simple structural groups between the two pyridinium units of the π-conjugated bridge can be for example benzene, anthracene and thiophene rings. However research incorporating AIE units as a π-conjugated bridge in viologens has not been reported, and also ionic liquid crystalline (ILC) materials with AIE are still not studied.
As is known to all, the emission behavior of luminophores is controlled by molecular stacking styles. The molecular stacking styles of LC molecules change clearly from an anisotropic solid state to a LC state and to an isotropic liquid state with the variation of temperature. ILC molecules possess a more complicated stacking arrangement because of the more complex interactions that exist such as ion–ion, π–π, electrostatic and hydrophobic interactions. So it is meaningful to study the emission behaviors of AIE–ILC molecules in different aggregation states and explore the effect of stacking arrangements on the emission properties.
Therefore, we synthesized two viologen derivatives based on aryl-substituted pyrrolo[3,2-b]pyrrole as AIE units (DPP-2Py-5 and DPP-2Py-9). Their mesomorphic and AIE properties were studied as a function of temperature and the length of alkyl chains. Moreover, we analyzed the temperature-dependent fluorescence emission of DPP-2Py-9 samples on heating. The experimental results indicated that PL emission spectroscopy can be used as a method to characterize the liquid crystalline behaviors, which means that the LC properties could be characterized on the view of fluorescence.
Experimental section
Materials
4-Pyridineboronic acid (Sukailu, 98%), 1-iodononane (Alfa Aesar, 98%), 1-iodopentane (Alfa Aesar, 98%) and silver p-toluene sulphonate (Energy Chemical, 97%) were purchased and used without further purification. Other chemicals were purchased from Beijing Chemical Reagent Company and J&K Scientific without further purification.Measurement and characterization
The nuclear magnetic resonance (NMR) spectra were measured on a Bruker AMX-400 (400 MHz) spectrometer using CDCl3 as the solvent with tetramethylsilane (TMS) as an internal standard for DPP-2Py, DMSO-d6 for DPP-2Py-5 and MeOD for DPP-2Py-9. Matrix-assisted laser desorption/ionization time-of-flight (MALDI-TOF) of DPP-2Py was performed by using α-cyano-4-hydroxy-cinnamic acid (CCA) as the matrix in the reflector mode for data acquisition. Electrospray ionization mass spectrometry of DPP-2Py-5 and DPP-2Py-9 was performed by using a SHIMADZU LCMS-2010 ESI-MS spectrometer. The UV-Vis spectra were recorded on a TU-1901 spectrophotometer (Beijing Purkinje General Instrument Co., Ltd). Photoluminescence (PL) spectra were collected on a Hitachi F-7000 fluorescence spectrophotometer. Temperature-dependent fluorescence emission spectra were collected on a NanoLOG-TCSPC spectrophotometer. Polarized optical microscopy (POM) photographs were examined by NIKON LV100N microscopy with a heating platform. Thermogravimetric analysis (TGA) and differential scanning calorimetry (DSC) were carried out on a PerkinElmer STA6000 Simultaneous Thermal Analyzer and TA Q2000 differential scanning calorimeter with a heating rate of 5 °C min−1 in a nitrogen atmosphere, respectively. XRD patterns were collected using a high-flux small-angle X-ray scattering instrument (SAXSess, Anton Paar TCS300) equipped with a Kratky block-collimation system. The crystallographic structures were analyzed with a Rigaku CCD Saturn 724+ X-ray single crystal diffractometer. The CCDC number 1906680 contains the supplementary crystallographic data of DPP-2Py, which can be obtained from the Cambridge Crystallographic Data Centre.†Synthesis
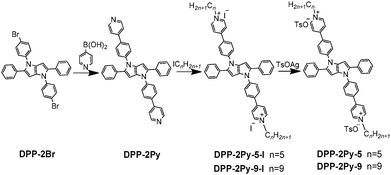
Synthetic routes towards DPP-2Py-5 and DPP-2Py-9 are presented in Scheme 1. DPP-2Br was synthesized according to previously reported methods.14DPP-2Py was synthesized by Suzuki coupling reaction from DPP-2Br and pyridine-4-boronic acid. DPP-2Py-5-I and DPP-2Py-9-I were salified from DPP-2Py and iodinated alkanes. The target products DPP-2Py-5 and DPP-2Py-9 were synthesized by anion exchange reactions and further purification. Detailed synthesis processes and characterization are presented in the ESI.†Results and discussion
Optical properties
To evaluate the optical properties of DPP-2Py-5 and DPP-2Py-9, UV-vis absorption measurements were performed first. Fig. 1 shows the absorption spectra of DPP-2Py-5 and DPP-2Py-9 in THF solutions (10−5 M) and solid states. In THF solutions (Fig. 1A), the same absorption bands were observed at 349 and 371 nm, respectively, attributed to the π–π* transition of whole molecular conjugated skeletons and intramolecular charge transfer (ICT) from the aryl pyrrolo[3,2-b]pyrrole ring to the pyridine ring with positive charge, which indicated that the peripheral alkyl chains with different length didn’t affect the absorption profile in single molecular states. In solid states (Fig. 1B), the absorption spectra of DPP-2Py-5 and DPP-2Py-9 were red-shifted and broader compared to that in solution with peaks at 390 and 401 nm, showing the stronger intermolecular interactions.15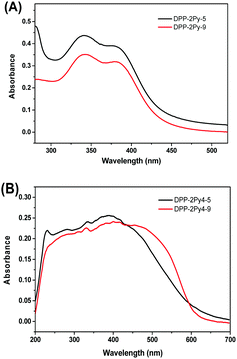 | ||
| Fig. 1 The absorption spectra of DPP-2Py-5 and DPP-2Py-9 in THF solutions (10−5 M) (A) and solid states (B). | ||
The precursor DPP-2Py of DPP-2Py-5 and DPP-2Py-9 showed a distinct AIE effect in DMSO/H2O systems with maximal 26-fold emission enhancement (Fig. S1, ESI†). There were plentiful intermolecular CH–π and H-bonds without π–π interactions (Fig. S2, ESI†) from the analysis of the single crystal structure of DPP-2Py which could restrict intramolecular rotation to activate radiative transition and strong emission in aggregation states.16
The increase in the polarity of DPP-2Py-5 and DPP-2Py-9 with pyridination caused a change in their solubility in common organic solvents and imparted amphiphilic character.17 Therefore, the AIE effects of DPP-2Py-5 and DPP-2Py-9 couldn’t be studied by common good/poor solvent methods like THF/H2O and DMSO/H2O. Hence, we utilized the original experimental methods by increasing viscosity and reducing temperature to study their AIE behaviors.18
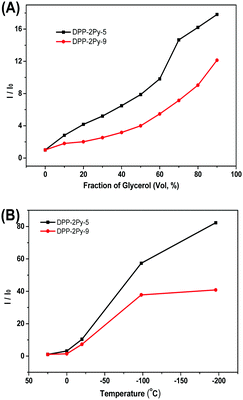
Fig. S3 (ESI†) shows the emission spectra of DPP-2Py-5 and DPP-2Py-9 in methanol/glycerol mixtures. Both DPP-2Py-5 and DPP-2Py-9 in methanol (10−5 M) showed no emission. With the increase in the volume fraction of glycerol (fG) in the mixtures, the emission intensities of DPP-2Py-5 and DPP-2Py-9 gradually increased and reached the maximum with a 17.7- and 12.3-fold increase in the mixture with fG = 90% (Fig. 2A), and the emission wavelengths of DPP-2Py-5 and DPP-2Py-9 stabilized at 510 nm. This result indicated restricted molecular rotation blocking the radiation pathway and boosting emission in higher viscosity mixtures, that is to say, the RIR mechanism.1 The maximal emission enhancement of DPP-2Py-5 was higher than that of DPP-2Py-9, which should be explained in terms of the movement of the long alkyl chain of DPP-2Py-9 being relatively easier than that of DPP-2Py-5 in fG = 90%. The emission enhancement of both DPP-2Py-5 and DPP-2Py-9 with higher viscosity mixtures might be attributed to the restriction of the single intramolecular rotation (single molecular motion). It is verified by the UV-vis absorption of DPP-2Py-5 and DPP-2Py-9 in fG = 0, 70 and 90% mixtures (Fig. S4, ESI†). The wavelength of absorption bands of DPP-2Py-5 and DPP-2Py-9 remained stable without tailing phenomena in the onset of absorption bands indicating that no aggregation occurred.
Since decreasing temperature can also reinforce the RIR process, the emission of DPP-2Py-5 and DPP-2Py-9 in methanol solution (10−5 M) under different temperatures was investigated (Fig. S5, ESI†). When the methanol solution was respectively at room temperature and 0 °C, the emission was invisible. When the temperature was decreased to −25 °C, they showed weak cyan emission. On continuing to decrease the temperature to −98 °C with frozen methanol solution, their emissions increased rapidly with a maximum of 83-fold for DPP-2Py-5 and 41-fold for DPP-2Py-9 (Fig. 2B). Increasing viscosity and reducing temperature both retarded the intramolecular motions and enhanced the emission of DPP-2Py-5 and DPP-2Py-9 due to the AIE mechanism, demonstrating that DPP-2Py-5 and DPP-2Py-9 had AIE properties.
Mesomorphic properties
Pyridinium derivatives possessing long alkoxy chains were often studied as ILCs.19 Ionic interactions play an important role in forming mesogenic phase.The thermal properties of DPP-2Py-9 were firstly characterized by TGA (Fig. S6, ESI†) and DSC. Fig. 3 shows the DSC curves of DPP-2Py-9 at 5 °C min−1 scanning rate under nitrogen flow. During the first heating process, an endothermic platform which should be assigned to the glass transition temperature and a broad endothermic peak can be seen at 97 and 190 °C, and a broad exothermic peak was observed at 145 °C during the first cooling process, while two broad endothermic peaks at 180 and 212 °C were detected in the second heating cycle. Combined with POM analysis, the endothermic peak at 180 °C of DPP-2Py-9 in the second heating process corresponded to the phase transition from crystalline phase to LC phase, and that at 212 °C to the transition from LC phase to isotropic liquid. The broad endothermic and exothermic peak might be attributed to ionic interactions between the positive charge and negative charge of DPP-2Py-9, which was common in the already reported literature about ILCs.20 Pyridinium salt DPP-2Py-9 possessing longer alkyl chains exhibited sematic phases with marble-like textures on examination by POM (vide infra). However, the LC textures of DPP-2Py-5 couldn’t be found by POM observations. The DSC curves of DPP-2Py-5 in the second heating process showed only one endothermic peak at 284 °C (Fig. S7, ESI†) which indicated that DPP-2Py-5 has no LC character due to the shorter flexible alkyl chains. These results indicated the importance of suitable length of alkyl chains for forming LC phase and the distinct influence of the small structural change on their thermoresponsive bahaviors.21 Therefore, the main discussion focused on DPP-2Py-9 in the later section.
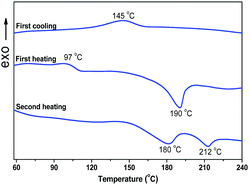 | ||
| Fig. 3 The DSC curves of DPP-2Py-9 in the first heating, first cooling and second heating processes at 5 °C min−1 scanning rate under nitrogen flow. | ||
Fig. 4 shows the POM images of the textures depending on the self-assembly process of DPP-2Py-9 during the first cooling process and the second heating process.22 The typical conic textures were observed in both the cooling process below 185 °C and the heating process from 180 to 212 °C, which showed that the LC phase of DPP-2Py-9 was enantiotropic.
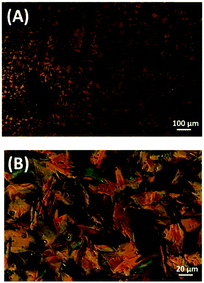 | ||
| Fig. 4 The POM images of the textures of DPP-2Py-9 during the first cooling process (A) and the second heating process (B). | ||
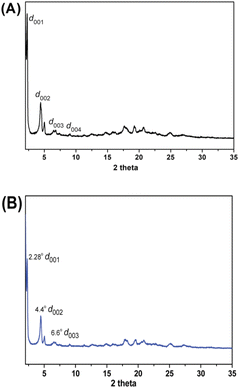
The structure identification of the LC phase of DPP-2Py-9 was performed by temperature-dependent XRD and WAXD. Fig. S8 (ESI†) presents the XRD patterns of DPP-2Py-9 from 3° to 35° scanned at 185 °C in the second heating process, and several reflection peaks at 2θ = 4.3°, 6.6°, 8.8°, 11.1° were detected with d spacings of 20.5, 13.5, 10.1 and 7.9 Å which proved clearly that the DPP-2Py-9 molecules organized into a lamellar phase.23 A broad diffraction signal centred at 2θ = 6.9° was mainly ascribed to the covering foil used in the experimental set-up.24 To clearly distinguish the position of the reflection peaks of DPP-2Py-9 in the small-angle region, the WAXD patterns from 2° to 35° scanned at 180 °C (Fig. 5A) and 190 °C (Fig. 5B) were studied in the second heating process. A sharp reflection peak at 2θ = 2.27° was seen at 180 °C and 190 °C, corresponding to an interlayer spacing (d) of 38.9 Å, and two reflection peaks at 2θ = 4.4° and 6.6° were consistent with that of XRD patterns. A broad halo with a weak reflection peak in the wide-angle region between 15° and 25° of 2θ indicated the peripherally molten alkyl chains.
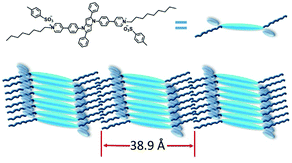
These WAXD and XRD reflections were a distinct designation of the layer ordering characteristic of the smectic mesophase with a d-spacing of 38.9 Å.25 The molecular length (L) of DPP-2Py-9 calculated by Gauss software with a DFT-optimized structure was 41.1 Å. The d/L of DPP-2Py-9 remained constant (0.95) at 180 °C and 190 °C, indicating that the nature of the smectic mesophase of DPP-2Py-9 was smectic A (SmA) phase.26 The schematic diagram of the SmA phase of DPP-2Py-9 molecules is shown in Fig. 6.
Temperature-dependent fluorescence properties
As discussed above, DPP-2Py-9 with longer alkyl chains showed LC characteristics, while DPP-2Py-5 didn’t show mesogenic properties. It is well known that the molecular stacking arrangements in the crystal state, LC state and isotropic liquid sate are different. The aggregation states make a significant impact on photoluminescence behaviours. So the temperature-dependent photoluminescence was studied to evaluate the effects caused by molecular stacking arrangements.The variation in the wavelength and intensity of fluorescence emission of DPP-2Py-5 as a function of temperature is shown in Fig. S9 (ESI†). The PL intensity of DPP-2Py-5 decreased gradually with increasing temperature from 40 to 280 °C which was ascribed to the thermally activated nonradiative decay process (Fig. S9B, ESI†); on the other hand, the emission wavelength remained unchanged. Compared to the temperature-dependent fluorescence emission of DPP-2Py-5, DPP-2Py-9 had a relatively complex process.
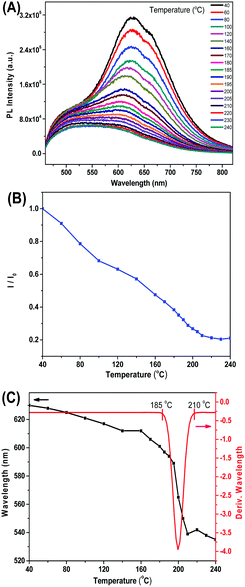
As shown in Fig. 7A, DPP-2Py-9 showed a main emission peak at 630 nm and a shoulder peak at 500 nm at 40 °C, which was associated with the amorphous state of DPP-2Py-9 as proved by the XRD curve shown in Fig. S10 (ESI†). The PL intensity of DPP-2Py-9 gradually decreased with increasing temperature, which was ascribed to the thermally activated excited state energy dissipation, and remained stable in liquid state (Fig. 7B). The I/I0 values in Fig. 7B originated from the intensity ratio of the maximal emission peaks around 600 nm in Fig. 7A. The wavelength of DPP-2Py-9 hypochromically shifted as the temperature was increased from 40 to 180 °C (Fig. 7C). In the LC state (180–210 °C), a series of broad PL emission bands from 610 to 520 nm with lower PL intensity were detected, and the maximal PL wavelength was swiftly hypochromically shifted. Above 210 °C, the PL spectral profiles were unchanged in the isotropic liquid state.
The differential curve of PL wavelength in the heating process varied drastically in the temperature range of 185 and 210 °C (Fig. 7C), which was very close to the LC temperature range 180–212 °C measured by DSC. The PL wavelength of DPP-2Py-9 in mesomorphic phase showed the biggest changes in the heating process, which were caused by the evident change of aggregation states. Consequently, it opens a new technical method for utilizing PL spectroscopy to characterize the liquid crystalline behaviours.
Conclusions
Two AIE compounds DPP-2Py-5 and DPP-2Py-9 with a core consisting of a pyrrolo[3,2-b]pyrrole ring linked by flexible alkyl chains were synthesized. Their AIE behaviors were confirmed by increasing viscosity and reducing temperature which restricted the intramolecular rotations and enhanced the emission of DPP-2Py-5 and DPP-2Py-9 by the AIE mechanism. Based on the combination of DSC, POM and XRD analysis, the experimental results proved that DPP-2Py-9 has marble-like LC textures with SmA phase and DPP-2Py-5 didn’t show LC properties. The LC temperature range of DPP-2Py-9 was 180–212 °C as measured by DSC. The above results revealed that the suitable length of alkyl chains plays a significant role in making compounds exhibit LC properties. According to the temperature-dependent fluorescence emission spectrum, the PL intensity and wavelength of DPP-2Py-9 were gradually decreased and hypochromically shifted as the temperature increased. In the LC state, the maximal PL wavelength was swiftly hypochromically shifted from 630 to 520 nm. The LC temperature range between 185 and 210 °C determined by the differential curve of PL wavelength vs. temperature was close to that determined by the DSC technique. Therefore, the PL emission spectroscopy could be used as a new technical method to characterize the LC behaviours in future research.Conflicts of interest
There are no conflicts to declare.Acknowledgements
We are grateful for the support from the National Basic Research Program of China (973 Program: 2013CB834704) and the National Natural Science Foundation of China (No. 51673024, 51328302, 21404010).Notes and references
- J. Mei, N. L. C. Leung, R. T. K. Kwok, J. W. Y. Lam and B. Z. Tang, Chem. Rev., 2015, 115, 11718 CrossRef CAS PubMed.
- D. Y. Zhao, F. Fan, J. Cheng, Y. L. Zhang, K. S. Wong, V. G. Chigrinov, H. S. Kwok, L. Guo and B. Z. Tang, Adv. Opt. Mater., 2015, 3, 199 CrossRef CAS.
- J. Mei, Y. Hong, J. W. Y. Lam, A. J. Qin, Y. H. Tang and B. Z. Tang, Adv. Mater., 2014, 26, 5429 CrossRef CAS PubMed.
- (a) Y. Sagara, S. Yamane, T. Mutai, K. Araki and T. A. Kato, Adv. Funct. Mater., 2009, 19, 1869 CrossRef CAS; (b) C. Mowatt, S. M. Morris, M. H. Song, T. D. Wilkinson, R. H. Friend and H. J. Coles, J. Appl. Phys., 2010, 107, 043101 CrossRef.
- (a) M. O’Neill and S. M. Kelly, Adv. Mater., 2003, 15, 1135 CrossRef; (b) Y. Wang, J. Shi, J. Chen, W. Zhu and E. Baranoff, J. Mater. Chem. C, 2015, 3, 7993 RSC.
- X. Pan, S. F. Xiao, C. S. Wang, P. Cai, X. M. Lu and Q. H. Lu, Opt. Commun., 2009, 282, 763 CrossRef CAS.
- G. L. Law, C. M. Andolina, J. Xu, V. Luu, P. X. Rutkowski, G. Muller, D. K. Shuh, J. K. Gibson and K. N. Raymond, J. Am. Chem. Soc., 2012, 134, 15545 CrossRef CAS PubMed.
- A. Liedtke, M. O’Neill, A. Wertmöller, S. P. Kitney and S. M. Kelly, Chem. Mater., 2008, 20, 3579 CrossRef CAS.
- E. Peeters, M. P. T. Christiaans, R. A. J. Janssen, H. F. M. Schoo, H. P. J. M. Dekkers and E. W. Meijer, J. Am. Chem. Soc., 1997, 119, 9909 CrossRef CAS.
- S. Sergeyev, W. Pisula and Y. H. Geerts, Chem. Soc. Rev., 2007, 36, 1902 RSC.
- (a) W. Z. Yuan, Z. Q. Yu, P. Lu, C. M. Deng, J. W. Y. Lam, Z. M. Wang, E. Q. Chen, Y. G. Ma and B. Z. Tang, J. Mater. Chem., 2012, 22, 3323 RSC; (b) J. Kim, S. Cho and B.-K. Cho, Chem. – Eur. J., 2014, 20, 12734 CrossRef CAS PubMed; (c) H. B. Lu, L. Z. Qiu, G. Y. Zhang, A. X. Ding, W. B. Xu, G. B. Zhang, X. H. Wang, L. Kong, Y. P. Tian and J. X. E. Yang, J. Mater. Chem. C, 2014, 2, 1386 RSC; (d) Y. Wang, Y. Liao, C. P. Cabry, D. Zhou, G. Xie, Z. Qu, D. W. Bruce and W. Zhu, J. Mater. Chem. C, 2017, 5, 3999 RSC; (e) H. T. Bui, J. Kim, H.-J. Kim, B.-K. Cho and S. Cho, J. Phys. Chem. C, 2016, 120, 26695 CrossRef CAS; (f) H. Jing, L. Lu, Y. Feng, J. F. Zheng, L. Deng, E.-Q. Chen and X.-K. Ren, J. Phys. Chem. C, 2016, 120, 27577 CrossRef CAS; (g) J. H. Wan, L. Y. Mao, Y. B. Li, Z. F. Li, H. Y. Qiu, C. Wang and G. Q. Lai, Soft Matter, 2010, 6, 3195 RSC; (h) H. Lu, L. Qiu, G. Zhang, A. Ding, W. Xu, G. B. Zhang, X. Wang, L. Kong, Y. Tian and J. X. Yang, J. Mater. Chem. C, 2014, 2, 1386 RSC; (i) H. Lu, S. Wu, C. Zhang, L. Qiu, X. Wang, G. Zhang, J. Hu and J. Yang, Dyes Pigm., 2016, 128, 289 CrossRef CAS; (j) S. J. Yoon, J. H. Kim, K. S. Kim, J. W. Chung, B. Heinrich, F. Mathevet, P. Kim, B. Donnio, A. J. Attias, D. H. Kim and S. Y. Park, Adv. Funct. Mater., 2012, 22, 61 CrossRef CAS.
- N. Jordao, H. Cruz, A. Branco, F. Pina and L. C. Branco, ChemPlusChem, 2015, 80, 202 CrossRef CAS.
- (a) S. Kohmoto, T. Chuko, S. Hisamatsu, Y. Okuda, H. Masu, M. Takahashi and K. Kishikawa, Cryst. Growth Des., 2015, 15, 2723 CrossRef CAS; (b) L. Veltri, V. Maltese, F. Auriemma, C. Santillo, S. Cospito, M. L. Deda, G. Chidichimo, B. Gabriele, C. D. Rosa and A. Beneduci, Cryst. Growth Des., 2016, 16, 5646 CrossRef CAS.
- Z. Peng, Y. C. Ji, Z. Wang, B. Tong, J. B. Shi and Y. P. Dong, Acta Chim. Sin., 2016, 74, 942 CrossRef CAS.
- C. Arantes, M. Scholz, R. Schmidt, V. Dehm, M. L. M. Rocco, A. Schöll, F. Reinert and F. Würthner, Appl. Phys. A: Mater. Sci. Process., 2012, 108, 629 CrossRef CAS.
- Y. Lin, G. Chen, L. Zhao, W. Z. Yuan, Y. Zhang and B. Z. Tang, J. Mater. Chem. C, 2015, 3, 112 RSC.
- K. Goossens, K. Lava, C. W. Bielawski and K. Binnemans, Chem. Rev., 2016, 116, 4643 CrossRef CAS PubMed.
- (a) J. Chen, B. Xu, X. Ouyang, B. Z. Tang and Y. Cao, J. Phys. Chem. A, 2004, 108, 7522 CrossRef CAS; (b) J. Chen, H. Peng, C. C. W. Law, Y. P. Dong, J. W. Y. Lam, I. D. Williams and B. Z. Tang, Macromolecules, 2003, 36, 4319 CrossRef CAS.
- S. Asaftei, M. Ciobanu, A. M. Lepadatu, E. Song and U. Beginn, J. Mater. Chem., 2012, 22, 14426 RSC.
- H. Jing, L. Lu, Y. Feng, J. F. Zheng, L. Deng, E.-Q. Chen and X.-K. Ren, J. Phys. Chem. C, 2016, 120, 27577 CrossRef CAS.
- K. Nabeya, T. Muraoka, N. Hoshino, M. Aizawa, T. Kajitani, T. Akutagawa, A. Shishido, T. Fukushima and K. Kinbara, Mater. Chem. Front., 2018, 2, 969 RSC.
- G. Albano, M. Lissia, G. Pescitelli, L. A. Aronica and L. D. Bari, Mater. Chem. Front., 2017, 1, 2047 RSC.
- S. Cospito, A. Beneduci, L. Veltri, M. Salamonczyk and G. Chidichimo, Phys. Chem. Chem. Phys., 2015, 17, 17670 RSC.
- K. Goossens, K. Lava, P. Nockemann, K. V. Hecke, L. V. Meervelt, K. Driesen, C. Gçrller-Walrand, K. Binnemans and T. Cardinaels, Chem. – Eur. J., 2009, 15, 656 CrossRef CAS PubMed.
- I. P. Ilchishin, L. N. Lisetski and T. V. Mykytiuk, Opt. Mater. Express, 2011, 1, 1484 CrossRef CAS.
- K. R. Reddy, E. Varathan, N. P. Lobo, S. Easwaramoorthi and T. Narasimhaswamy, J. Phys. Chem. C, 2016, 120, 22257 CrossRef CAS.
Footnote |
| † Electronic supplementary information (ESI) available. CCDC 1906680. For ESI and crystallographic data in CIF or other electronic format see DOI: 10.1039/c9qm00208a |
| This journal is © the Partner Organisations 2019 |

